Every spring, Jazz at Lincoln Center brings the best high school big bands in the country to New York to play Duke Ellington. It’s a joy to watch. It’s also, year after year, a showcase dominated by two kinds of schools: audition-based arts magnets, and suburban districts with more money than their costs require, sending kids who are far less likely to be poor than the kids one town over.
We like to call jazz America’s democratic art form, a music stitched together from blues and spirituals, New Orleans brass bands, Afro-Cuban rhythm and European harmony, open to anyone with a horn and something to say. Our school funding systems didn’t get the memo. And the problem doesn’t stop at who wins high school trophies. It shows up in where today’s most acclaimed young players went to school.
Put bluntly: if you want your kid playing lead alto at Lincoln Center, practice helps. Real estate, or an audition seat, helps more.
Two ways to look at it
Who wins. I pulled every high school ensemble award from DownBeat’s Student Music Awards (2011–2014 and 2017–2020, the years in DownBeat’s online archive) and every U.S. finalist in Jazz at Lincoln Center’s Essentially Ellington competition from 2009 through 2026. That’s 446 appearances by 121 programs.
Who makes it. I traced the high schools of 85 U.S.-raised DownBeat Critics Poll winners under 65: Rising Star winners from 2016 through 2026 and main-poll winners from 2016 through 2022.
As with our recent look at AP math access, I compared each public school and its district with its own labor market: the surrounding districts competing for the same teachers, not the nation. Funding adequacy comes from the National Education Cost Model in the School Finance Indicators Database, which compares actual spending with the estimated cost of reaching national-average outcomes. School demographics come from federal enrollment data (2021–22).
Who wins: better funded, less poor, whiter than the neighbors
Among the 83 neighborhood public high schools that won or made the finals, the typical winner is advantaged relative to its neighbors on every measure:
Funding: the median winning district is funded at 1.13 times its labor market’s adequacy, and 61 of 79 are above their regional average.
Poverty: the median winning school is 24 percent low-income against 41 percent across the region’s high schools. Roughly three of every four nearby high schools are poorer.
Race: the median winner is 25 percent Black and Hispanic against 36 percent regionally.
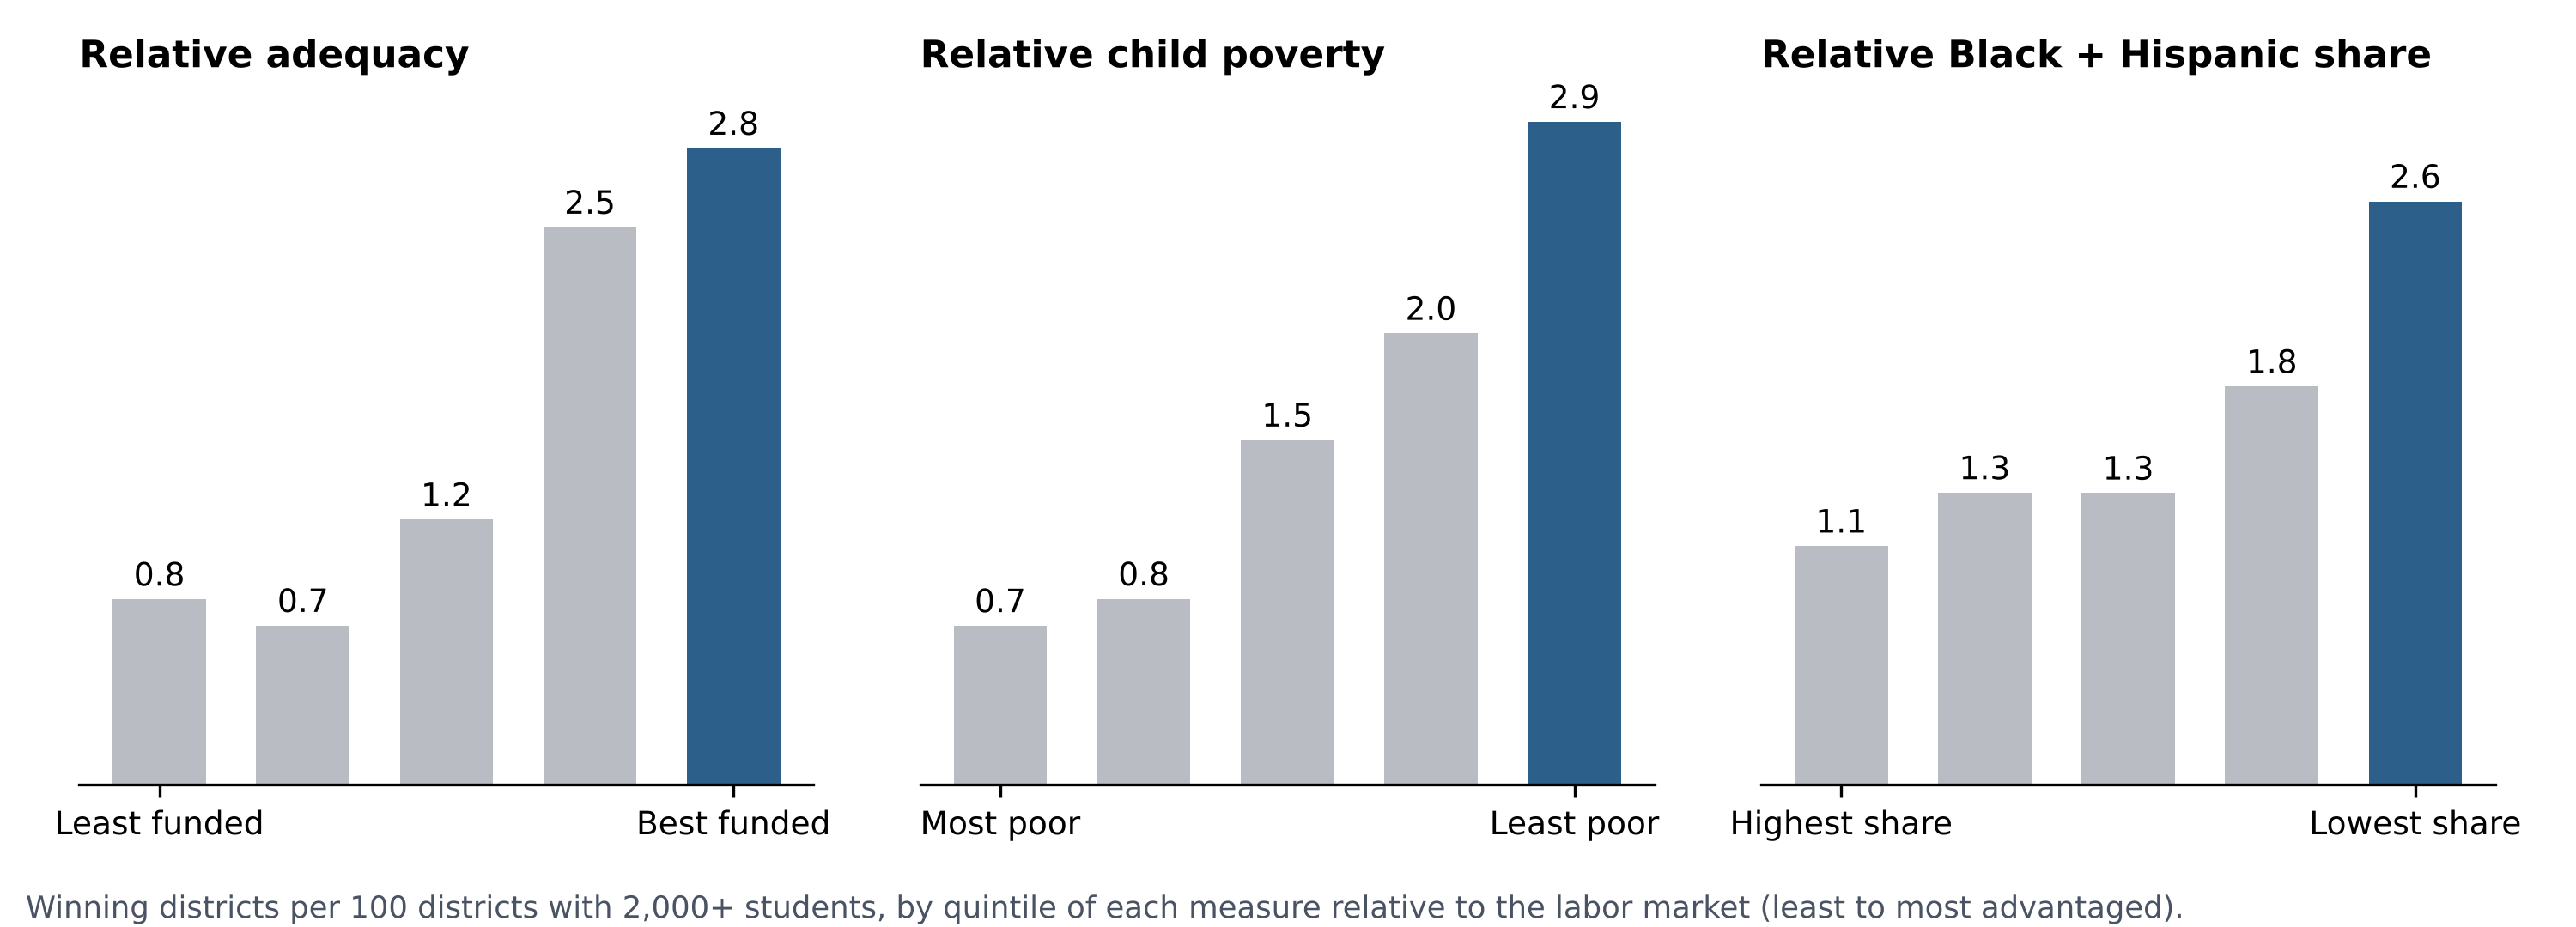
It isn’t just the winners. Across all districts with 2,000 or more students, the chances of producing a winning program climb steadily with relative funding and fall with relative poverty.
Districts with a winning public high school jazz program, per 100 districts with 2,000+ students. Most vs. least advantaged fifth: adequacy 3.4×, poverty 4.2×, Black + Hispanic share 2.4×. Sources: NECM 2009–2024; DownBeat and Essentially Ellington results.
Funding, poverty and race travel together, so it’s hard to pull them apart statistically. In models with all three, relative poverty carries the most weight. Funding matters most when comparing districts within the same state: an extra 0.10 of relative adequacy raises the odds of having a winner by about 17 percent.
Who makes it: the neighborhood band room has dropped out
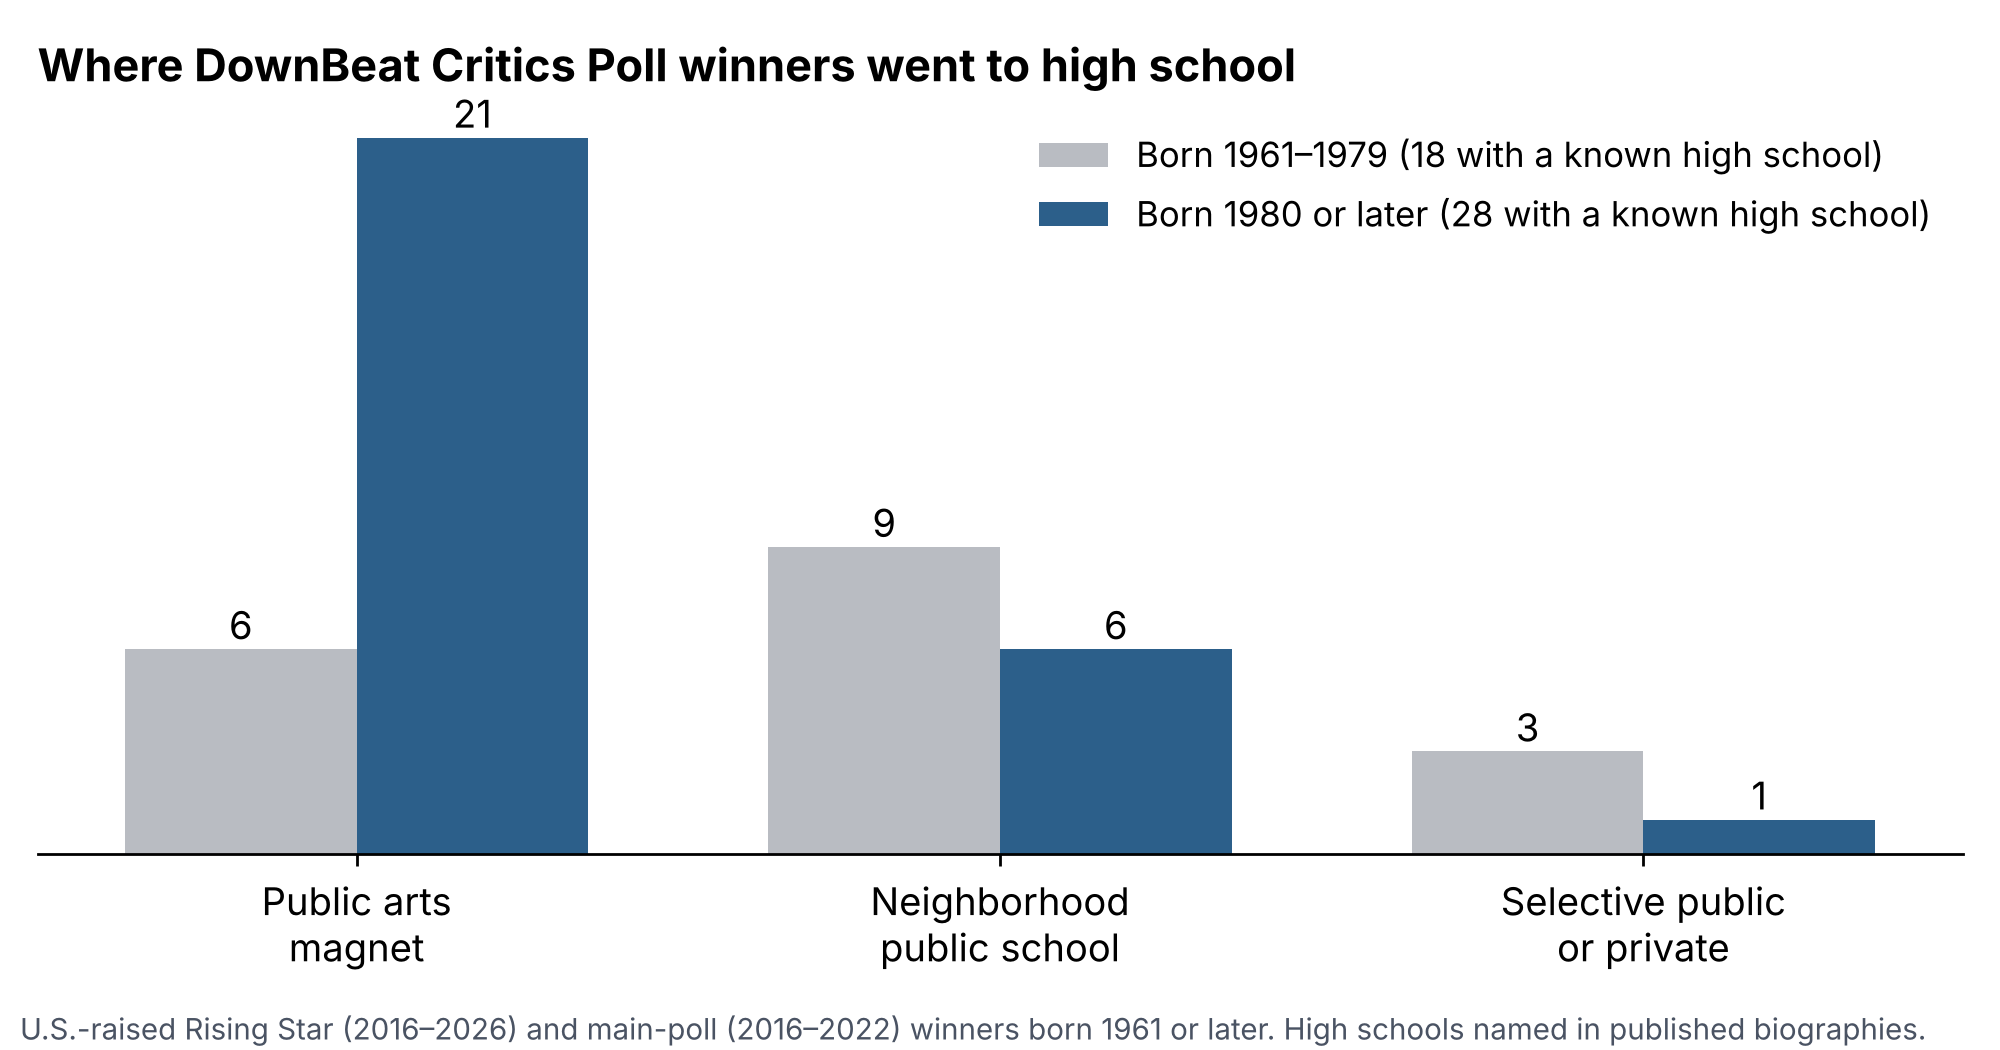
The Critics Poll winners tell a generational story. Among those born between 1961 and 1979, half of those whose high school is on record came up through neighborhood public schools, and most of those schools are poorer than their regions: Wycliffe Gordon at Butler High in Augusta, Gregory Porter at Highland High in Bakersfield, Ralph Peterson at Pleasantville High in New Jersey, Jimmy Greene at Bloomfield High in Connecticut, Terri Lyne Carrington at Medford High outside Boston.
High schools of U.S.-raised DownBeat Critics Poll winners born 1961 or later, as named in published biographies. 46 of 85 have a named high school.
For those born since 1980, the picture flips. Twenty-one of 28 with a known high school came through public arts magnets: Houston’s High School for the Performing and Visual Arts (Robert Glasper, James Francies), LaGuardia (Lakecia Benjamin), Douglas Anderson in Jacksonville (Theo Croker, Ulysses Owens Jr., Jamison Ross), Duke Ellington in D.C. (Ben Williams), Booker T. Washington in Dallas (Jazzmeia Horn), LACHSA (Gerald Clayton, Kris Bowers). Eleven of the 14 magnets I could measure enroll far fewer low-income students than their regions: a median of 27 percent against 55 percent.
The younger players who did come out of neighborhood schools mostly came from places like John Jay High in Katonah-Lewisboro (Nir Felder; a district funded at 2.66 times its labor market), New Trier (Aaron Weinstein), Berkeley (Ambrose Akinmusire) and Montclair (Emmet Cohen). The older anecdotes fit too: Brad Mehldau and Joel Frahm in the Hall High jazz band in West Hartford, and Kevin Hays and Gary Versace growing up in Greenwich. Thundercat, out of Locke High in Watts, is the real exception.
Magnets: excellence by audition
Public arts magnets are 14 percent of the competition programs in my data but took 19 of the 47 Essentially Ellington podium places since 2009. They are how big, under-funded, majority-minority urban districts compete. Their districts average 0.87 of labor-market adequacy, and Houston, Dallas and Duval are all well below. Dillard in Fort Lauderdale, which is 96 percent Black or Hispanic and 80 percent low-income, has won Essentially Ellington three times. But most magnets enroll a much less poor slice of their cities than the comprehensive high schools down the street. That’s excellence for a few hundred audition-selected kids per city, not a pipeline for everybody.
There are neighborhood-school exceptions worth celebrating. Beloit Memorial in Wisconsin has made 13 Essentially Ellington finals from a district funded at 70 percent of its labor-market adequacy, with two-thirds of its students low-income. Memphis Central won the whole thing in 2025. Garfield in Seattle, Quincy Jones’s alma mater, still wins with a student body that looks like its region. They tend to rest on extraordinary directors, which is exactly the kind of thing adequate funding is supposed to make less rare.
Listen
None of this takes anything away from the kids or their band directors. These are terrific bands. Here is Memphis Central High School, the 2025 Essentially Ellington champion:
Band
Track record
Low-income %, school / region
Watch
Osceola County School for the Arts, Kissimmee, FL (arts magnet)
Essentially Ellington champion 2022, 2023 and 2026
Low-income share is free or reduced-price lunch (direct certification in Massachusetts), 2021–22; “region” is the enrollment-weighted average of high schools in the school’s labor market. More finalist performances are on the Essentially Ellington YouTube channel.
Democratizing jazz is a school finance problem
A nationally competitive jazz program is expensive in ordinary ways. It needs a specialist director (often two), a string bass, a drum kit, a baritone sax and a vibraphone the school owns, rehearsal time in the school day, a middle school feeder band, and money for recording, entry fees and travel. Districts with more money than their costs require can carry all of that as part of a full curriculum. Districts below adequacy cut it first, or concentrate it in a single magnet, or leave it to tuition-based community programs. Those programs took another 10 of the 47 Essentially Ellington podium places.
So, is jazz a music of privilege? Not in any simple sense: many of the best magnets are majority Black and Hispanic, and some of the most decorated bands come from cities that their states under-fund. But the door has narrowed to two entrances: live somewhere advantaged, or win an audition seat. A generation ago a working-class neighborhood high school in Augusta or Bakersfield could still produce a major jazz musician. That’s the door that has closed, and it’s the one adequate, equitable school funding is supposed to hold open. It’s the same story we told about AP math: the programs that look “extra” are exactly where relative funding advantage turns into visible opportunity.
A few caveats. These are competition results, and entering takes a recording and fees, so some strong programs never show up. I could retrieve only 8 of the last 18 years of DownBeat student results. Biographies name a high school for only 46 of the 85 Critics Poll winners, and school demographics are a recent snapshot, not conditions when each musician attended. The full working paper has the models and the complete lists.
Every so often someone discovers a miracle in a southern state. Back in February it was Mississippi. Now it’s Alabama, whose 4th graders gained 6.3 points in NAEP math from 2022 to 2024, against 2.4 points nationally. That gain is being held up as proof that “red state” reform (accountability, science of reading, numeracy coaches, and lately, school choice) is the model for everyone else.
So let’s look. I compare Alabama and Mississippi to Arizona and Florida, the two states that have gone furthest in dispersing public money to charters and private school vouchers, and benchmark all four against Massachusetts and New Jersey. My two points:
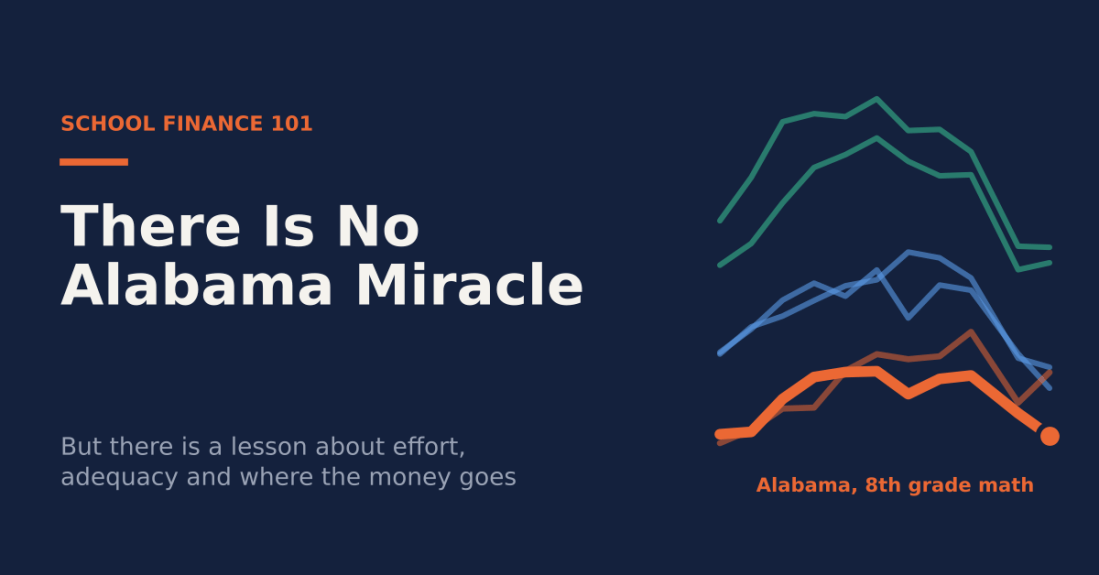
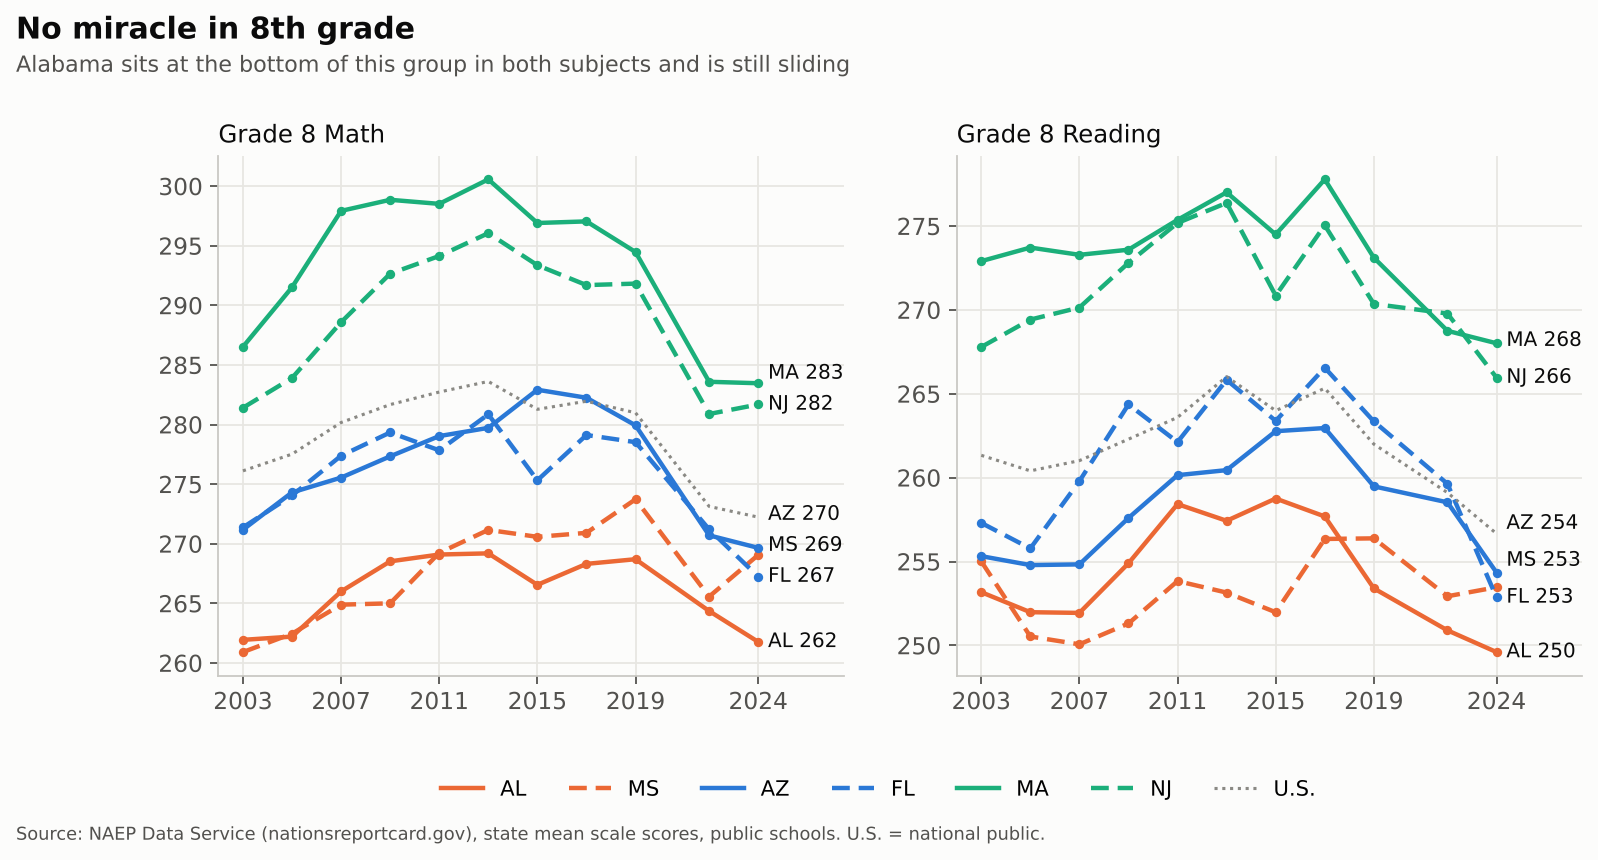
There is no miracle in Alabama. In 8th grade, the better gauge of what a school system adds up to, Alabama is last among these six states in both math and reading, and still sliding.
To the extent Alabama (and Mississippi) aren’t collapsing like Arizona and Florida, it’s less about what they did than what they didn’t do. They didn’t drive fiscal effort to the floor, didn’t build a parallel charter sector, and, until this year, didn’t send public money to private schools at scale. They kept investing in their public schools. Steadily, if not adequately.
No miracle in 8th grade
Alabama’s 8th graders scored 261.8 in NAEP math in 2024. That is essentially the score Alabama posted in 2003 (261.9). In reading, at 249.6, they’re below where they were in 2003 (253.2). Among these six states, Alabama is now last in both subjects.
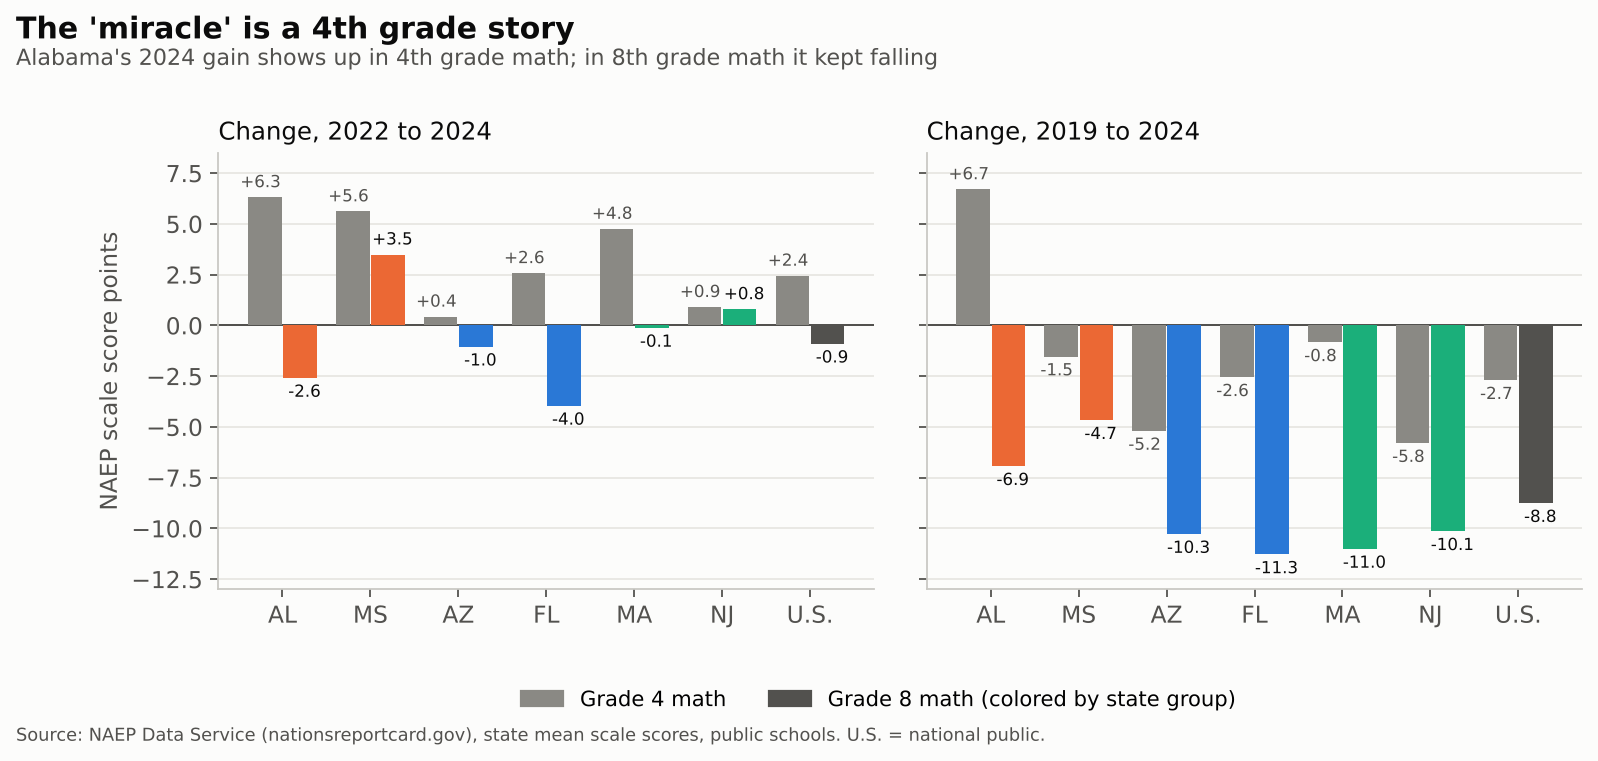
As I said about Mississippi, 8th grade is a better indicator of the cumulative effect of a school system than 4th grade. A 4th grade bump can come from one well-targeted early-grades push. An 8th grade gain means the system is building on it.
The “miracle” lives entirely in 4th grade math. Alabama gained 6.3 points there from 2022 to 2024. Over the same two years, Alabama’s 8th graders lost 2.6 points in math. Since 2019, it’s +6.7 in 4th grade and −6.9 in 8th. If there’s a story here, it’s an early-numeracy push that hasn’t (yet) carried into the middle grades.
If anyone in this group has a claim to a rebound, it’s Mississippi, the only one of the six whose 8th grade math score rose meaningfully from 2022 to 2024 (+3.5). Even so, Mississippi doesn’t catch Massachusetts or New Jersey. Not even close. Both still sit 13 to 14 points above Mississippi in 8th grade math and 13 to 15 points above it in reading.
What Alabama and Mississippi didn’t do
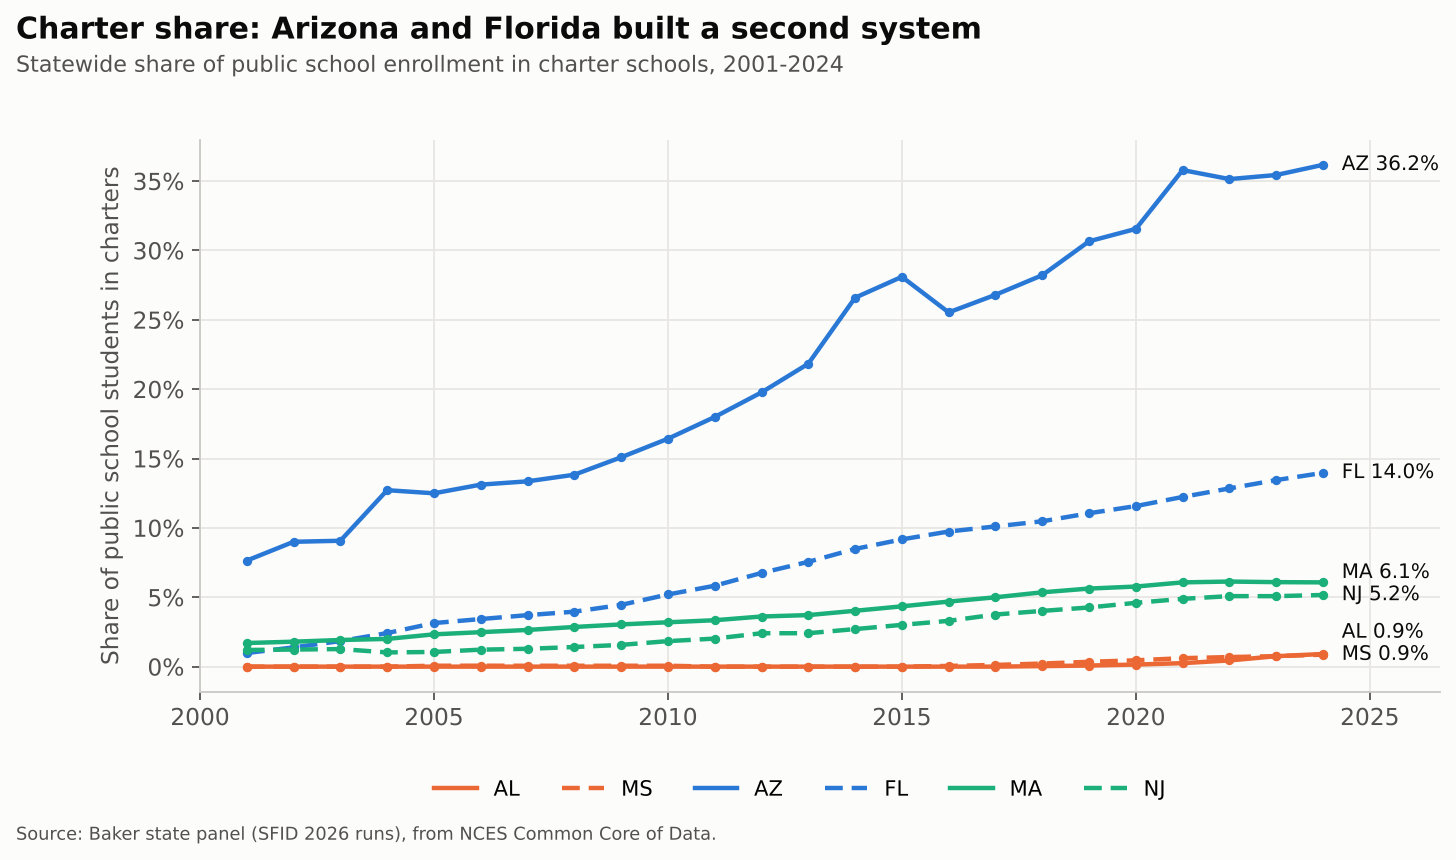
Arizona and Florida have spent two decades building a second school system alongside the first. By 2024, 36 percent of Arizona’s public school students were in charter schools, and 14 percent of Florida’s. Alabama and Mississippi? Under 1 percent each. Even Massachusetts and New Jersey, hardly charter-averse, sit at 5 to 6 percent.
Then there are vouchers, which in their current form are mostly education savings accounts (ESAs). Here the gap is even starker:
State
Program(s)
Students (est.)
Public dollars (est.)
Florida
FES-EO, FES-UA, Tax Credit Scholarship
~515,000 (2025-26)
~$3.8 billion
Arizona
Empowerment Scholarship Accounts (universal since 2022)
100,000+ (early 2026)
~$1 billion a year
Alabama
CHOOSE Act ESA (new in 2025-26)
~23,600 approved in 2025-26; 34,000+ for 2026-27
~$124 million; $174 million for 2026-27
Mississippi
Special-needs ESA, dyslexia and speech-language scholarships
~600 (2024-25)
small
Massachusetts
none
0
0
New Jersey
none
0
0
Florida figure: 432,581 FES scholarship FTEs estimated by the state for 2025-26 (EDR) plus 81,947 Tax Credit Scholarship students (EdChoice); dollars from the Florida Policy Institute via WUSF. Arizona: AZPBS. Alabama: Yellowhammer News and Decatur Daily. Mississippi: Empower Mississippi.
The point isn’t that every charter or voucher dollar is wasted. It’s that Arizona and Florida have been spreading roughly the same (shrinking, as we’ll see) public effort across more and more systems, with less and less accountability for where it lands. During the period over which Alabama’s and Mississippi’s 4th grade gains were built, neither state was doing that.
Effort: Arizona and Florida walked away
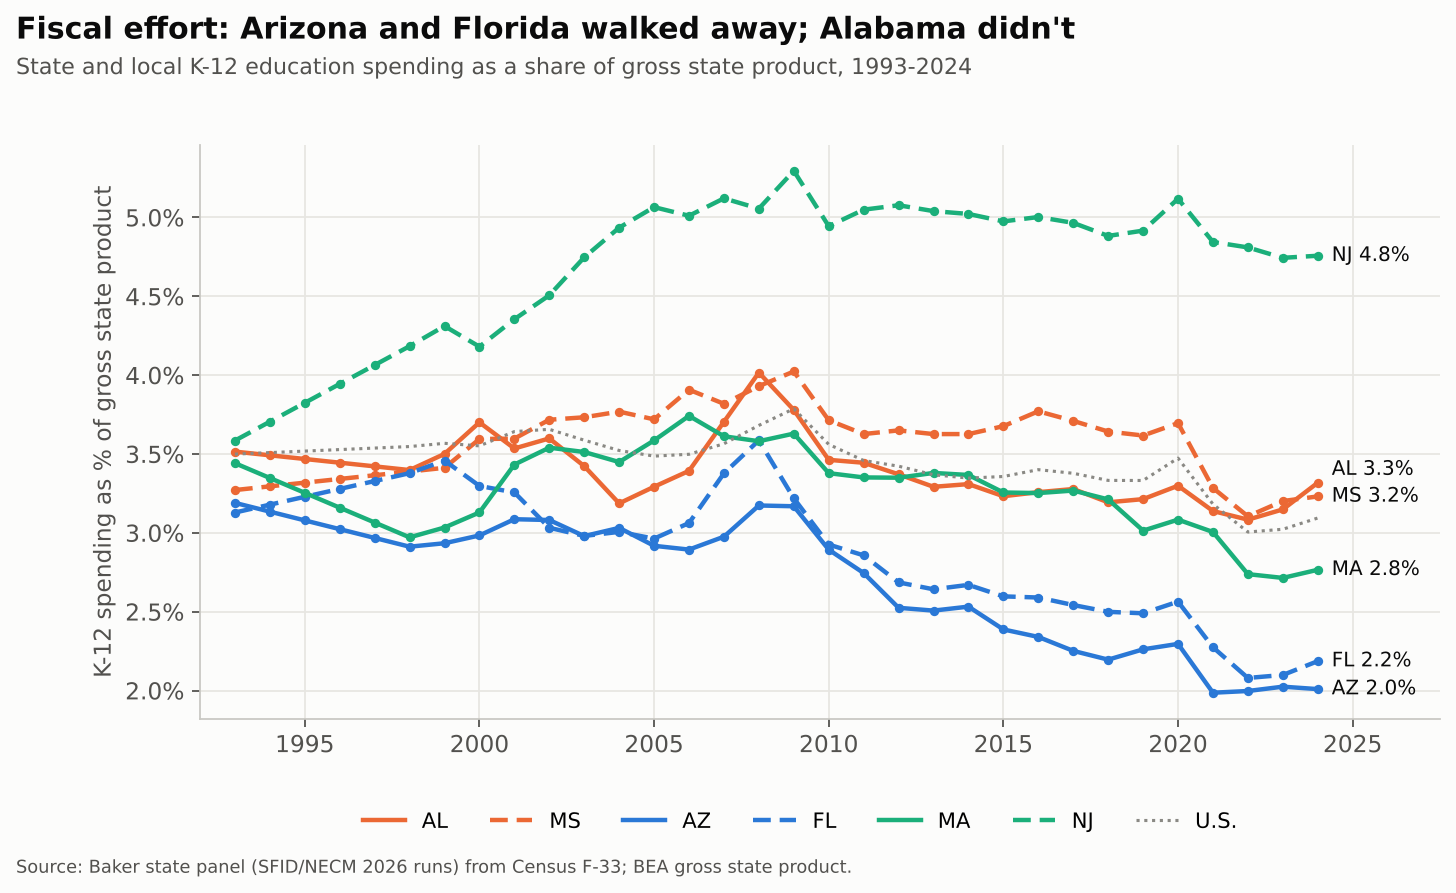
Fiscal effort, K-12 spending as a share of gross state product, tells you how much of its economic capacity a state chooses to put into its schools. Alabama spent 3.3 percent of GSP on K-12 in 2024, the same as in 2013 and a bit above the U.S. state average (3.1 percent). Arizona fell from 2.5 to 2.0 percent over those years, and Florida from 2.6 to 2.2 percent. Both now put in less than half of New Jersey’s effort (4.8 percent).
Alabama isn’t a hero here. Its effort peaked at 4.0 percent in 2008 and took a big hit after the recession. Mississippi dropped from 3.7 to 3.1 percent between 2020 and 2022 (partly fast post-pandemic GSP growth, not only budget choices). But neither has ridden effort to the floor the way Arizona and Florida have.
Spending: the order flipped
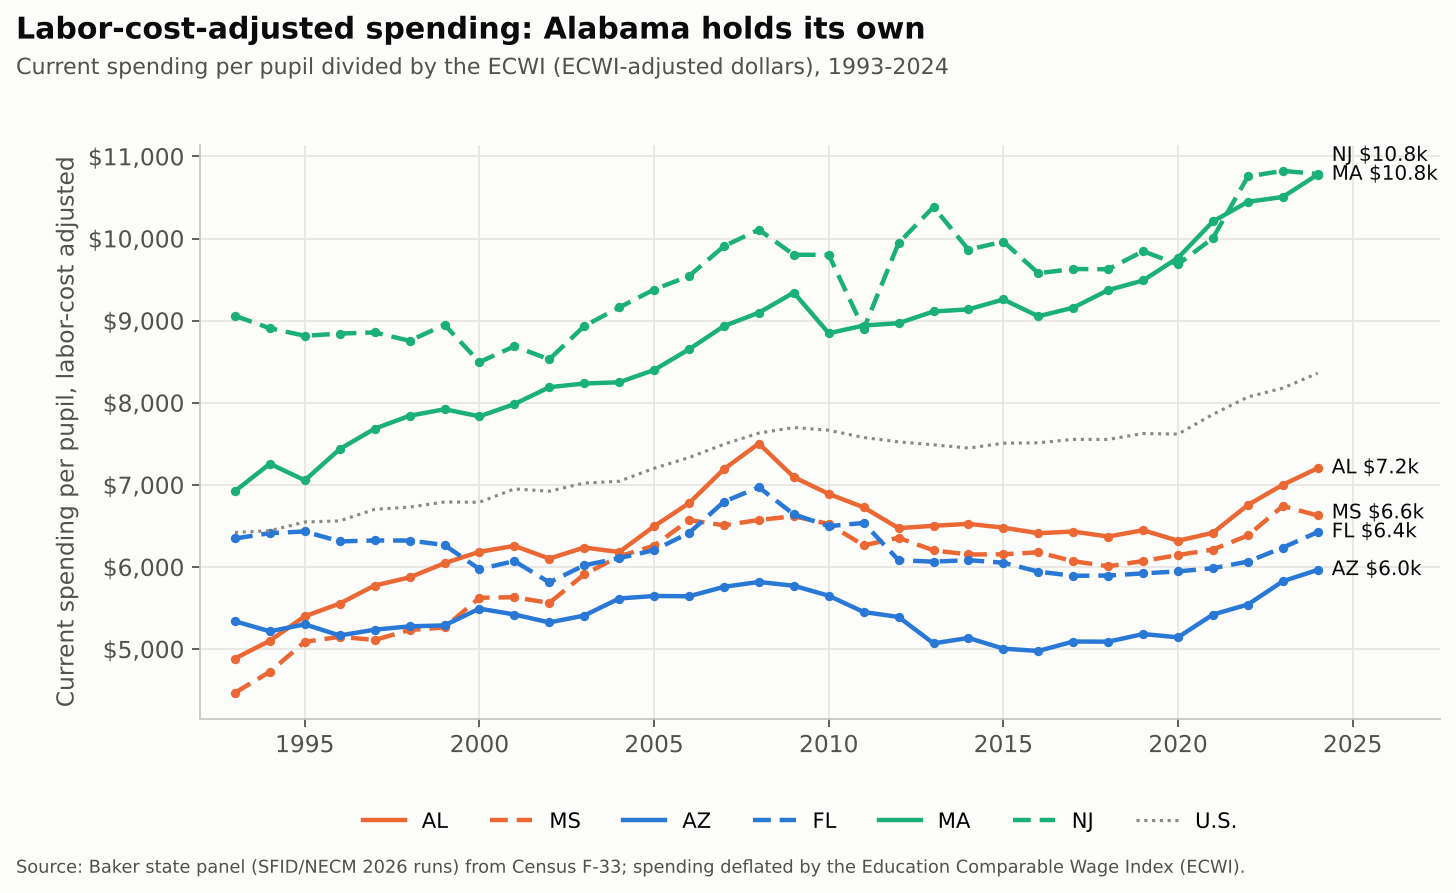
The result shows up in what schools actually have to spend. Adjusting for regional differences in labor costs (using the Education Comparable Wage Index), Alabama and Florida have traded places since the early 1990s. In 1993, Florida spent about $6,350 per pupil in labor-cost-adjusted dollars and Arizona about $5,340, both well ahead of Alabama ($4,890) and Mississippi ($4,470). By 2024:
Alabama: $7,204, up 47 percent since 1993
Mississippi: $6,627, up 48 percent
Florida: $6,425, up 1 percent, and still 8 percent below its 2008 level
Arizona: $5,965, up 12 percent
Massachusetts (up 56 percent, to $10,779) shows what sustained investment looks like at a higher level. Alabama and Mississippi are nowhere near that. But they’ve kept climbing while Arizona and Florida stalled.
Adequacy: steady isn’t the same as enough
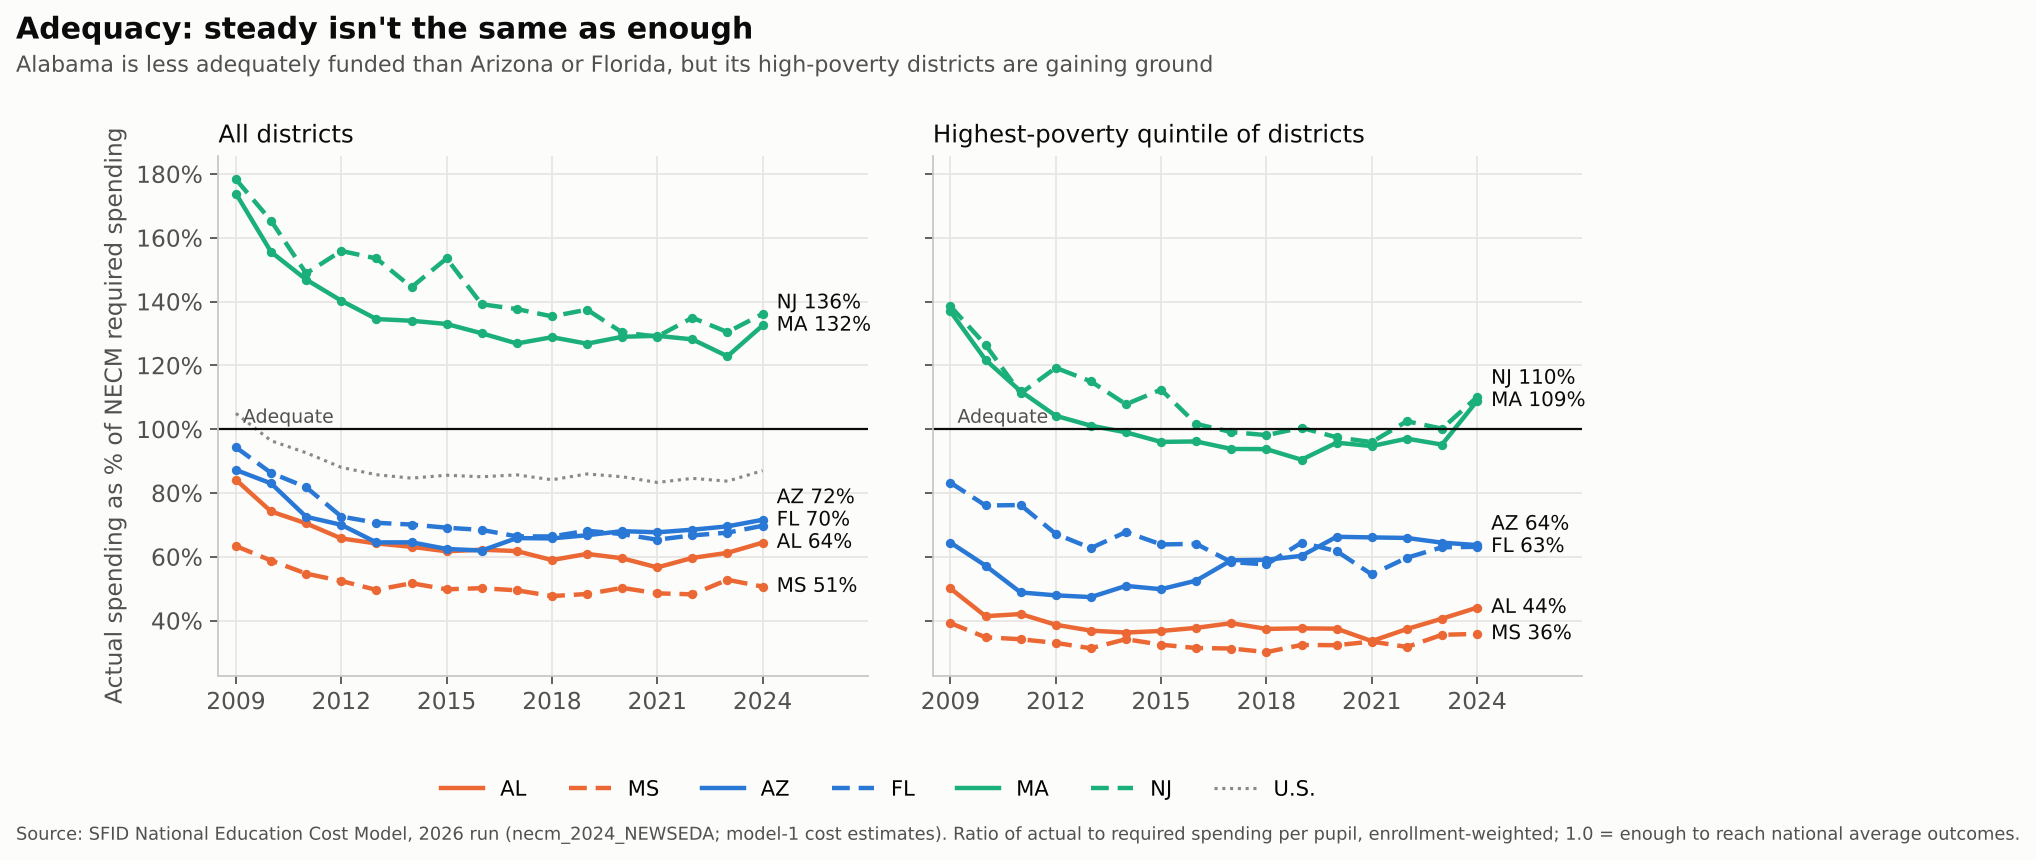
Here’s where the “steady investment” story needs a caveat. Spending more than Arizona isn’t the same as spending enough. Our National Education Cost Model (NECM) estimates what each district would need to spend to reach national average outcomes, given its poverty, labor costs and size. Because Alabama’s children are poorer, its required spending is higher. So even though Alabama outspends Arizona and Florida, it’s further from adequate.
In 2024, Alabama districts spent 64 percent of what the NECM says they need, statewide. That’s third lowest among the 47 states we estimate, ahead of only Mississippi (51 percent) and Texas (59 percent). Arizona sits at 72 percent and Florida at 70. Massachusetts and New Jersey are well above adequate (132 and 136 percent). In Alabama’s highest-poverty districts, the figure is 44 percent.
The encouraging part: Alabama’s high-poverty districts are gaining ground, from 34 percent of adequate in 2021 to 44 percent in 2024, and statewide from 57 to 64 percent. That’s the kind of sustained, if modest, investment that might eventually show up in 8th grade. It isn’t there yet.
Nearly every Alabama child (96 percent) attends a district funded below adequate levels, and about two thirds attend districts in the bottom fifth nationally. A state can hold effort steady and still leave its schools short. Alabama has.
Caveats, and how much they matter
A few things look, at first glance, like they cut against this story. Mostly they don’t.
First, NAEP gains and losses depend on where you start. Low-scoring states have more room to gain, and high-scoring states more room to fall. Across all 50 states, the correlation between a state’s starting score and its change is strongly negative over the long run: about −0.4 to −0.65 for 2013 to 2024, depending on grade and subject. It’s also negative for 4th grade math from 2022 to 2024 (−0.52). So part of Alabama’s 4th grade jump is what you’d expect from a low starting point. Adjusting for that, Alabama still beat expectations by about 3 points, fifth best in the country. Good, not miraculous.
The 2019 to 2024 drop in 8th grade is different. It hit high- and low-scoring states about equally (correlation near zero in math, −0.15 in reading). Here’s how each state did relative to what its 2019 level predicts:
State
Grade 8 math, actual change
vs. expected (rank of 50)
Grade 8 reading, actual change
vs. expected (rank of 50)
Mississippi
−4.7
+4.0 (3rd)
−2.9
+2.2 (8th)
Alabama
−6.9
+1.8 (14th)
−3.8
+1.1 (20th)
Arizona
−10.3
−1.8 (35th)
−5.1
+0.2 (26th)
New Jersey
−10.1
−1.9 (37th)
−4.4
+1.8 (12th)
Florida
−11.3
−2.7 (41st)
−10.5
−4.9 (48th)
Massachusetts
−11.0
−2.8 (42nd)
−5.1
+1.3 (16th)
So, relative to where they started, Alabama and Mississippi held up better than most states, and Florida held up worse than almost anyone. That’s the “not collapsing” point, and it survives the adjustment.
Second, Massachusetts and New Jersey fell further than Alabama in 8th grade math since 2019. In raw points, yes. How much of that is about where they started depends on how you fit it. A straight line says both fell 2 to 3 points more than expected. Let the relationship bend (a lowess fit), and both land about where their starting level predicts (−0.4 each, 29th and 30th of 50). The ten highest-scoring states in 2019 fell 9.0 points on average; the ten lowest fell 8.0. Either way, these gaps are a point or two, about the size of NAEP’s margin of error for a single state. What holds under every specification: Florida near the bottom (41st to 43rd in math, 48th in reading) and Mississippi near the top (3rd or 4th in math).
Third, Alabama is still sliding in 8th grade math in the latest round, down 2.6 points from 2022 to 2024 while Arizona dipped 1.0. That’s one two-year interval, and Alabama’s longer-run, level-adjusted record is average (22nd of 50 for 2013 to 2024). Average is the point: there’s no miracle.
Finally, Alabama just started down Arizona’s road. The CHOOSE Act ESA launched in 2025-26 with about 23,600 approved students, roughly three quarters of them already in private school or homeschooling. For 2026-27, 34,000+ students are approved at $174 million, with $250 million appropriated. Mississippi’s House passed a universal ESA bill this year, 61-59, before the Senate Education Committee killed it.
Expected change in the table comes from a linear regression of each state’s change on its starting score across all 50 states (NAEP state means, public schools). Quadratic and cubic terms add little (R² rises by about one point; the squared term is not significant), but a lowess fit moves Massachusetts and New Jersey to about average.
So what’s the lesson?
There’s no miracle in Alabama. Its 8th graders score where they did two decades ago, it’s last of these six states in both subjects, and its schools remain among the least adequately funded in the country.
But there may be a lesson in the comparison. Over the past decade, Alabama held its fiscal effort and Mississippi kept its above the national average. Both have raised labor-cost-adjusted spending by roughly half since the early 1990s, and both kept their public dollars in their public schools. Arizona and Florida cut effort to among the lowest levels in the nation, stalled their spending, and spread what was left across district schools, charters and private school accounts. Florida in particular is now in free fall.
That’s not a causal analysis, but it’s more rigorous than most of the “miracle” talk I’ve seen. If the folks touting Alabama want to learn something from it, the lesson isn’t the CHOOSE Act. It’s the boring stuff Alabama did before the CHOOSE Act: keep funding your public schools, and keep funding them better, especially where kids are poorest. Now Alabama is about to find out what happens when it stops.
Data notes and sources
NAEP: state mean scale scores, public schools, from the NAEP Data Service, 2003-2024. “U.S.” is national public.
Fiscal effort, labor-cost-adjusted spending, charter share: my state panel built from the 2026 SFID runs (Census F-33, BEA gross state product, NCES Common Core of Data). Spending is current spending per pupil divided by the Education Comparable Wage Index. Public version: SFID State Indicators Database, 2026 release.
Adequacy:SFID National Education Cost Model, 2026 run with updated SEDA outcomes, extended through 2024 (model-1 cost estimates; districts under 100 students and outliers excluded; Alaska, Hawaii and Vermont not estimated). Ratios are enrollment-weighted actual over required spending; “bottom fifth” = the 20 percent of districts nationally furthest below adequate.
Vouchers/ESAs: see the links under the table above. Counts mix awards, participants and FTEs, so treat them as orders of magnitude.
On August 20, Marguerite Roza of Georgetown’s Edunomics Lab stood before Governor Lamont’s Blue-Ribbon Commission on K-12 Education Funding and Accountability and gave Connecticut the same show she has been taking from state to state: a cloud of dots, a slide titled “Weak ROI,” and, on her lab’s Connecticut page, the same 2013 starting line. The Commission is supposed to deliver recommendations by January for a system its own guiding principles say must be adequate, one that “provides the level of resources necessary to serve all students.” Not one graph in Roza’s deck measures what adequacy costs. Not one.
I’ve written a Connecticut-specific brief taking the deck apart, using the National Education Cost Model and Roza’s own graphs:
I have spent my career building the tools that actually answer the question Roza pretends to answer: what it costs to get kids to a given outcome, given who they are, where their schools hire teachers and how big their districts are. I created the School Finance Indicators Database and the cost models behind it. I’ve testified in school funding litigation and before legislatures across the country. And I have been calling out this particular body of work, in public and with receipts, for seventeen years:
2009: a peer-reviewed article in Education Policy Analysis Archives examining the weighted student funding “showcase” districts promoted in this line of work.
2010–2011: a run of posts dismantling the claims one at a time:
By my count, Connecticut is something like the thirtieth time I’ve publicly documented the same moves. As I put it on Bluesky: “for anyone still using this kind of garbage, you’ve been on notice for years.”
Education Week asked researchers about the charts. USC’s Morgan Polikoff: “The message it perpetuates is, school spending is unrelated to student achievement. But that isn’t true.” Allovue founder Jess Gartner: “If you want to share that information side by side, it needs to come with a lot of context.” Katie Roy of Education Resource Strategies: “People who do not have a lot of experience looking at data, charts, and graphs can very easily, just by mistake, misunderstand.” And Chad Aldeman, columnist for The 74: “You can’t just assume that because one trend goes up at one rate, the other trend goes up at the same rate.”
The genre is not new, either. When then-Secretary Betsy DeVos pushed a spending-versus-NAEP chart in 2018, the Shanker Institute’s Matthew Di Carlo called that kind of graph “just one big example of sloppy causal inference” and warned that “using ‘The Graph’s’ approach, one could prove almost anything.” Roza’s version just adds a cherry-picked baseline.
And in the room in Hartford, people saw through it. Lisa Hammersley of the School and State Finance Project told the Commission “it’s just more of a nuanced conversation than just looking at these spots on the graph.” New Haven Mayor Justin Elicker called the framing “condescending and accusatory.” Rep. Tina Courpas (R-Greenwich), questioning whether the state could judge what each town can afford to raise, noted there are “a million things that the state can’t possibly be privy to.” When a Democratic big-city mayor and a Greenwich Republican both push back on your presentation, the problem isn’t partisanship. The problem is the presentation.
What the deck actually did
The brief has the details. Here’s the short version.
The scatterplot refutes its own sermon. Slide 28’s headline is “High poverty districts underspend their peers,” and it’s true. Then the same cloud gets used to argue that districts “with similar wealth” perform differently, so some must be managing money better. Measure what outcomes cost and the cloud snaps into a line. Across Connecticut districts in 2024, raw spending correlates with outcomes at +0.24. Spending relative to the cost of Massachusetts-average outcomes correlates at +0.73. Bridgeport, Waterbury and Hartford each spend about a third of what Massachusetts-average outcomes would cost them. That isn’t inefficiency. That’s deprivation.
The 2013 trend line is rigged by design. The Connecticut graph on Edunomics’ website starts in 2013, at the top of national NAEP and after the post-recession damage was done. Measured against cost, Connecticut fell from 121% of what Massachusetts-average outcomes would cost in 2009 to 97% in 2013 and 71% in 2024. The highest-poverty fifth of districts went from 93% to 67% to 49%. Even Edunomics’ own caption concedes 8th-grade math “saw gains in 2024 with recovery investments.” So much for “Weak ROI.”
The staffing slide can’t keep its own numbers straight. Slide 37 says Connecticut had 103,112 school employees in 2024–25. Slide 43, citing the same Edunomics staffing tool for the same year, says 101,152. Slide 37 says districts “have already lost 3% of enrollment,” while its own chart shows a 7% drop from its chosen baseline. And the “too many staff” story collapses on Roza’s own slide 43: Connecticut added just 176 teachers in six years. The growth is in paraprofessionals and school-based specialists, which is exactly where you’d expect it with rising special education needs and temporary federal relief. Meanwhile district and central administration fell by a third. Roza told the Commission “there is a villain, and it is young people. They’re not having enough kids.” Fine: enrollment is falling, and nobody disputes it. But a slide that turns paraprofessionals and specialists serving rising needs into “overcommitting” isn’t analysis. It’s a verdict in search of a chart.
Enough
This isn’t a difference of methodological taste. It’s a presentation that strips out cost, picks its baselines to manufacture a conclusion, and points a state commission at its poorest districts as if they were the problem. It has been explained, patiently and repeatedly, in peer review, in policy briefs, in legislative testimony and in the press, for seventeen years. Repeating it after all that isn’t an oversight. It’s a choice.
The Commission owes Connecticut’s children a report grounded in what adequacy costs. These graphs should be nowhere near it: not in the January report, not in testimony, not in budget hearings, not in board training. And anyone who puts them in front of Connecticut policymakers should be asked, publicly, why they chose 2013 and why they left out cost.
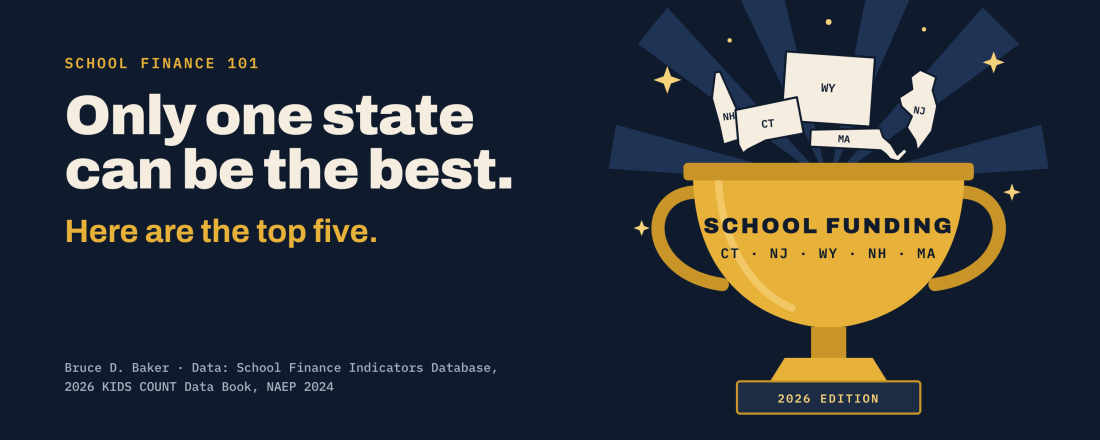
America’s best states for education are Massachusetts, New Jersey, New Hampshire, Wyoming and Connecticut. Not simply because they’re wealthy, but because they fund their schools adequately, and their students show it, on test scores and on broader measures of child well-being.
Being rich isn’t the same as being good, and good scores aren’t the same as good policy. The question here mirrors yesterday’s, flipped: which states fund their schools adequately and get strong results for kids? And it means treating effort, the share of its economy a state puts into its schools, a little differently. Yesterday, low effort was a stain because it left children in inadequately funded schools, by choice. A state that puts a smaller share of its economy into schools but still funds them well above adequate, and gets top results, isn’t making that choice. So here, low effort counts against a state only when it comes with inadequate funding.
One warning up front. None of these states provides equal educational opportunity, and only Wyoming comes close. Connecticut, New Jersey and Massachusetts have some of the largest gaps between rich and poor districts in the country. “Best” here means best available, not good enough.
How I picked them
I used the same sources as the bottom five, with the flags flipped, and added actual student outcomes and equal educational opportunity. A state earns a star for each of the first three measures below, plus or minus half a star for equal opportunity, and loses half a star for low effort that leaves its schools underfunded (finance data are for 2022-23):
High statewide adequacy. Top ten on how far the typical student’s district spends above its National Education Cost Model target, the cost of reaching national average math and reading scores given local poverty, wages and scale. (Why cost, not raw spending, is the right yardstick: Illustrations: Why “Cost” Matters and Efficiently Mediocre.)
Student outcomes. Top ten on 2024 NAEP, averaging standardized state scores across 4th and 8th grade math and reading (state scores).
Equal opportunity (half weight). Plus half a star for an opportunity gap smaller than the median state’s (−38 points) with high-poverty districts still funded at or above adequate, so states can’t earn it by underfunding everyone equally. Minus half a star for a gap in the worst quarter of states (−63 or worse, 11 states).
Low effort that leaves schools underfunded (half-star penalty). Fiscal effort, state and local K-12 revenue as a share of gross state product (SFID, 8th ed.), below the median state’s 3.22 percent, and a typical student in a below-adequate district. That’s the stain: a state that could do more choosing not to, with children paying for it. Fifteen states get this flag, including all of yesterday’s bottom five. Lower effort on its own costs nothing.
Ties are broken by NAEP.
State
Effort (% GSP, rank)
Effort change since 2006 (pts)
Typical student vs. adequate (rank)
Opportunity gap (pts)
KIDS COUNT 2026 rank
NAEP 2024 rank
Stars
Massachusetts
2.79% (#35)
−1.05
+54% (#6)
−104
2
1
2½
New Jersey
4.90% (#1)
−0.23
+69% (#3)
−109
6
2
2½
New Hampshire
3.26% (#23)
−0.74
+107% (#1)
−63
1
3
2½
Wyoming
3.48% (#14)
+0.04
+80% (#2)
−6
12
4
2½
Connecticut
3.91% (#3)
+0.12
+57% (#4)
−148
7
8
2½
All five land at two and a half stars. Four of them earn all three full stars and lose half a star for fairness; Wyoming misses the well-being star but earns the fairness bonus. NAEP breaks the tie: Massachusetts, New Jersey, New Hampshire, Wyoming, Connecticut. Next come Minnesota and Wisconsin at two stars each, earned on outcomes alone, then Utah and North Dakota at one and a half.
Notes: effort change, typical-student adequacy and high-poverty adequacy are my calculations from the SFID State Indicators Database (2026 release). The NAEP ranking is my calculation from published 2024 state averages for public schools. It orders states almost exactly as Business Insider’s ranking of the same tests does. Opportunity gap = adequacy of the 40 percent highest-poverty districts minus the 40 percent lowest-poverty districts, as published in the SFID report; closer to zero is more equal. Raw NAEP scores partly reflect student poverty, which is one reason funding and fairness count here too. SFID doesn’t estimate adequacy for Alaska, Hawaii or Vermont, so they can’t earn star 1 or the equal-opportunity adjustment.
The top five
1. Massachusetts
Massachusetts makes the list on results. It ranks 1st on NAEP, with the highest average in the country on all four 2024 tests (225 and 246 in 4th grade reading and math; 268 and 283 in 8th, where Wisconsin ties it in math). It ranks 2nd on KIDS COUNT, and its typical student is in a district spending about 54 percent above adequate (6th).
Its effort is 2.79 percent of GSP, 35th in the country and below the national average, and it’s one of only three states whose effort fell by a full percentage point or more since 2006 (with Indiana and West Virginia). On yesterday’s list, that would be a stain. Here it isn’t, because a large, high-income economy means even below-average effort buys a lot: its typical student is still funded well above adequate, and its kids lead the nation. Massachusetts built that lead on the 1993 Education Reform Act and extended it with the 2019 Student Opportunity Act. The risk is that, as a share of its economy, it keeps spending the lead down. Its opportunity gap (−104), the fourth-largest in the nation, costs it half a star. For how Massachusetts and New Jersey stack up against the voucher states, see Red State, Blue State, Round Two: Arizona & Florida vs. New Jersey & Massachusetts.
2. New Jersey
New Jersey has the highest fiscal effort in the nation, 4.90 percent of GSP. For scale: Arizona would have to raise its K-12 revenue by about 150 percent to match it. New Jersey’s typical student is in a district spending about 69 percent above adequate (3rd), the state ranks 6th on KIDS COUNT, and it ranks 2nd on NAEP behind only Massachusetts (222 and 240 in 4th grade; 266 and 282 in 8th).
This didn’t happen by accident. It is the product of decades of Abbott v. Burke litigation and a weighted, need-based formula in the School Funding Reform Act of 2008. Thanks to that, New Jersey’s high-poverty districts are funded nearly 50 percent above adequate, better than the typical district in all but a handful of states. But its opportunity gap (−109) is still among the largest in the country, driven mostly by how much its wealthiest districts spend, and that costs it half a star. On what New Jersey’s formula needs now, see Reforming New Jersey School Funding in 2026; on why the spending-and-scores graphs creeping into its funding debate mislead, Misinform, Not Inform. The Education Rights Project page has an animation of New Jersey districts against the Massachusetts standard, 2009–2024.
3. New Hampshire
New Hampshire’s numbers look almost too good. The typical student’s district spends about 107 percent above the NECM target, the highest in the nation. Just 0.1 percent of students attend a below-adequate district. New Hampshire ranks 1st on KIDS COUNT and 3rd on NAEP (221 and 242 in 4th grade; 264 and 280 in 8th). SFID’s state profile gives it an overall score of 90, third of 47 states rated.
But this is a low-cost, low-poverty state with a lot of local property wealth. Its effort (3.26 percent, 23rd) is only average and has dropped 0.74 points since 2006, costing schools about $2.81 billion (10.7 percent) over 2016–2023. And it has a real equal-opportunity problem. Its opportunity gap (−63) is the 11th-largest in the country, enough to cost it half a star, and SFID rates its equal opportunity “low.” The gap is driven mostly by how lavishly its wealthiest towns spend; its highest-poverty districts are still funded about 78 percent above adequate, better than the typical district in most states. New Hampshire is well funded largely because its towns are rich, not because the state makes it so, which is what the Claremont litigation has been about for three decades.
4. Wyoming
Wyoming is the surprise, and on fairness, the model. Its typical student is in a district spending about 80 percent above the NECM target, second only to New Hampshire. Its effort (3.48 percent, 14th) is above average, and it’s another of the five states that held to or exceeded its 2006 effort level every year from 2016 to 2023. Its students rank 4th on NAEP, and its 4th graders’ math average (243) is tied for second in the country.
What sets Wyoming apart is equal opportunity, the only state on this list to earn the bonus. Its opportunity gap is just −6 points, the smallest in the country: its highest-poverty districts are funded about as far above adequate (+83 percent) as its most affluent ones. That’s no accident. Since the Campbell County decisions of the 1990s, Wyoming has funded schools through a cost-based model built from what districts actually need. Wyoming ranks 12th on KIDS COUNT, just outside the top ten.
5. Connecticut
Connecticut earns all three full stars, and it gets there the hard way. It puts 3.91 percent of its economy into K-12, third in the nation, and it’s one of just five states that stayed above its own 2006 effort level in every year from 2016 to 2023 (SFID). Its typical student attends a district spending about 57 percent above the NECM adequacy target, fourth-best in the country. Connecticut ranks 7th on KIDS COUNT and 8th on NAEP, beating the national average on all four 2024 tests (219 and 239 in 4th grade reading and math; 263 and 277 in 8th grade).
Then it loses half a star. Connecticut has the second-largest opportunity gap in the country (−148 points), behind only New York. Its high-poverty districts are still funded above adequate, but its affluent suburbs are funded to achieve far more. Bridgeport and New Britain have shown up on my lists of America’s most financially disadvantaged districts for more than a decade, from the 2015 edition to the latest, for 2022–2024. Still a top-five state, with a very big asterisk.
A big asterisk. Connecticut makes this list on averages, and averages are where inequality goes to hide. On equal educational opportunity, Connecticut is a disaster, and its racial and economic segregation is a huge liability. It ranks 46th of 47 states on equal opportunity in our latest SFID report. By my measures it has the largest racial school funding gap in the nation. The fifth of students in its whitest districts attend schools funded at about 201 percent of adequate; the fifth in its most Black and Hispanic districts, about 73 percent. Its funding system has slid from one of the more progressive in the country in the early 2000s to the fourth most regressive. And 13 districts serving about 124,000 students, 12 of them majority Black and Hispanic, fall short of even national-average adequacy. The light weight this scorecard puts on fairness flatters Connecticut more than any other state on the list.
Connecticut’s high averages are the same defense the State of Kansas offered in Montoy v. State two decades ago. In closing argument, the state’s attorney told Shawnee County District Judge Terry Bullock that Kansas’s schools were “producing meaningful results for most children.” Bullock’s reply, in his December 19, 2003 order, fits Connecticut today:
“The Court will never forget Mr. Weltz’s statement in closing argument in this case when he said, in haec verba, ‘Our education system is strong and is producing meaningful results for most children.’ This case, of course, is about the rest of those children.”
Judge Terry Bullock, Memorandum Decision and Order, Montoy v. State, No. 99-C-1738, Shawnee County District Court, December 19, 2003
Connecticut is the same story. Most of its kids are doing fine, and its overall outcomes are among the best in the country. But a great many of its children, concentrated in Bridgeport, Hartford, Waterbury and other high-poverty, majority Black and Hispanic districts, are deeply deprived. For a state that otherwise does so well, that is a huge problem. Any honest ranking of Connecticut has to be about the rest of those children. (For where Kansas stands two decades after Montoy, see my Kansas & Missouri policy brief.)
The common thread is adequacy plus results. All five rank in the top six on typical-student adequacy and the top eight on NAEP, and all five beat the national average on every 2024 NAEP test. How they pay for it differs. New Jersey, Connecticut and Wyoming back it with sustained, above-average effort; Wyoming and Connecticut are two of only eight states putting at least as large a share of their economies into schools as they did in 2006. New Hampshire and Massachusetts get there on average or below-average effort, because their economies are big enough that it still buys adequate schools. Compare that to the bottom five: four of them are the four lowest-effort states in the country, and all five fund their typical student below adequate.
Four of the five also have something the bottom five lack: a school funding formula forced into shape by courts. Abbott in New Jersey, Campbell County in Wyoming, Claremont in New Hampshire, McDuffy behind the 1993 reform in Massachusetts. Litigation isn’t sufficient, as Connecticut’s CCJEF case shows, but in these states it set the floor.
The caveat that matters
Educational opportunity is unequal in every state, these five included. Only Wyoming earns the equal-opportunity bonus. Connecticut (−148), New Jersey (−109), Massachusetts (−104) and New Hampshire (−63) all have gaps well beyond the median state’s (−38). In each, the gap is driven at least as much by how lavishly affluent districts spend as by shortfalls in poor ones.
That isn’t a reason to level down. Wealthy communities investing in their kids is a good thing. But it does mean the job in these states is to raise the floor: drive targeted state aid to high-poverty districts until they’re funded as far above adequate as the suburbs next door. Wyoming shows it can be done. Its gap is −6.
North Dakota is the oddity. Its effort is modest: 2.59 percent of GSP, 41st, the same as Texas. But its economy is large relative to its student population, so modest effort still buys adequate funding (typical student about 33 percent above target, 9th), spread fairly evenly (an opportunity gap of −23, earning the half-star bonus). It ranks 12th on NAEP and 14th on KIDS COUNT, just outside on both. Same effort as Texas, very different result. That’s a reason for Texas to try harder, not praise for North Dakota’s effort.
Maine tries hard. It ranks 8th on effort (3.69 percent) and 5th on adequacy, with a typical student about 56 percent above target. But it ranks only 21st on KIDS COUNT, and its 2024 NAEP scores were the lowest in three decades. Its opportunity gap (−71) also costs it half a star. Money is necessary, not sufficient.
Illinois is the most-improved story. It ranks 4th on effort (3.86 percent), and its effort is up 0.43 points since 2006, the largest increase of any state. Much of that reflects the 2017 Evidence-Based Funding formula; The Red State Miracle That Wasn’t tracks what it bought against Texas and Florida. But it is still climbing out of a deep hole: adequacy ranks only 18th, and its opportunity gap (−80) is wide. Chicago and Waukegan are fixtures on my most-disadvantaged lists. Check back in a few years.
Pennsylvania ranks 2nd in the nation on effort (3.97 percent), but its money is badly distributed. Adequacy ranks 11th, the opportunity gap is −103, and in 2023 the Commonwealth Court ruled the system unconstitutional. Reading, Allentown and Philadelphia have long topped my lists of the most financially disadvantaged districts in the country. Philadelphia spent about 55 percent of what it would cost to reach national-average outcomes in 2024, about where it was in 2009; see A Philadelphia Story of Underfunding.
New York and Rhode Island put a lot in, ranking 7th and 6th on effort, and earn the adequacy star (7th and 10th). Then they lose half a star each for opportunity gaps of −151 and −96, the largest and sixth-largest in the nation. Neither ranks in the top 25 on NAEP or KIDS COUNT. On New York, see What’s up with New York State School Finance? and my policy brief on Foundation Aid and the small city districts. SFID urges caution with New York’s adequacy estimates, which rely on imputed test data.
Notable misses
Minnesota and Wisconsin earn two stars each, both on outcomes: top-ten NAEP (9th and 10th) and top-ten KIDS COUNT (5th and 8th). Neither earns the adequacy star. Minnesota ranks 30th on effort; Wisconsin is about average (21st), with a typical student only about 8 percent above adequate. Minnesota’s averages also hide wide gaps; see Minnesota’s Equal Educational Opportunity Problem and the Minnesota funding and outcome gaps animation, national vs. Massachusetts standards on the Education Rights Project page. Utah has the same two outcome stars (5th on NAEP, 3rd on KIDS COUNT) but loses half a star. It ranks 39th on effort (2.60 percent), and its typical student is in a district spending about 6 percent below adequate. That’s exactly the stain this scorecard penalizes: low effort that leaves schools underfunded. These are states where kids do well in spite of their funding systems, helped in part by comparatively low child poverty.
Vermont ranks 4th on KIDS COUNT but can’t be scored. SFID doesn’t publish Vermont effort or adequacy estimates because of irregularities in its data since 2017.
What the bottom five could learn
Put the two lists side by side and the lesson is plain. All five of the top states fund their typical student well above what it costs to reach national-average outcomes, and all five beat those outcomes comfortably. New Jersey, Connecticut and Wyoming get there with large, sustained commitments of their own economies, and Wyoming shows that adequate and equal can go together. New Hampshire and Massachusetts get there with average or below-average effort, and that’s fine as long as the money is enough, though both have let effort slide since 2006, and that cushion isn’t permanent. The bottom five can’t say any of this. Their low effort leaves their schools underfunded, by choice, and their kids pay for it.
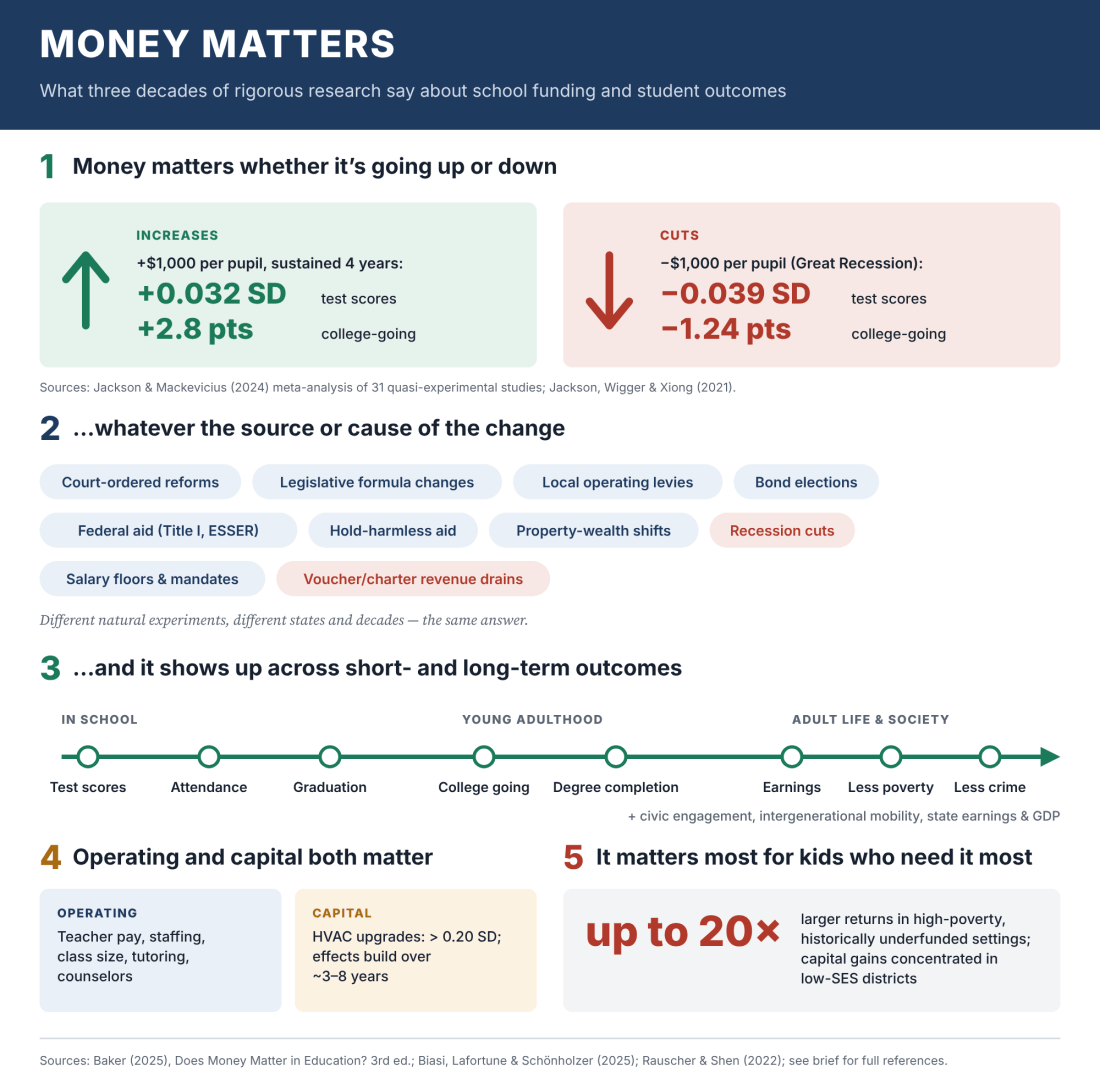
The gap between the lists is a choice, not a law of nature. If Arizona put New Jersey’s share of its economy into its schools, its K-12 revenue would rise by about 150 percent. If North Carolina matched even Wyoming’s effort, it would add roughly 70 percent. Nobody is asking Nevada to become Connecticut overnight. But the states at the top of this list show what sustained commitment buys. And yes, money matters, and the evidence keeps piling up, all the way through to state economic growth (Human Capital Pays, If You Count the Cost).
They also show its limits. Even the best states leave their poorest children with less than their richest. Being the best, in American school finance, still isn’t the same as being fair.
SFID State Indicators Database, 2026 release: my calculations of effort change since 2006, typical-student adequacy and high-poverty adequacy (NECM funding gap as a share of estimated cost).
Notes: adequacy is not estimated for Alaska, Hawaii or Vermont. Interpret New York’s adequacy estimates with caution. All rankings are relative across states, using SFID’s modest benchmark of national-average test scores.
Often when I speak to large national groups in the US, those in the room wish to proclaim their state as the worst on education funding. But only one state can really hold that position. Here, I take a look at the bottom five.
Can’t versus won’t
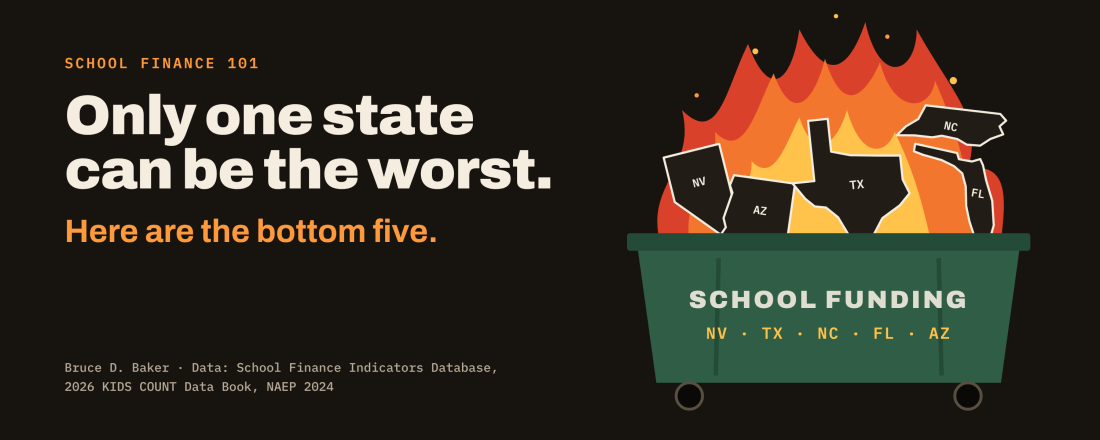
America’s worst states for education are Nevada, Texas, North Carolina, Florida and Arizona. Not because their kids are the poorest or their test scores the lowest, but because they could do far better by their children and choose not to.
Every summer brings another round of “best and worst states for schools” listicles. Most mash together spending, class size, test scores, safety and whatever else is lying around, then hand out a rank. They tend to reward states for being rich and punish them for being poor. That tells us who has the money. It doesn’t tell us who is failing to use it.
So here’s a different question. Which states pair weak outcomes for kids with a deliberate refusal to put their own economic capacity toward fixing them? Those states aren’t unlucky. They’re making a choice.
How I picked them
I counted red flags on four measures, then used NAEP as a check on outcomes. A state earns a flag for each of the following:
Low fiscal effort. Bottom ten on state and local K-12 revenue as a share of gross state product, 2022-23 (SFID, 8th ed.). The U.S. average is 3.13 percent.
Chronic underfunding. At least half of students in “chronically underfunded” districts, the 20 percent of districts nationally furthest below their National Education Cost Model (NECM) adequacy targets. Ten states meet that bar.
Deliberate choice. Named in the SFID report as low-adequacy and low-effort, meaning inadequate funding is at least partly a policy choice, not a capacity problem.
Child well-being. Bottom ten in the 2026 KIDS COUNT Data Book, which scores 16 indicators across economics, education, health and family/community.
The NECM benchmark is modest: what each district would need to spend to reach national average math and reading scores in grades 3–8, given its poverty, labor costs and size.
State
Effort (% GSP, rank)
≥50% chronically underfunded
SFID “deliberate choice”
KIDS COUNT 2026 rank
NAEP Core 2024 rank
Flags
Nevada
2.10% (#47)
Yes
Yes
46
not available
4
Texas
2.59% (#40)
Yes
Yes
44 (tie)
36
4
North Carolina
2.05% (#49)
Yes
Yes
32
not available
3
Florida
2.19% (#46)
Yes
Yes
35
27
3
Arizona
2.10% (#48)
No
Yes
40
not available
2
Arizona ties several states at two flags. It takes the fifth slot because its retreat from its own pre-recession effort is the largest SFID highlights (−35 percent), which I’ll get to below. NAEP Core ranks (4th and 8th grade math and reading pooled) come from the University of Oklahoma’s Fall to 48th report; I only have them for the states it lists.
The bottom five
1. Nevada
Nevada hits every flag I can measure. It puts 2.10 percent of its economy into K-12, 47th in the country. At least half its students attend chronically underfunded districts, and SFID names it among the states where that’s a choice. Kids pay for it outside school too: Nevada ranks 46th on KIDS COUNT, ahead of only Alaska, Louisiana, New Mexico and Mississippi. On NAEP, Nevada had the seventh-lowest 8th grade math proficiency rate in 2024, with about one in five 8th graders proficient.
This is a state with a casino-and-tourism economy and no personal income tax. It has capacity. It just doesn’t point it at kids.
2. Texas
Texas also hits all four flags, and it does so at a scale no other state on this list approaches. Effort is 2.59 percent of GSP (40th) (SFID). At least half of Texas students are in chronically underfunded districts. Texas ties Oklahoma at 44th on KIDS COUNT. Its NAEP Core rank of 36th is middling, which tells you something: Texas kids are outperforming what Texas is willing to pay for.
And because Texas enrolls so many children, its choices shape the schooling of a very large share of the nation’s underfunded students.
3. North Carolina
North Carolina has the lowest fiscal effort in the nation, 2.05 percent of GSP. It has a large, growing economy and chooses to devote less of it to public schools than any other state. Unsurprisingly, at least half of its students sit in chronically underfunded districts, and SFID lists it among the deliberate-choice states.
North Carolina’s KIDS COUNT rank (32nd) is better than the others on this list. That’s the point: this is a state with the economic and social base to do far better. Instead, it has spent roughly three decades litigating the Leandro case over whether the state is meeting its own constitutional duty to provide a sound basic education.
4. Florida
Florida devotes 2.19 percent of GSP to schools (46th). Had it held to its own 2006 effort level, its schools would have had about 29 percent more state and local revenue from 2016 to 2023, among the steepest losses in the SFID report. At least half of Florida students are in chronically underfunded districts.
Here’s the twist. Florida posts one of the smallest opportunity gaps between high- and low-poverty districts in the nation (−8 points). That isn’t equity. It’s what happens when nearly everyone is underfunded: there isn’t enough money in the system to generate much inequality. Florida ranks 35th on KIDS COUNT and 27th on NAEP Core.
Note: SFID’s opportunity gap compares adequacy in the 40 percent highest- and lowest-poverty districts in each state, in percentage points.
5. Arizona
Arizona puts 2.10 percent of its economy into K-12 (48th). Few states have walked away from their schools faster: had Arizona kept its 2006 effort level, its schools would have had about 35 percent more state and local revenue from 2016 to 2023, the largest proportional loss the SFID report highlights. To reach New Jersey’s effort level, Arizona would have to raise K-12 revenue by about 150 percent.
Arizona is on SFID’s deliberate-choice list and ranks 40th on KIDS COUNT. On NAEP, its 4th graders scored below the national average in both math and reading in 2024; only about a quarter were proficient in reading, and nearly half scored below Basic.
What they have in common
All five are low-effort states with the economic capacity to do more. Four of the five are the four lowest-effort states in the country (NC, AZ, NV, FL), and all five appear on SFID’s list of states where inadequate funding reflects, at least in part, a policy choice. That’s the common denominator: not poverty, not geography, but priorities.
The cost lands unevenly. Nationally, 75 percent of Black students attend districts funded below NECM adequacy levels, versus 37 percent of white students; for chronically underfunded districts it’s 57 percent versus 18 percent. Hispanic students are almost 70 percent more likely than white students to be in an underfunded district. States like Texas, Florida and Nevada, with large Black and Hispanic enrollments and chronically underfunded systems, are where those national gaps are made.
None of this is a pandemic story. U.S. average effort fell from 3.59 percent of GSP in 2006 to 3.13 percent in 2023, and 42 states now put a smaller share of their economies into schools than before the Great Recession. Had states simply held their 2006 effort levels, schools would have had about $575 billion more from 2016 to 2023. The five states here just went further down that road than almost anyone.
Note: the post-2020 dip in effort partly reflects unusually fast GSP growth, not only budget cuts; Matt Barnum at Chalkbeat also raised whether federal COVID aid let states ease off.
The children’s rights picture rhymes. Human Rights Watch’s state scorecard finds no state above a C on child marriage, corporal punishment, child labor and juvenile justice; 16 states get an F. Corporal punishment remains legal in both public and private schools in 22 states. A country that won’t ratify the Convention on the Rights of the Child leaves those guarantees to the states, and the states on this list have chosen to guarantee children rather little, starting with their schools.
Dishonorable mentions
Oklahoma would make any outcomes-only list. It ranks 48th on NAEP Core, ahead of only West Virginia, Alaska and New Mexico, and 48th on the KIDS COUNT education domain. Its effort (2.85 percent, 34th) is below average but not bottom-tier, so it misses my cut. It shouldn’t take comfort in that.
Alabama has at least half its students in chronically underfunded districts and a wide gap between its high- and low-poverty districts: high-poverty districts sit about 48 percent below adequate, low-poverty districts about 7 percent below, a 41-point opportunity gap. It ranks 42nd on KIDS COUNT and 44th on NAEP Core.
Tennessee is a low-effort, deliberate-choice state (2.31 percent, 45th) whose NAEP Core rank of 17th shows what reform without money can buy, and its limits.
New Mexico and Mississippi are the hard cases. They hold the bottom two spots on KIDS COUNT, and New Mexico is last on every NAEP test (Mississippi, thanks to its literacy push, now sits 28th on NAEP Core). Mississippi has 99 percent of students in below-adequate districts and 80 percent in chronically underfunded ones. But both try: New Mexico ranks 12th on effort (3.54 percent) and Mississippi 20th (3.30 percent). These are can’t states, not won’t states. Small economies and high child poverty mean even strong effort can’t close the gap alone. That’s an argument for federal foundation aid targeted at high-effort, low-capacity states, not for putting them on a shame list.
Note: Alaska and West Virginia also sit near the bottom on NAEP and KIDS COUNT. SFID doesn’t estimate adequacy for Alaska, whose geography drives costs the national model can’t capture.
These are choices
The usual response to lists like this is that some states are just poorer, more rural, or harder to serve. For New Mexico and Mississippi, that’s partly true. For Nevada, Texas, North Carolina, Florida and Arizona, it isn’t. These states have the capacity. They’ve chosen tax cuts, revenue limits and, increasingly, private school subsidies over adequately funding the public schools most of their children attend.
We know what works. Money matters, and it matters most for the kids these states shortchange. The fix starts with three things:
Raise effort. Getting even to the national average of 3.13 percent of GSP would mean billions in new revenue in each of these states.
Target it. Drive state aid to high-poverty districts based on rigorously estimated costs, and strip out flat grants and minimum-aid guarantees that send money where it isn’t needed.
Tie federal aid to effort. Supplemental federal foundation aid should flow to high-need districts in states that pay their fair share, which would reward New Mexico and Mississippi and give the bottom five a reason to try.
Until then, children in these five states will keep paying for their legislators’ priorities.
In February 2019, Derek Black, Preston Green and I wrote a short piece for The Conversation arguing that charter schooling has a lucrative loophole that would be easy to close. Our one-sentence version of the problem was this: some “nonprofit” charter schools take public money and pay their owners with it.
Seven years later, that sentence describes the household finances of the Republican nominee for governor of Florida.
On October 22, the Tampa Bay Times and Miami Herald reported that five state-funded charter schools have paid more than $30 million over four years to two private companies run by Erika Donalds, and that one of them, OptimaEd, is slated to collect another $15.7 million this year from a single virtual charter school. Byron Donalds’ own federal disclosures show that the largest share of the couple’s wealth comes from those companies. The election is nine days away.
None of this is new to me. I’ve been writing about these arrangements, on this blog and in peer-reviewed and law review work, for more than a decade, and I’ve been quoted in this story from the start, beginning with CBS’s investigation last December. Here I want to do what a quote can’t: put the Donalds’ arrangements in the frame I’ve built over that decade, with Gary Miron on the business models, with Preston Green on the law of related-party transactions, and alongside the company store, real estate and edu-grift cases I’ve been cataloging here.
The frame: having it both ways, and the gatekeepers who aren’t there
Preston Green, Joseph Oluwole and I started from a simple legal observation in “Having It Both Ways” (Emory Law Journal, 2014). Charter schools claim the funding of public schools and the autonomy of private ones. They are public when the money flows in and private when anyone asks where it went.
A year later, Gary Miron and I laid out the business models themselves in The Business of Charter Schooling: Understanding the Policies that Charter Operators Use for Financial Benefit (National Education Policy Center, 2015). We showed how operators, working largely within existing law, convert public revenue into private gain: management fees paid to affiliated companies, less-than-arm’s-length leases, and third-party entities that use taxpayer dollars to acquire land and buildings the public never ends up owning. We also warned that disclosure rules were weak enough that legal violations, ethical problems or simply bad practices would rarely come to light except through investigative reporting, whistleblowers or litigation. Eleven years later, that is a fair description of how the public learned about Optima: from CBS, the Florida Bulldog, the Herald and a lawsuit.
In “Are Charter Schools the Second Coming of Enron?” (Indiana Law Journal, 2018), Preston, Joseph and I followed that logic to its financial and legal conclusion. Enron’s collapse turned on related-party transactions: special-purpose entities controlled by insiders, sitting on the other side of the company’s own deals. We showed that charter operators were building the same structure, with a nonprofit school on one side and affiliated management, real estate and service companies on the other. Our main point was about gatekeepers. Auditors, governing boards, authorizers and state agencies are supposed to catch these arrangements, and the law gives most of them neither the mandate nor the tools.
The 2019 Conversation piece with Derek Black turned that into three fixes. Prohibit charter owners and operators from leasing or buying property from their own other companies. Require state officials to audit facility purchases and leases. Give charter employees whistleblower protection and a reward for reporting abuse.
On this blog, I’ve since organized the mechanisms into what I call the grift model, four repeating types:
Enrollment inflation: getting paid for students who aren’t really being educated.
Related-party transactions: the school’s own leadership on both sides of a contract.
The company store: a captive vendor the school must buy from, owned by the people running the school.
Real estate: arranging for a related party to own the buildings public dollars paid for, then leasing them back.
The central finding of that work, laid out in Edu-Grift Top 5 last month, is that the mechanisms moving the most money are the ones nobody has to break the law to run. That is the right lens for the Donalds. Nothing I describe below has been found illegal, and I’m not suggesting otherwise. The problem is the structure Florida permits, and who would be in charge of it.
What the reporting has shown, in order
The record has been built by three sets of reporters over sixteen months. Taken together, it describes a network that started as a nonprofit and migrated its money toward for-profit companies owned by its founder.
Byron Donalds said his wife has no charter business involvement today; his campaign then clarified that OptimaEd still contracts with Optima Classical Academy.
Five state-funded charters paid more than $30 million over four years to Optima Management Services and OptimaEd; OptimaEd is budgeted to receive $15.7 million from Optima Classical Academy this year. Most of the couple’s wealth comes from her companies.
Treasure Coast Classical Academy’s lawsuit alleges an undisclosed conflict of interest with Summit Construction, which built or renovated much of the network.
From 2020 to 2023, four Optima-launched schools spent about 30% of their government funding, roughly $35 million, on outside firms tied to Erika Donalds. All four have since cut ties with Optima; a fifth school in Fort Myers never opened.
After Bulldog’s first story, Rep. Donalds amended his 2023 disclosure to report her stakes in the companies. Treasure Coast alleged Optima reassigned its staff to OptimaEd after the board rejected that plan.
The foundation and its schools paid more than $10 million to her two for-profit firms. The two Jacksonville schools cited “deficiencies” in Optima’s accounting when they ended their contracts in 2023.
The sequence is worth tracing. Erika Donalds founded the nonprofit Optima Foundation in 2017 and used it to open classical charter schools in Stuart, Jacksonville and Naples. She then formed OptimaEd (2020) and Optima Management Services (2022), both for-profit. When three flagship schools left the foundation in 2023, Naples Classical signed instead with her for-profit firms, and its payments rose by more than a quarter, according to the Bulldog. The foundation has since been renamed the Education Freedom Foundation.
What I’ve said along the way
When CBS News asked me about Optima last December, I made two points. The first was about results. As I told CBS:
“Florida’s charter sector is not strong, and Optima schools, at least the four schools that seem to be in that affiliated mix, perform even less well.”
The second was about structure. Nonprofit schools paying for-profit companies with overlapping stakeholders is not unique to Optima; it runs across the charter industry. And charter finances are far more opaque than district finances, which is exactly why it took reporters, auditors and a lawsuit to piece this together.
When the Herald came back to me this month, the question had changed. It was no longer only about how a charter network is run. It was about who would regulate the sector. I said:
“Having people connected to or in positions of power to regulate these things who are benefiting from them not being regulated, in my view, is problematic.”
And on the novelty of it:
“I don’t know if any governor in particular has the same kind of personal wealth accumulated in that one space over which they then would have regulatory authority.”
I also told the Herald something I want to repeat here, because it matters for fairness: the Donalds are far from the biggest profiteers from the flow of public education dollars to private companies. The dollar figures in their story are modest next to the cases below. What’s different is the job.
The company store, Florida edition
In The Charter School Company Store (2016) and its sequel last month, I described operators who require the people and schools they control to buy from a store the operator owns. Relay’s required credential for Uncommon’s teachers in Newark. Academica’s two invoices in Miami, management fee and rent, both ending in one family’s accounts. CSMI in Chester, where it took a public-records fight to see the books.
Optima fits the pattern at three registers:
Back office. The schools paid Optima Management Services for management and administration, and paid Educator Solutions, a payroll firm owned by a pro-charter state legislator, nearly $7 million from 2020 to 2022, while Erika Donalds drew more than $500,000 in salary from that firm (Florida Bulldog).
Curriculum and instruction. OptimaEd, 81% owned by Erika Donalds per her husband’s disclosures, supplies Optima Classical Academy’s entire program: teachers, curriculum, technology and VR headsets. That school’s payments to OptimaEd went from about $1.1 million in 2023 to $2.1 million in 2024 to a budgeted $15.7 million this year.
The relabeling. Treasure Coast’s lawsuit alleges that when its board rejected a proposal to hand Optima’s duties to OptimaEd, Optima reassigned its staff to OptimaEd anyway. That is the company store in its purest form: the vendor decides it is the vendor.
The virtual school is the clearest case, and the most important going forward. The campaign told CBS Miami that state funding goes to the charter school, and OptimaEd is simply paid under its contract with the school. That is true, and it is the whole point. Optima Classical Academy exists as a public charter so that it can receive state and local funds; OptimaEd exists as a private company so that it can keep them. The charter is public when the money comes in and private when it goes out. Preston and I called that having it both ways.
The real estate and construction layer
The grift model’s fourth type, real estate, is where the biggest money in this sector moves. In The Charter Money Trail I traced the usual three hops: management fee, then a related real-estate entity, then tax-exempt bonds repaid out of the school’s own per-pupil funding. And in We Bought It Twice I explained how the public ends up paying for a building it never owns.
In the Optima network, what the record shows so far is construction, not ownership. According to the Florida Bulldog, one Jacksonville firm, Summit Construction Management Group, built the $14.4 million Jacksonville Classical Academy campus (2019), renovated Jacksonville Classical East for $1 million (2022), built the $20 million Naples Classical campus (2020), signed an $11 million deal with Treasure Coast (2023), and was slated to build the Fort Myers school. Treasure Coast’s lawsuit alleges the foundation had an undisclosed conflict of interest with Summit, and that Summit set up investment vehicles that put money into Erika Donalds’ other ventures. Those are allegations in a civil complaint, and neither Summit nor Donalds responded to the Bulldog’s questions.
The Fort Myers campus is the other open question. CBS reported that Donalds sought, in August 2025, to transfer the building to another charter operator after the school failed to open; local reporting says that operator plans to open it. I don’t know the terms of that transfer, and neither, as far as I can tell, does the public. That is the gap: who financed the building, who holds title, and what the public paid for are exactly the questions the related-party framework says to ask, and exactly the ones Florida’s disclosure rules make hard to answer.
Our 2019 recommendation applies directly. A charter’s founders and operators should not be able to lease or buy property from, or route construction through, entities tied to themselves without independent review, and the state should audit those deals as a matter of course.
Where this sits among the big edu-grift stories
In scale, Optima is a mid-sized case. Here it is next to the five largest I ranked in Edu-Grift Top 5, plus Oklahoma’s Epic case. These are different kinds of numbers over different periods, so read them as orders of magnitude, not a league table.
Case
Mechanism
Headline figure
Legal status
National Heritage Academies (MI + 6 states)
Real estate
$853.6M in bonds (2021)
Legal; no charges
A3 Education (CA)
Enrollment inflation
~$400M generated, ~$80M allegedly diverted
Guilty pleas
Epic Charter Schools (OK)
Related-party management
State auditor: $145M in spending undisclosed
Founders charged in 2022; deny wrongdoing; headed to trial
Chester Community / CSMI (PA)
Company store + real estate
~$122M combined
Audited; no charges
ECOT (OH)
Enrollment inflation
$117M ordered repaid
School closed 2018
White Hat (OH)
Company store + equipment
~$100M over a decade
Upheld, 4–3, Ohio Supreme Court
Optima network (FL)
Company store + related-party services
>$30M over four years, $15.7M budgeted this year
No charges; one civil suit
Two lessons from that table matter for Florida.
First, the cases that ended in court were the ones built on fake enrollment. The ones built on structure, the company store and real estate, mostly survived review. White Hat won in Ohio’s Supreme Court. NHA’s $853.6 million deal closed. The Optima arrangements look like the second kind, which is why “nothing illegal” is not a defense. It’s the diagnosis.
Second, several of these stories are also political stories. ECOT’s founder gave heavily to the officials who oversaw his school. Academica’s founder had a brother-in-law on the Florida House committee that funded charter facilities. In Arizona, lawmakers who wrote charter law profited from charter real estate, which Derek, Preston and I noted in 2019. The Donalds case moves that pattern to the top: not a donor, not a legislator, but a governor’s household.
Their side of it
The Donalds and their supporters have made several arguments, and they deserve a fair hearing.
Independent boards. Each school is owned and governed by its own nonprofit board, which makes its own decisions (a source close to Donalds, to CBS).
Temporary by design. Erika Donalds told the Herald the schools’ partnerships with her foundation were always meant to be temporary, and she disputed the claim that the foundation mismanaged the Jacksonville audits. The campaign says the brick-and-mortar schools have moved to self-management and those contracts have ended.
Separation. Byron Donalds has no management role in and no direct ownership of her companies, the campaign says, and he has said he would draw a line between her business and the state’s if elected. The renamed foundation, it says, now provides its help to schools free of charge.
Parents choose. Families decide whether to enroll; funding follows them, and losing students means losing money. That, the campaign argues, is a layer of accountability beyond government oversight.
Results. Her spokesperson told CBS the schools’ academic performance eventually improved. Erika Donalds has said she has “nothing to hide.”
Bias. Defenders called the CBS coverage sexist, and argued that a school delayed by hurricane damage and financing problems says little about her record.
Some of this is fair. Independent boards did, in the end, act: all four original schools have cut ties with Optima, and one sued. That is the gatekeeping system working, late. But each of these points answers a question other than the one I’m asking. The question is not whether parents can leave, or whether any single contract was lawful. It is whether a governor can neutrally oversee a funding system that supports his household, and whether Florida’s rules would let anyone see it if he couldn’t. On the parental-choice argument in particular, I’d point readers to Experimenting With Our Children: parents can leave a school, but the child who lost the years doesn’t get them back.
Why it matters for a governor, and what should change
In the Enron article, Preston, Joseph and I argued that related-party abuse is a gatekeeper failure. The governor is the gatekeeper of last resort. A governor signs the budget that sets per-pupil funding, appoints the state board and education commissioner, and decides whether to sign or veto charter, facility and oversight legislation. Erika Donalds has promised an “economy of education” in which “profit is not going to be a bad word,” the Herald reported. The Herald also reported that Florida’s ethics code applies to the governor but not to his spouse, though it could require him to recuse from some charter-related actions. Recusal from the core of a state’s education budget is not a workable answer.
Nor is it a problem only the Donalds can create. Florida already puts the smallest share of its economy into its public schools of any state, and its rules let the Optima arrangements surface only through reporters and a lawsuit. Whoever wins on November 3, the state should close the loophole. Updated for Florida, our 2019 agenda would be:
Ban related-party facility and service contracts between a charter school and companies owned or controlled by its founders, operators or their families, or require independent, at-market review before any such contract is signed, not a footnote in an audit afterward.
Audit facility purchases, leases, construction and conveyances as a matter of routine, including any transfer of a school building to another operator.
Protect and reward whistleblowers inside charter schools and their vendors.
Treat management and instructional vendors as public for records purposes when they perform a school’s core functions, as Pennsylvania’s Office of Open Records did with CSMI.
Extend the ethics code to cover financial interests of the governor’s household in entities receiving state education funds, with divestment, not recusal, as the remedy.
None of this is about being for or against charter schools. As we wrote in 2019, charter schools run on public money. The public should be able to see where it goes, and no one in a position to set the rules should be on both sides of the deal.
Sources
My prior work
Green, P. C., Baker, B. D., & Oluwole, J. (2014). Having it both ways: How charter schools try to obtain funding of public schools and the autonomy of private schools. Emory Law Journal, 63(2). Discussed here.
Then I started watching Mike Flanagan’s Carrie on Prime Video, and I couldn’t get the article out of my head. What struck me most was how Carrie’s teachers, and especially her school counselor, reached out to her and cared for her, all while working inside the very constraints the article describes.
I did not expect a Stephen King adaptation to be the clearest illustration of that argument I’ve seen. It is.
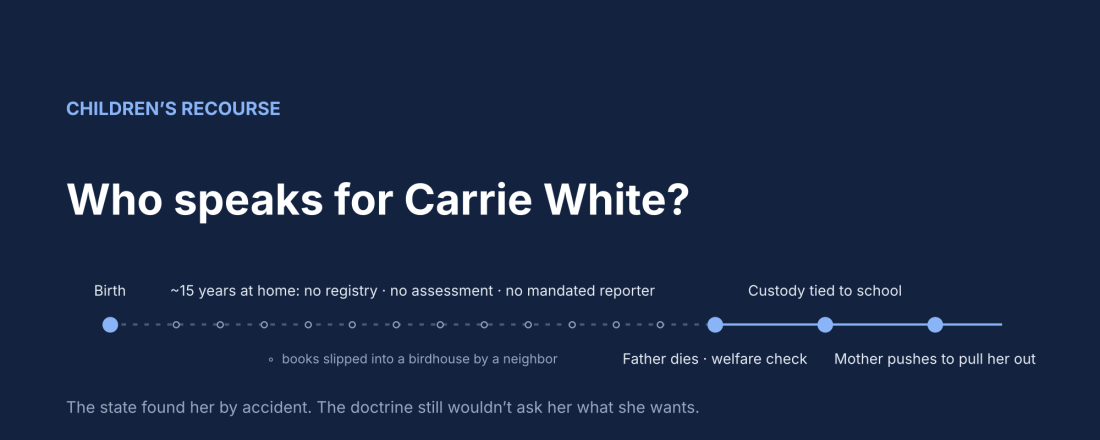
Flanagan’s Carrie White is not just a bullied teenager with a fanatical mother. She is a child who was, for roughly fifteen years, legally invisible. And the only reason she ever sees the inside of a school is a plot device that our law does not reliably supply: a death in the family that triggers a welfare check.
Fifteen years in the house: exit with no one watching
The series opens after Carrie’s father Ralph dies in a construction accident. Social workers conducting a welfare check find Margaret and her teenage daughter, a girl who has essentially never left the family home. As a condition of Margaret keeping custody, Carrie must attend the local high school. Margaret, for her part, promises Carrie it will only be for a semester, two at most.
Up to that point, Carrie had been “homeschooled,” in the loosest possible sense. She was allowed to read little beyond the Bible. What she knows of the wider world of books she owes almost entirely to a neighbor, Stella, who as a girl began slipping books into the birdhouse Carrie was permitted to tend, the one point of contact she had with the outside.
Sit with that for a moment, because it is a precise picture of the regime described in Part I.D of the article. The Supreme Court has never decided a home schooling case. Home schooling’s legality rests on state statutes read against Pierce v. Society of Sisters, and those statutes range from notice and portfolio review to almost nothing at all. Carrie’s entire educational recourse, for a decade and a half, was the private generosity of a kid next door with a library card. No registry knew she existed. No assessment measured what she had learned. No teacher, nurse, or counselor (no mandated reporter) ever laid eyes on her.
Pierce itself did not contemplate this. The Court was explicit that nothing in its holding questioned “the power of the State reasonably to regulate all schools, to inspect, supervise and examine them, their teachers and pupils.” Pierce was a bargain: parents could leave the public schools, and the State kept the power to make sure the child was educated anyway. In Carrie’s case, the first half of the bargain was honored for fifteen years. The second half never showed up.
The welfare check: the state as guarantor, by accident
The show’s premise, that the state conditions Margaret’s custody on Carrie’s school attendance, is the closest thing in the story to the framework I call Children’s Recourse. It is the state acting as guarantor of a real education for a child whose parent has failed her.
There is doctrinal room for it. Prince v. Massachusetts remains the clearest statement that parental and religious authority yields to the state’s interest in the child’s welfare: parents “may be free to become martyrs themselves,” but they are not free “to make martyrs of their children.” Even Mirabelli v. Bonta, which this spring expanded parents’ rights to be informed about what happens at school, preserved a carve-out: the State may still “shield children from unfit parents by enforcing child-abuse laws and removing children from parental custody in appropriate cases.” A prayer closet used as a punishment cell is squarely what child-abuse laws are for.
But notice how the state got there. Not through any system designed to find a child like Carrie. It got there because her father died and someone came to the door. Under DeShaney, the state generally owes a child no duty to protect her from harm inflicted by a private actor, including a parent. Absent the accident, Carrie stays in the house, and nothing in federal constitutional law obliges anyone to come looking.
Inside the school: what Mahmoud and Mirabelli would hand Margaret
Figure 2. Opt-out claims, Gobitis (1940) through Mirabelli (2026).
Once Carrie is in school, the show becomes a story about a child discovering what she has been denied, and a mother trying to claw it back.
In episode two, the guidance counselor, Peter Morton, is among the first adults to treat Carrie kindly. He answers her questions and walks her into the school library, a place she has never been. The titles she pulls off the shelf, as Forbes noted, are drawn from authors whose books are among the most frequently challenged in American schools. Carrie wants to read. She wants to understand her own body, which no one has explained to her, and she gets materials and answers from the adults at school that her mother would never have provided. Margaret, true to form, wants her out of all of it.
Twenty years ago, Margaret’s objections would have gone nowhere. The baseline the lower courts drew from Barnette (Mozert in 1987, Parker v. Hurley in 2008) was that being exposed to material in school is not a constitutional injury. Parents who objected could leave. They could not veto.
That baseline is gone. Under Mahmoud v. Taylor, a parent’s free exercise rights are violated by school policies that “substantially interfere with the religious development” of the child, and a burden of the same character as Yoder triggers strict scrutiny even under a neutral, generally applicable policy. Margaret White is close to a law school hypothetical for that test: sincere, all-encompassing religious objection to the library’s novels, to sex education, to the very idea that Carrie’s body is something she is entitled to understand. Mirabelli adds a second weapon. The Court found parents likely to succeed in claiming a right to participate in “decisions regarding their children’s mental health,” which is to say, in what passes between Carrie and Mr. Morton.
Figure 3. What each party can claim once Carrie is inside the school.
What neither opinion contains is any account of Carrie’s side. As Part II.D of the article puts it, a child’s interest in learning about the world as it is, in confidential access to a school counselor, and in developing views of her own appear in these opinions only as interests the parental right overrides. They are never treated as rights the child holds.
Justice Douglas saw this coming in Yoder. The children’s own views had not been canvassed, he wrote, and “the children should be entitled to be heard.” Carrie is sixteen or seventeen. She has views. She is literally reading her way out of the house. Under current doctrine, no court would ask her.
Compare England. Its statutory guidance on sex education lets a pupil, from three terms before age sixteen, opt into sex education even over a parent’s withdrawal. Carrie, in England, would have her own say. In the U.S., after Mahmoud, the opt-out runs one way.
Follow the money: the Carrie the state would never have found
Figure 4. The funding cases, Norwood (1973) through St. Mary (pending).
Now change one fact. Suppose Margaret White lived in Arizona, and suppose that instead of keeping Carrie home on her own dime, she had signed up for an Empowerment Scholarship Account. I took up exactly this scenario in Experimenting With Our Children, which asks who answers to the eighteen-year-old the voucher failed.
Under Arizona’s statute, a parent’s signature on the account agreement “constitutes school attendance” for purposes of compulsory attendance law. The account requires spending on reading, math, and the other basic subjects, but imposes no testing, no curricular approval, and measures no learning. Florida’s home-education account requires a test to be taken and reported; funding turns on submitting it, not on the score.
In that world, the welfare check does not end with a custody condition. Margaret has a signed account agreement that counts as attendance and a stream of public money to prove it. Carrie’s “education” is a ledger of receipts. And after Carson v. Makin, a state that funds private options cannot exclude a family because the instruction it funds is religious. (The series, like King’s novel, is set in Chamberlain, Maine. Carson is a Maine case.) If the Court rules in St. Mary Catholic Parish v. Roy, argued November 3, that neutral conditions cannot bind religious providers, even the conditions a state might want to attach will be in doubt. Preston Green and I sketched where this sequence leads back in 2020, in The Post-Espinoza End Game.
The point is not that religious families shouldn’t get public support. The Netherlands funds private religious schools on the same footing as public ones. The point is that every peer democracy that does so exchanges that support for public accountability, and that money flowing in a child’s name ought to carry some obligation running to the child. Under the doctrine as it stands, it carries none.
What Carrie is owed: the state constitutional right that follows the child
The guidance office is where Carrie’s world opens up. Mr. Morton’s trip to the library is the first time an adult at any institution asks her what she wants to read. It’s a small scene, but it points straight at the question school finance people spend their careers on: not what a parent prefers, but what the state has actually promised each child.
Kentucky’s high court in Rose defined an adequate education in terms of capacities every child must have the opportunity to develop, including enough knowledge of economic, social, and political systems to make informed choices. New York’s Court of Appeals has said a sound basic education must prepare students to compete for jobs that support them and to function as civic participants. Several state high courts, including Kentucky, Wyoming, New Hampshire, and Washington, have called the right fundamental, and have described it as one held by each child.
A right like that does not stay behind when a child leaves the public system. It follows her. On that reading, the relevant question about Carrie is not whether her absence harmed the local public school’s budget. It is whether the state secured for her, at any point in fifteen years, the capacities its constitution guarantees. The honest answer is no, and the only thing that changed it was a funeral.
Children’s Recourse, applied to Carrie White
Part VII of the article lists measures a state can adopt now, on the authority Pierce itself reserved, without overruling anything. Here is how each would have changed Carrie’s story.
Figure 5. Same child, same mother, three rule sets.
Children’s Recourse measure
What it would have meant for Carrie
Register every school-age child, in any setting
The state knows Carrie exists before age 16, not because of a death
Assess learning, not attendance or receipts; remediate, then require a change of setting after repeated failure
A Bible-only curriculum shows up in an assessment years earlier
Keep every child in periodic contact with a mandated reporter
Someone other than Stella sees Carrie, and the prayer closet, long before high school
Attach neutral accountability conditions to every public dollar
If Margaret’s home schooling were publicly funded, the money would buy measurable learning, not a signature
Give older students a statutory voice in decisions about their own schooling
Carrie’s wish to read, and to learn about her own body, counts for something against Margaret’s opt-outs
Repeal provisions that deem a funding contract to be school attendance
Margaret cannot convert an account agreement into a shield against the welfare check
None of these measures requires Margaret to renounce her faith or Carrie to profess anything. They are deliberately content-neutral. That matters, and I want to be careful here, because Margaret White is a horror-movie caricature of religious motherhood, and it would be easy, and wrong, to read this post as an argument that religious parents are the problem. Pierce protected Catholic families from a Klan-backed law; Meyer and Farrington protected German and Japanese American families. Any framework that expands state authority over schooling has to be built so it cannot be turned against minority families again. That is why Children’s Recourse locates the right in the child, not in the state’s preferences about culture or creed. The European Court of Human Rights draws the line at indoctrination, not exposure, and it has held that a child’s interest in a well-rounded education can outweigh a parent’s religious objection to particular lessons. That’s a workable model.
The only recourse in the story
Carrie is a horror story, and the genre gives its heroine one form of recourse: telekinesis. Every adult institution in her life, the family, the church, the school, the state, fails her or arrives too late, and she answers with the only power she has.
Real children don’t have that option. What they have, or ought to have, is law. Right now, the law the Court has built treats Carrie as the object of her mother’s liberty, funds her mother’s exit if her state chooses to fund exit at all, lets her mother veto what the school teaches her once she’s inside, and asks Carrie nothing.
Pierce told us that “the child is not the mere creature of the State.” True. Nor is she the mere creature of her mother, or of a neighbor’s birdhouse, or of a lucky welfare check. If we are going to let a parent hold a child’s education in her hands, and especially if we are going to pay for it, someone has to be answerable to the child.
An update on what the causal research says about school funding, with a new policy brief attached.
In January 2025, the Albert Shanker Institute released the third edition of Does Money Matter in Education? The bottom line, which I put in all caps on purpose: MONEY MATTERS, WHETHER IT’S GOING UP OR DOWN. It matters whatever the source or cause of the change, for operating and capital spending alike, and most of all for children in high-poverty, historically underfunded districts.
That was 21 months ago. Since then, pandemic aid has run out, districts are going over fiscal cliffs, universal voucher programs are diverting public revenue, and the federal role in education is under direct attack. So it’s fair to ask: has anything in the newer research changed the picture?
It has. The picture got stronger.
Figure 1. The evidence at a glance. Sources: Jackson & Mackevicius (2024); Jackson, Wigger & Xiong (2021); Biasi, Lafortune & Schönholzer (2025); Rauscher & Shen (2022).
What’s new
Here’s a quick tour of the rigorous, causally designed studies that have appeared, or appeared in major journals, since the third edition. The attached brief has details and full citations.
Capital spending matters, a lot, in the right places. Biasi, Lafortune and Schönholzer, now published in the Quarterly Journal of Economics (2025), study roughly 17,000 school bond elections using close-election comparisons. On average, $1,000 of capital spending raises test scores by about 0.05 SD. HVAC projects raise scores by more than 0.20 SD, and health, safety and building-system projects by about 0.15 SD. Athletic facilities? They raise home prices but not test scores. The gains are concentrated almost entirely in districts serving low-income students. So yes, kids learn better when they aren’t sweltering in 90-degree classrooms with bad air. Who knew?
Teacher pay keeps teachers, and that pays off. Arkansas raised its minimum teacher salary from $36,000 to $50,000 under the LEARNS Act. Zamarro and colleagues (CALDER, 2026) find that the biggest raises produced the biggest retention gains: teachers who got more than $8,000 were 3.1 points more likely to stay in their districts. In New Jersey, Shakya (2024) finds that districts adopting a $50K starting salary saw gains in math proficiency and graduation rates. Rauscher, Mellon, Loeb and Abott (2024) trace part of the effect of voter-approved operating levies to teacher salaries and counselors, and they find returns roughly twice as large in low-spending, high-poverty districts.
Federal pandemic aid helped, mostly where it was targeted. Goldhaber and Falken (CALDER, 2025) use the Title I formula to isolate ESSER’s effects and find positive math gains, larger in high-poverty districts. The Education Recovery Scorecard team (Kane, Reardon and colleagues, 2026) estimates about six extra days of learning per $1,000, and finds that the highest-poverty districts would have seen almost no math recovery without the aid. Those effects are modest per dollar. That’s what you’d expect from one-time money pushed out fast in a crisis, against the largest learning loss in modern history. They’re still positive.
Cuts hurt, including cuts by another name. Chin and Chen (AERJ, 2026) study Indiana’s 2011 voucher and charter expansion. The most exposed districts lost about $433 per pupil, class sizes grew, schools closed, and achievement eventually turned significantly negative for several student groups. Money matters going down, too. It’s the same lesson as the Great Recession studies, with a new cause.
The payoffs extend into adulthood and into state economies. Baron, Hyman and Vasquez, now in the Review of Economics and Statistics (2026), show that Michigan’s school funding increases reduced adult crime. And Kirabo Jackson’s new NBER paper (2026) follows the money all the way to the macroeconomy. After state school finance reforms, earnings per worker stay flat for about 15 years while the affected kids are still in school, then climb to roughly 4.7% above the counterfactual after 30 years. GDP per capita ends up more than 5% higher.
The exception that proves the rule
One new study found no effect. Clemens, Hoxie and Veuger (NBER, 2026) look at districts just above and below an ESSER eligibility threshold and find that the extra federal money didn’t improve test scores. Why? Because those districts didn’t spend it on schools. They used it to cut local property taxes. Per-pupil spending didn’t rise, so outcomes didn’t either.
That isn’t evidence against “money matters.” It’s evidence for it. Money matters when it reaches classrooms. This is why maintenance-of-effort provisions matter.
Figure 2. How school funding reaches students: from revenue source, through operating and capital spending, to short- and long-run outcomes.
About those scatterplots
Every so often someone posts a chart of state spending against NAEP scores, or of rising national spending against flat or falling scores, and declares the case closed. In 2025–26 we got a Brookings cross-state analysis and a Texas A&M blog post along these lines. The Brookings authors, to their credit, say plainly that their analysis is not causal.
Those charts are the 2020s version of the Coleman-era correlations that the entire modern literature was built to get past. States that spend more differ in student need, labor costs, and a hundred other ways. And a national score decline that coincides with smartphones, a pandemic and changing test-taking populations tells you nothing about what an additional dollar does in a given district. That’s exactly why researchers turned to close elections, formula kinks, court orders and policy shocks. When you do that, you get the same answer over and over.
Figure 3. Sixty years of evidence. Green = funding increases improved outcomes; red = funding decreases worsened them.
Why the case keeps getting stronger
Look at the timeline. Through the 1980s and early ’90s, the “money doesn’t matter” argument rested on vote counts of correlational studies. Starting around 2016, quasi-experimental studies began piling up: different states, different decades, different funding sources (courts, legislatures, local voters, the federal government, even recessions and voucher programs) and different outcomes (test scores, graduation, college, earnings, poverty, crime, civic engagement, mobility, state GDP). The direction almost never changes.
Each new natural experiment is another independent test. Each one passes. That’s what a mature, robust body of evidence looks like.
So what?
Cuts are not neutral. States staring at fiscal cliffs or voucher-driven revenue losses should expect real, measurable harm to kids, concentrated in high-need districts.
Progressive funding is efficient funding. The highest returns are in the districts with the greatest needs and the fewest resources.
New money has to add, not replace. Pair aid with maintenance-of-effort requirements.
Fund people and buildings. Salaries, staffing, HVAC and safe buildings are complements, not competitors.
Use the right time horizon. Several years for operating effects, three to eight for capital, decades for economic returns.
The question isn’t whether money matters. It’s whether we’re willing to provide it.
The full policy brief, “Money Matters — and the Evidence Keeps Growing,” with the infographic, pathways figure, evidence timeline and references, is attached below.
In my last post I described the Dependent States of America: the states, mostly red, whose schools lean most heavily on federal aid, in many cases because they have chosen to underinvest in their own children. This post looks at the other end of the spectrum. These are the states that fund their schools adequately, including the schools serving the poorest children, and that perform well. And they include the states that, after letting their school funding collapse in the Great Recession, eventually chose to reinvest.
In an earlier working paper, I called these the Education States. They are states where courts have been willing to uphold and enforce education rights, where legislators and governors have funded those rights whether a court ordered them to or not, and which are now positioned to protect their own students while the federal government retreats. I noted then that the Education States are not exclusively blue or northern. The data bear that out, though not by much.
Measuring an Education State
I use three measures. The first two come from the School Finance Indicators Database (SFID), 2026 release, which covers school years through 2023. Funding adequacy compares what districts actually spend per pupil with what our National Education Cost Model estimates they would need to spend to reach national average test scores, given their students’ needs and regional costs. A ratio of 1.00 means spending is exactly adequate; 0.75 means districts spend three-quarters of what they need. I look at adequacy statewide and in each state’s highest-poverty fifth of districts, because a state can be well funded on average while its poorest districts are left behind. The third measure is performance: each state’s 2024 NAEP scores in grade 4 and grade 8 reading and math, expressed as standard deviations above or below the national public school average.
From these, I sort states into three groups:
Leading: adequate funding statewide and in high-poverty districts (both ratios at or above 1.00), with NAEP performance at or above the national average.
Close behind: adequate statewide, high-poverty districts at 85% of adequate or better, and NAEP at or above, or within 0.10 standard deviation of, the national average.
Not there yet: everyone else.
Six states lead: Massachusetts, New Jersey, Connecticut, New Hampshire, Wyoming and North Dakota. Eleven more are close behind, including New York, Maine, Rhode Island, Minnesota, Washington, Colorado, California and Illinois, along with Kansas, Nebraska and Montana. The remaining 31, including nearly the entire South, are not there yet, though several of them are moving in the right direction. (Alaska, Hawaii and Vermont aren’t rated, because the cost model can’t produce reliable estimates for them.)
Funding and performance go together, though not perfectly. Across states, the correlation between statewide adequacy and NAEP performance is about 0.45. Every leading state performs above the national average, with Massachusetts (+0.27 SD) and New Jersey (+0.18) at the top.
The Great Divergence
The Great Recession hit every state’s school budget. What separates the Education States from the rest is what happened next.
Nationally, adequacy in high-poverty districts fell from 0.79 in 2009 to 0.66 by 2013. Those districts spent, on average, about two-thirds of what they needed. In the states Harris carried by 10 points or more, high-poverty adequacy dropped from 0.95 to 0.76 at its 2013 low. Then those states climbed back steadily, reaching 0.96 by 2019, before any federal pandemic aid arrived, and about 1.00 by 2023. In the states Trump carried by 10 or more, high-poverty adequacy fell from an already low 0.63 to 0.52, crept back only to 0.56 by 2019, and stood at 0.62 in 2023, still below where it was in 2009.
In other words, the gap between blue and red states’ highest-poverty districts was wide before the recession (about 0.32) and wider after the recovery (about 0.40 in 2019). Both groups cut their effort. In 48 of the 50 states with data, state and local school revenue is a smaller share of personal income today than in 2008; only Illinois and Hawaii are exceptions. But the median solidly Democratic state’s effort fell from 4.3% to 3.8%, while the median Lean R state’s fell from 3.8% to 2.4%, a decline of more than a third.
2024 result
States
Statewide adequacy, 2023
High-poverty adequacy, 2009
Post-recession low
High-poverty adequacy, 2023
Effort, 2008 → 2023
NAEP 2024
Leading / Close behind
Solid R (R+10 or more)
24
0.82
0.63
0.52
0.62
4.3% → 3.5%
0.00
2 / 3
Lean R (R+2 to 10)
4
0.77
0.59
0.52
0.58
3.8% → 2.4%
−0.05
0 / 0
Toss-up (margin under 2)
3
1.13
0.64
0.56
0.69
4.8% → 4.1%
+0.03
0 / 0
Lean D (D+2 to 10)
6
1.31
1.05
0.88
1.05
4.5% → 3.6%
+0.01
2 / 2
Solid D (D+10 or more)
14
1.24
0.95
0.76
1.00
4.3% → 3.8%
0.00
2 / 6
United States
51
1.01
0.79
0.66
0.83
4.3% → 3.6%
0.00
6 / 11
Adequacy = actual current spending per pupil ÷ spending required to reach national average test scores (SFID National Education Cost Model); 1.00 = exactly adequate. Group values are enrollment-weighted (pooled); high-poverty = each state’s highest-poverty fifth of districts. Post-recession low is the lowest value between 2010 and 2016. Effort = state and local school revenue as a share of personal income, median state. NAEP 2024 = average of grade 4 and 8 reading and math, in national standard deviations from the national public average, simple mean across states. Leading / Close behind = number of states in each group. Adequacy not estimated for Alaska, Hawaii or Vermont. Sources: School Finance Indicators Database (2026 release); NAEP; FEC 2024 certified results.
The pattern by political leaning is stark. In states Harris carried, by any margin, high-poverty districts are funded at or near adequate levels on average. In states Trump carried by any margin, they are funded at about 60% of adequate, and that hasn’t changed in fifteen years. The three toss-up states, Michigan, Pennsylvania and Wisconsin, look like their politics: adequately funded on average but with their poorest districts well short, at 0.69.
Average NAEP performance by group is close to the national average across the board. That is partly because group averages blend high and low performers, and partly because performance depends on much more than funding, including child poverty, which is higher in many red states. It’s not that funding doesn’t matter. The leading states all outperform. But money is a necessary condition, not a sufficient one.
The Education States, by name
State
Statewide adequacy
High-poverty adequacy: 2009 → low → 2023
Effort
NAEP
Reinvested
2024 margin
Leading
Wyoming
1.80
2.10 → 1.78 → 1.93
3.71%
+0.15
R+45.8
New Hampshire
2.07
1.45 → 1.31 → 1.54
3.34%
+0.16
Yes
D+2.8
New Jersey
1.69
1.38 → 1.10 → 1.26
5.16%
+0.18
D+5.9
Massachusetts
1.54
1.36 → 0.99 → 1.15
3.23%
+0.27
D+25.2
North Dakota
1.33
0.90 → 0.71 → 1.12
3.51%
+0.09
Yes
R+36.5
Connecticut
1.57
1.36 → 1.13 → 1.07
4.07%
+0.11
D+14.5
Close behind
New York
1.46
1.22 → 1.00 → 1.09
5.02%
−0.03
D+12.6
Maine
1.56
1.11 → 0.93 → 1.09
3.73%
−0.07
D+6.9
Washington
1.35
0.74 → 0.66 → 0.96
3.38%
+0.04
Yes
D+18.2
Rhode Island
1.32
1.04 → 0.82 → 0.94
3.82%
0.00
D+13.8
Colorado
1.16
0.73 → 0.56 → 0.92
3.04%
+0.14
Yes
D+11.0
Minnesota
1.18
0.78 → 0.74 → 0.92
3.47%
+0.10
D+4.2
Kansas
1.14
0.99 → 0.76 → 0.91
4.16%
0.00
R+16.1
Montana
1.07
0.75 → 0.71 → 0.91
2.76%
+0.09
Yes
R+19.9
Nebraska
1.13
0.92 → 0.87 → 0.89
3.69%
+0.03
R+20.5
California
1.09
0.59 → 0.46 → 0.89
4.03%
−0.08
Yes
D+20.1
Illinois
1.14
0.69 → 0.66 → 0.87
4.68%
+0.05
Yes
D+10.9
Adequacy and effort are for 2023; NAEP is 2024, in standard deviations from the national public average. Leading: statewide and high-poverty adequacy both at or above 1.00, and NAEP at or above the national average. Close behind: statewide adequacy at or above 1.00, high-poverty adequacy at least 0.85, and NAEP within 0.10 SD of the national average or above it. Reinvested: high-poverty adequacy gained at least 0.15 from its 2010–2016 low, had already gained at least 0.08 by 2019 (before pandemic aid), and by 2023 exceeded its 2009 level. Row shading shows 2024 presidential leaning: solid red/blue = margin of 10+ points; pale red/blue = 2 to 10 points. Sources: School Finance Indicators Database (2026 release); NAEP 2024; FEC 2024 certified results.
Effort explains a good share of the difference. Across the 47 states with estimates (excluding DC), state and local effort and statewide adequacy are correlated at about 0.40. Of the 23 states putting in less than the median effort (3.6% of personal income), 17 voted for Trump, and only 8 fund their schools adequately statewide. Of the 24 at or above the median, 18 do. Twenty-one states fall below adequacy statewide, and 19 of them voted for Trump. The exceptions run in both directions. New Hampshire, Massachusetts, Washington and Colorado reach adequacy with below-median effort because they are wealthy. Georgia, South Carolina and New Mexico put in above-median effort and still fall short, because their capacity is lower and their needs are higher. But the lower-left corner of the chart, low effort and inadequate funding, belongs almost entirely to Republican-leaning states: Florida, Arizona, North Carolina, Nevada, Idaho, Tennessee and Oklahoma.
Of the 17 leading and close-behind states, 12 voted for Harris and five for Trump. The red Education States fall into two types. Wyoming and North Dakota are small, energy-rich states that can fund adequate schools without exceptional effort. Wyoming’s effort has actually fallen from 5.8% of personal income in 2008 to 3.7%, but its funding is built on decades of court-enforced adequacy under the Campbell County decisions. Kansas, Nebraska and Montana are more traditional Plains states with long-standing commitments to their public schools. Kansas, in particular, was pulled back by its courts. After deep cuts under Governor Brownback, the Gannon litigation forced a multi-year reinvestment that the Kansas Supreme Court finally approved in 2019. Its high-poverty adequacy, stuck at 0.75 as late as 2019, reached 0.91 by 2023.
Nor is being blue enough. Maryland (high-poverty adequacy 0.71), Virginia (0.68), New Mexico (0.67) and Delaware (0.98, but with NAEP well below average) are all “not there yet.” And several of the leading states have slipped. Connecticut’s high-poverty districts went from 1.36 in 2009 to 1.07, and New Jersey’s from 1.38 to 1.26. Both are still adequate, but the margin is narrower than it was.
The states that eventually reinvested
The most hopeful part of the story is the states that hit bottom after the recession and then chose to rebuild, mostly through new funding formulas, often prompted by litigation, and mostly well before federal pandemic aid arrived.
California adopted the Local Control Funding Formula in 2013, directing additional funding to low-income students and English learners. High-poverty adequacy rose from 0.46 in 2012 to 0.74 by 2019 and 0.89 by 2023, the largest gain of any state.
Washington, under the state supreme court’s 2012 McCleary decision, overhauled its funding in 2017 and 2018. High-poverty adequacy rose from 0.66 to 0.96.
Illinois replaced one of the nation’s most regressive systems with its Evidence-Based Funding formula in 2017, and is one of only two states whose effort is higher now than in 2008. High-poverty adequacy rose from 0.66 to 0.87.
Oregon passed the Student Success Act in 2019. High-poverty adequacy rose from 0.63 to 0.99 by 2019 and stood at 0.94 in 2023.
Colorado rose from 0.56 to 0.92 even before eliminating its “budget stabilization factor” in 2024. That change isn’t yet in these data.
Massachusetts and New Jersey, both already adequate, recommitted through the Student Opportunity Act (2019) and New Jersey’s 2018 school funding reform (S2), respectively, reversing post-recession erosion.
A second wave of reinvestment is too recent to show fully in data that end in 2023. Kansas is one example. Maryland’s Blueprint for Maryland’s Future, enacted in 2021, has moved high-poverty adequacy from 0.53 in 2019 to 0.71. New Mexico, responding to the 2018 Yazzie/Martinez ruling, has moved from 0.48 to 0.67. Michigan’s 2023 budgets began to fund its new Opportunity Index. Pennsylvania’s Commonwealth Court declared the state’s system unconstitutional in 2023, and the legislature has begun adding adequacy funding. Whether these states become Education States depends on whether they sustain the effort.
Not every state that recovered deserves the credit. Arizona, Tennessee, South Dakota and Missouri also improved high-poverty adequacy from their post-recession lows, but their effort kept falling. Arizona’s dropped from 3.7% of personal income in 2008 to 2.4%, and Tennessee’s from 3.4% to 2.7%. Their gains came from economic growth, not renewed commitment, and several are now expanding universal vouchers that will pull money away from the public districts these figures describe. Utah is the more convincing case: its high-poverty districts are now at 0.94 of adequate and its students outperform the national average by 0.15 SD.
Then there are the states that never came back. Florida’s high-poverty adequacy is lower now (0.70) than in 2009 (0.76), and its effort has fallen from 3.8% to 2.2%, the lowest in the country. North Carolina (0.61 to 0.55; effort 3.6% to 2.4%) and Texas (0.56 to 0.52) followed the same path. Iowa, whose high-poverty districts were adequately funded in 2009 (1.01), has slid to 0.82.
Leading the way
The Great Recession was a natural experiment in political will. Every state took a hit. Some states rebuilt, usually because courts insisted or because legislatures and governors decided their poorest children deserved better. Others took the opportunity to cut taxes and never looked back. Fifteen years later, the result is two countries: one where children in high-poverty districts attend schools funded at roughly the level needed to reach national average outcomes, and one where they attend schools funded at about 60% of that level.
The Education States now carry a double burden. In the short term, they must protect their own students from a federal administration that is withholding funds, dismantling the Department of Education and targeting equity itself. That means backfilling lost federal aid, building their own data capacity as NCES and IES are hollowed out, setting aside reserves (as I’ve proposed, through federally tax-exempt education endowments), and closing the door to publicly funded religious and discriminatory schooling by tightening charter oversight before the courts force it open.
In the longer term, they are the model for Project 2029. The states that reinvested after the recession show that the decline is a choice and can be reversed. They also show what reversing it takes: a cost-based formula, a commitment of state revenue, and in most cases a court willing to hold the state to its constitution. A federal foundation aid formula of the kind we’ve proposed would ask every state to do what California, Washington, Illinois and Kansas did, with federal help for states whose capacity genuinely falls short. The Education States have already shown the rest of the country the way. The question is whether the rest of the country will follow.
Data notes
Adequacy, effort and spending figures are from the School Finance Indicators Database, State Indicators Database, 2026 release (school years through 2023). Adequacy is actual current spending per pupil divided by required spending per pupil, estimated by the SFID National Education Cost Model to reach national average test scores. The model doesn’t produce estimates for Alaska, Hawaii, or Vermont after 2016, and SFID advises caution in interpreting New York’s estimates.
2020 to 2023 spending includes some federal pandemic relief (ESSER) funds, which raise adequacy in absolute terms in those years. For that reason, the reinvestment test requires that recovery was already under way by 2019. Effort is a strictly state and local measure and is unaffected.
Group adequacy figures are enrollment-weighted, pooling all states in each group. Effort and NAEP group figures are median and simple mean across states, respectively. Effort is state and local school revenue as a share of aggregate personal income.
NAEP performance is the average of 2024 grade 4 and grade 8 reading and math scale scores, each expressed as the difference from the national public school average divided by the national standard deviation (NAEP Data Service).
Political leaning is based on the statewide popular-vote margin in the 2024 presidential election (FEC certified results). Solid = 10 points or more; Lean = 2 to 10 points; Toss-up = under 2 points.
We like to think of our public schools as locally controlled and state funded, with Washington playing a bit part. Nationally, that’s roughly right. In fiscal year 2024, according to the Census Bureau’s Annual Survey of School System Finances, public school systems took in about $995 billion, of which about $115 billion, or 11.6%, came from federal sources.
But that national average hides a very different country. In some states, federal aid is a rounding error in school budgets. In others, more than one of every five dollars flowing to local public schools comes from Washington. Welcome to the Dependent States of America.
Mapping dependence
The measure that matters here is dependence: federal revenue as a share of each state’s total school revenue. It tells us how much a state’s schools would be exposed if federal aid were cut, frozen, or weaponized, and how much leverage Washington has (or could have) over what happens in those schools.
Mississippi tops the list, with 22.7% of school revenue coming from federal sources, followed by Alaska (21.0%), New Mexico (19.7%), South Dakota (19.4%), Louisiana (19.2%) and West Virginia (18.4%). At the other end, New Jersey’s schools draw only 6.3% of their revenue from Washington, with Utah, Minnesota, Connecticut and Massachusetts all around 8%.
The politics of dependence
It won’t surprise many readers that the Dependent States of America lean heavily red. Sorting states by the 2024 presidential result (using FEC certified state returns):
2024 presidential result
States
Federal share of total school revenue
Median state
Trump-won
31
13.5%
13.9%
Harris-won (incl. DC)
20
9.7%
9.6%
Solid R (R+10 or more)
24
13.9%
15.0%
Lean R (R+2 to 10)
4
14.8%
15.5%
Toss-up (margin under 2)
3
10.7%
10.9%
Lean D (D+2 to 10)
6
8.6%
8.3%
Solid D (D+10 or more)
14
9.9%
10.3%
United States
51
11.6%
11.8%
Group shares are pooled (group federal revenue ÷ group total revenue). Rows are shaded by 2024 presidential leaning: solid red = R+10 or more; pale red = R+2 to 10 (Arizona, Georgia, Nevada, North Carolina); pale purple = toss-up, margin under 2 points (Michigan, Pennsylvania, Wisconsin); pale blue = D+2 to 10 (Maine, Minnesota, New Hampshire, New Jersey, New Mexico, Virginia); solid blue = D+10 or more (including DC). Sources: Census Bureau, FY 2024 Annual Survey of School System Finances; FEC 2024 certified results.
Schools in states Trump carried draw 13.5 cents of every revenue dollar from Washington, compared with 9.7 cents in states Harris carried, about 40% more reliance. Dependence rises with the margin: across states, the correlation between Trump’s 2024 margin and the federal share of school revenue is about 0.55 (excluding DC). Nine of the ten most dependent states voted for Trump (New Mexico being the exception). Nine of the ten least dependent voted for Harris (Utah being the exception).
Dependent by circumstance, or by choice?
Here’s the important part. The Dependent States of America are not dependent because Washington is especially generous to them. Federal dollars per pupil are about the same in Trump-won states ($2,403) as in Harris-won states ($2,598). What differs is the denominator. State and local revenue averages about $15,400 per pupil in Trump-won states, compared with about $24,300 in Harris-won states. A similar federal contribution simply makes up a much larger slice of a much thinner budget.
And that thinner budget is not only a function of being poorer. As I lay out in a recent working paper, state wealth and income account for about half, or less, of the variation in how adequately states fund their schools. The rest is effort, or the lack of it. Forty-one states now devote a smaller share of their economies to K-12 schools than they did before the 2007-09 recession. Some states, like Mississippi, have so little capacity that even average effort would leave them well short. Others, like Florida and Arizona, could raise enough on their own simply by exerting average effort. They choose not to.
Both kinds of states show up among the Dependent States of America. New Mexico, West Virginia and Alaska exert above-average effort and remain highly dependent anyway; they are dependent largely by circumstance. Arizona (18.1% federal), North Carolina (17.4%), Tennessee (15.9%) and Florida (15.3%) are dependent substantially by choice: very low-effort states leaning on federal aid, several of them while cutting taxes and expanding private school vouchers. And there’s a bitter irony here. Many of the states most dependent on federal aid today are the same states that, during the civil rights era, adopted “antiregulation” acts, using state aid and local tax policy to shield districts that refused federal desegregation mandates.
Low effort, high dependence
To separate circumstance from choice, the table below lists every state that both puts in below-average effort (state and local school revenue as a share of personal income) and draws an above-average share of its school revenue from Washington.
State
State & local effort (% of personal income)
Effort
Federal share of revenue
2024 leaning (margin)
Mississippi
3.49%
Below avg.
22.7%
Solid R (R+22.9)
South Dakota
2.75%
Very low
19.4%
Solid R (R+29.2)
Louisiana
3.71%
Near avg.
19.2%
Solid R (R+22.0)
Arizona
2.41%
Very low
18.1%
Lean R (R+5.5)
Montana
2.74%
Very low
17.8%
Solid R (R+19.9)
North Carolina
2.43%
Very low
17.4%
Lean R (R+3.2)
Kentucky
3.67%
Near avg.
17.1%
Solid R (R+30.5)
Tennessee
2.81%
Very low
15.9%
Solid R (R+29.7)
Wyoming
3.69%
Near avg.
15.5%
Solid R (R+45.8)
North Dakota
3.73%
Near avg.
15.4%
Solid R (R+36.5)
Florida
2.35%
Very low
15.3%
Solid R (R+13.1)
Arkansas
3.58%
Below avg.
14.7%
Solid R (R+30.6)
Oklahoma
3.26%
Below avg.
13.9%
Solid R (R+34.3)
Nevada
3.07%
Below avg.
13.6%
Lean R (R+3.1)
Texas
3.48%
Below avg.
13.4%
Solid R (R+13.7)
Hawaii
3.69%
Near avg.
13.1%
Solid D (D+23.1)
Rhode Island
3.63%
Near avg.
12.7%
Solid D (D+13.8)
Wisconsin
3.58%
Below avg.
11.9%
Toss-up (R+0.9)
Idaho
2.86%
Very low
11.7%
Solid R (R+36.5)
United States
3.73%
11.6%
States with below-average effort and above-average federal share, sorted by federal share. Rows are shaded by 2024 presidential leaning: solid red = R+10 or more; pale red = R+2 to 10; pale purple = toss-up (margin under 2 points); pale blue = D+2 to 10; solid blue = D+10 or more. Effort tiers: very low = under 3.0%; below average = 3.0 to 3.59%; near average = 3.6% to the U.S. average of 3.73%. Effort = FY 2024 state and local school revenue ÷ 2023 personal income. DC excluded (see data notes). Sources: Census Bureau FY 2024 Annual Survey of School System Finances, Tables 1 and 19; FEC 2024 certified results.
Nineteen states meet both conditions, and 17 of them voted for Trump in 2024. The two Harris-won states on the list, Hawaii and Rhode Island, sit just below the national effort average. All seven states with very low effort voted for Trump: Florida (2.35%), Arizona (2.41%), North Carolina (2.43%), Montana, South Dakota, Tennessee and Idaho. Florida, Arizona and North Carolina devote only about two-thirds of the national average share of personal income to their schools, yet each draws more than 15% of its school revenue from federal sources. Mississippi is a different case. Its effort is modestly below average, but its capacity is so low that average effort alone would not get it close to adequacy.
Every state in this table falls below the 4%-of-personal-income effort floor in our federal formula simulation (described below). Under that design, each would have to raise its own effort before receiving gap-closing federal aid.
So what should federal policy do with the Dependent States of America? Two things: allocate aid toward adequacy, and attach meaningful strings.
Allocating federal aid toward adequacy
Federal aid today is layered on top of 50 separate state systems and targeted mainly on child poverty through programs like Title I and IDEA. It helps, but it does little to close either the gaps between adequately and inadequately funded states or the gaps between high- and low-need districts within states. Even during the period of elevated pandemic aid, the highest-poverty districts in southeastern states received the most federal money and the largest federal share, yet their total revenue remained woefully inadequate.
With my colleagues Matthew Di Carlo and Mark Weber, I’ve proposed a different approach: a new federal foundation aid formula that treats the federal government as the top layer of a national school finance system. It works much the way a good state formula works:
Set an adequacy target for every district, using a national education cost model to estimate the per-pupil spending needed to reach common outcome goals (in our simulation, a modest goal: national average reading and math outcomes), adjusted for student needs and regional costs.
Require a minimum state and local effort, in our simulation 3.5% of gross state product or 4% of aggregate personal income, roughly the national average.
Direct that state and local revenue toward the districts furthest below adequacy.
Have federal aid fill whatever gap remains, but only once a state has done its part.
In our proof-of-concept simulation, universal adequacy would require roughly $52 billion in additional federal aid per year, targeted to districts in 34 states, along with about $80 billion in additional state and local fair-share investment. Full participation would reduce the share of students in inadequately funded districts from about 55% to zero and shrink the funding gap between the highest- and lowest-poverty districts by more than 60%.
The effort requirement matters most for the Dependent States of America. Low-capacity states like Mississippi would receive substantially more help once they reach the effort floor, because their gaps genuinely exceed what they can raise. Low-effort states like Florida, Arizona, North Carolina and Tennessee would have to raise their own effort before receiving gap-closing aid. Federal dependence would stop being a subsidy for choosing not to try. And there’s no reason this logic must be limited to new money. The same framework could guide the distribution of the roughly $115 billion in federal revenue already flowing to schools.
Applying pressure where dependence is greatest
When one fifth of a state’s school revenue comes from Washington, Washington has both a stake and a lever. We’ve used that lever before. Southern states were required to adopt education articles in their constitutions as a condition for readmission to the Union after the Civil War. A century later, the Elementary and Secondary Education Act of 1965 put real federal money on the table, and the threat of losing it gave teeth to desegregation enforcement. The federal government is again using that lever, but in the opposite direction, threatening to withhold aid from schools and states that pursue equity.
A future federal role should apply the lever deliberately, and most firmly where dependence is greatest. Conditions attached to federal aid should include:
Civil rights protections for all children. Full compliance with Title VI, Title IX, IDEA and Section 504, and with the obligation to educate every child regardless of immigration status. Any provider receiving public funds, including charter and voucher-receiving schools, must be bound by the same nondiscrimination requirements.
Common national goals. Shared outcome goals and measures, broader than reading and math scores and including preparation for postsecondary education, the workforce and civic life, that define what adequate funding must accomplish and drive the cost estimates behind the formula. These are national goals, not a national curriculum; achieving them would require revisiting long-standing statutory limits on federal direction of curriculum, and states would retain authority over how to meet them.
Minimum effort and no backsliding. States should not be able to eliminate the primary tax sources funding their schools, as Mississippi has proposed with its income tax and Florida with property taxes, or divert public funds to private schools, while drawing federal aid to backfill the hole.
Enforceable education rights. Every state constitution includes an education article, but enforcement by state courts has been uneven at best. Federal aid should come with pressure to make those rights real.
Transparent data. School-level spending and broader outcome reporting, supported by a rebuilt, not dismantled, National Center for Education Statistics and Institute of Education Sciences.
There are legal limits. Spending Clause conditions must be clearly stated, related to the purpose of the funds, and not so severe that they amount to coercion. That argues for attaching new conditions to new adequacy aid, phased in over time, rather than threatening to pull existing funds overnight. But the principle stands: the more a state’s schools depend on federal dollars, the stronger the federal interest in ensuring those schools serve every child, to common standards, under the protection of the law.
Whose rights? Children’s, not parental preferences
There’s another reason the Dependent States of America deserve federal attention. Several of them are where public money now follows parental preference with the fewest strings attached. Arizona, at 18.1% federal and among the lowest-effort states in the country, has made every school-age child eligible for an Empowerment Scholarship Account since 2022. Under its statute, a parent’s signature on the account agreement counts as compulsory school attendance. The law requires no testing and no curricular approval, and it measures no learning. Florida’s universal program requires a norm-referenced test, but funding turns on submitting the test, not on the score. Idaho’s high court has upheld that state’s private education tax credit, and Wyoming’s has cleared its education savings accounts to operate. All four states appear in the low-effort, high-dependence table above.
As I explain in Not the Mere Creature of Anyone (full working paper), for a century the Supreme Court has asked how much control parents may exercise over their children’s schooling, and almost never what the child is owed. Since 2017, the doctrine has converged on a single result: parental authority, underwritten by public money and increasingly insulated from public conditions. Carson v. Makin requires a state that funds any private option to fund religious ones. Mahmoud v. Taylor and Mirabelli v. Bonta make parental religious objection a powerful claim inside the public schools that remain. And on November 3, the Court hears St. Mary Catholic Parish v. Roy, which asks whether states may attach neutral conditions to the money at all.
Consider, as I did in Experimenting With Our Children, the student in Phoenix who turns 18 having been failed by her account-funded education. She can’t sue her parents; courts have long refused to recognize a duty of care for academic outcomes. She can’t sue the state under the federal Constitution; education is not a fundamental federal right, and the state generally owes no duty to protect a child from harm by a private actor, including a parent. And state courts reviewing universal voucher and account programs have increasingly asked whether the money harms the public system, not whether any individual child is being educated. She is the one party to the arrangement with no rights of her own.
Pierce v. Society of Sisters told us that the child “is not the mere creature of the State.” True. But neither is she the mere creature of her parents. And Pierce struck a bargain that is too often forgotten: parents could leave the public schools, but the state kept the power to reasonably regulate all schools, to inspect and examine them, and to require studies essential to good citizenship. Federal aid can and should reinforce the state’s side of that bargain. Any state that spends public money, its own or Washington’s, on private schooling or home education should, as a condition of federal aid, adopt what I call Children’s Recourse:
Register every school-age child, in every setting, so no child disappears from public view.
Assess learning, not attendance or receipts, paired with remediation and, after repeated failure, a required change of educational setting.
Keep every child in periodic contact with a mandated reporter, such as a teacher, nurse or counselor, and review any withdrawal from school while child-protection concerns are open.
Attach neutral accountability conditions to every public dollar: assessment participation, public reporting of outcomes and finances, nondiscrimination in admissions, including on the basis of disability, and audits. To survive Carson and Fulton, these must apply to all providers alike, without discretionary exemptions.
Give older students a voice in decisions about their own schooling, the question Justice Douglas asked in his Yoder dissent and the Court has never answered.
End the fiction that a funding contract is an education, repealing provisions like Arizona’s that deem a signed account agreement to be school attendance.
None of these measures requires any family to profess anything, and none prescribes a culture or a creed. They ask only that someone be answerable to the child whose public education dollars are being spent. And they rest on the strongest ground available: state constitutional education clauses, which courts in Kentucky, Wyoming, New Hampshire and Washington have read as conferring an individual, even fundamental, right on each child. A right held by the child doesn’t stay behind when the child leaves the public system. It follows her, and so should the state’s duty, and the federal government’s interest, in seeing that she is actually educated.
From the Dependent States of America to Project 2029
None of this will happen under the current federal administration, which is dismantling the Department of Education, clawing back appropriated funds and greenlighting states already eroding their own public schools. In the short term, the work falls to what I’ve called the Education States, which are not exclusively blue or northern (Kansas qualifies), to protect their own students: backfilling threatened federal aid with state funds, much as southern states once used state aid to resist civil rights, and building the data capacity Washington is abandoning.
But short-term resistance is not a plan for the Dependent States of America. Children in Florida, Arizona, North Carolina and Tennessee can’t wait for their legislatures to rediscover the value of public education, and children in Mississippi can’t wait for their state to grow its way to adequacy. That requires a longer game: Project 2029.
Project 2029 is a new reconstruction. Ideally, it would include a federal constitutional amendment requiring that every child be provided, by their state with federal assistance, equal educational opportunity. At a minimum, it must include:
Common national goals and standards, and measures of them, to guide what we expect our schools to accomplish and what it costs.
A national cost model to drive a federal foundation aid formula targeting dollars to where they are needed most.
A required minimum state and local effort, so that federal aid complements rather than substitutes for state responsibility.
Rebuilt federal data and research capacity to monitor progress toward equal educational opportunity.
Children as rights-holders, with federal aid reinforcing each child’s right to an adequate education wherever public money sends her, not deferring to parental preference as a proxy for the child’s interest.
What Congress would have to change
Project 2029 can’t be accomplished by executive order, nor should it be. It requires legislation, and in several places it means rewriting rules that currently get in the way. Congress would need to enact a federal foundation aid program1; replace ESEA’s maintenance-of-effort rule with an effort floor2; fix Title I’s spending factor3; revisit the prohibitions on federal involvement in standards and curriculum4; strengthen civil rights enforcement5; write Children’s Recourse into the conditions on federal aid6; ratify the UN Convention on the Rights of the Child7; make education rights enforceable8; fully fund IDEA9; and rebuild and protect the federal education infrastructure10. The notes below spell out each change and the statutes and cases involved.
Project 2025 was years in the making, so that an administration could act on day one. Project 2029 must be just as detailed and just as ready, but with a crucial difference. It must be built on broad congressional buy-in rather than executive shows of force, and it must uphold, not subvert, our core constitutional commitments: equal protection, due process, free speech, and the balance between the free exercise of religion and the prohibition on its establishment. Over the longer run, it means revisiting the precedents that have subordinated the child to parental preference and public money, from Carson and Espinoza back toward Pierce itself, with any replacement built so it can never again be turned against minority families.
The Dependent States of America are dependent today largely because they’ve chosen to underinvest in their own children, and federal aid has quietly covered for it. Project 2029 should turn that dependence into a partnership: real federal help, toward real adequacy, in exchange for real effort and real protections for every child, protections that belong to the child, not to the adults choosing for her. If we are going to spend public money in a child’s name, someone has to be answerable to that child. Equitable and adequate funding alone won’t get us to equal educational opportunity. But we can’t get there without it.
Enact a federal foundation aid program. A new title of the Elementary and Secondary Education Act (ESEA) authorizing adequacy-based aid driven by a national cost model, with a minimum state and local effort requirement (for example, 4% of personal income or 3.5% of gross state product) and a multi-year phase-in for states below the floor. Elementary and Secondary Education Act of 1965, as amended by the Every Student Succeeds Act (2015), 20 U.S.C. § 6301 et seq. The effort benchmarks follow Baker, Di Carlo & Weber (2022). ↩︎
Replace the maintenance-of-effort rule with an effort floor. ESEA’s current maintenance-of-effort requirement asks only that a state spend at least 90% of what it spent the year before. A state can stay at very low effort forever and remain compliant. The test should be effort relative to capacity, and states should not be able to cut taxes or divert public funds to private schools below that floor while drawing federal foundation aid. ESEA § 8521, 20 U.S.C. § 7901 (maintenance of effort: combined fiscal effort or aggregate expenditures of at least 90 percent of the prior year). ↩︎
Fix Title I’s spending factor. Title I’s formulas use a state per-pupil expenditure factor that sends more aid per poor child to states that already spend more, regardless of capacity or effort. Allocations should instead reflect adequacy gaps and effort. ESEA §§ 1124–1125A, 20 U.S.C. §§ 6333–6337. Under the Basic Grant formula, the state expenditure factor is 40 percent of the state’s average per-pupil expenditure, bounded at 80 to 120 percent of the national average. ↩︎
Revisit the prohibitions on federal involvement in standards and curriculum. The General Education Provisions Act and provisions the Every Student Succeeds Act added to ESEA bar federal direction of curriculum and federal incentives for particular standards. These should be amended to permit common national outcome goals and measures, including an expanded NAEP, while leaving curriculum and instruction to states and districts. General Education Provisions Act § 103, 20 U.S.C. § 1232a; ESEA § 1111(e), 20 U.S.C. § 6311(e); ESEA § 8526A, 20 U.S.C. § 7906a. ↩︎
Strengthen civil rights enforcement. Restore private enforcement of Title VI disparate-impact protections, which the Supreme Court closed off in Alexander v. Sandoval (2001). Codify the guarantee of Plyler v. Doe that every child, regardless of immigration status, is entitled to a public education. And as a condition of federal aid, require states that fund private providers, through vouchers, education savings accounts, tax-credit scholarships or charters, to hold them to the same nondiscrimination, special education and transparency requirements as public schools. Title VI of the Civil Rights Act of 1964, 42 U.S.C. § 2000d; Alexander v. Sandoval, 532 U.S. 275 (2001); Plyler v. Doe, 457 U.S. 202 (1982). ↩︎
Write Children’s Recourse into the conditions on federal aid. Require any state that spends public funds on private schooling, education savings accounts or home education to register every child, assess learning rather than receipts, keep children in contact with mandated reporters, apply neutral accountability conditions uniformly to every provider, give older students a voice, and drop any rule deeming a funding agreement to be school attendance. Drafted as neutral, generally applicable conditions, these stand the best chance of surviving whatever the Court decides in St. Mary. Ariz. Rev. Stat. Ann. § 15-2402(I); Carson v. Makin, 596 U.S. 767 (2022); Fulton v. City of Philadelphia, 593 U.S. 522 (2021); St. Mary Catholic Parish v. Roy, No. 25-581 (U.S., argued Nov. 3, 2026). See Baker (2026), Part VII. ↩︎
Ratify the UN Convention on the Rights of the Child. It recognizes parents’ primary responsibility for their children, exercised consistent with the child’s evolving capacities, while guaranteeing the child a voice in matters affecting her and subjecting private schools to minimum standards. The United States signed it in 1995 and is the only UN member that is not a party. Convention on the Rights of the Child, arts. 5, 12, 18, 29, Nov. 20, 1989, 1577 U.N.T.S. 3 (signed by the United States Feb. 16, 1995). Ratification requires the advice and consent of two-thirds of the Senate, U.S. Const. art. II, § 2, cl. 2. ↩︎
Make education rights enforceable. Condition foundation aid on each state guaranteeing, in law, a judicially enforceable right to an adequate education. In the longer run, pursue a federal constitutional amendment so that this right no longer depends on the willingness of 50 state courts. San Antonio Independent School District v. Rodriguez, 411 U.S. 1, 35 (1973) (no federal fundamental right to education); Papasan v. Allain, 478 U.S. 265, 285 (1986) (leaving open whether a minimally adequate education is a fundamental right). ↩︎
Fully fund IDEA. Congress authorized federal funding of up to 40% of the excess cost of educating students with disabilities in 1975, and it has never come close. Closing that gap is among the most direct ways to relieve pressure on low-capacity states. Individuals with Disabilities Education Act, 20 U.S.C. § 1411(a)(2) (maximum grant of 40 percent of the national average per-pupil expenditure times the number of children served). ↩︎
Rebuild and protect the federal education infrastructure. Reauthorize the Education Sciences Reform Act with statutory independence and stable funding for NCES and IES. Codify the Census school finance survey and school-level spending reporting. Fund the cost modeling a national formula requires, and protect the Department of Education’s statutory functions from administrative dismantling. Education Sciences Reform Act of 2002, 20 U.S.C. § 9501 et seq.; Department of Education Organization Act, 20 U.S.C. § 3401 et seq.; ESEA § 1111(h)(1)(C)(x), 20 U.S.C. § 6311(h)(1)(C)(x) (school-level per-pupil expenditure reporting). ↩︎
Data notes
Revenue figures are from the U.S. Census Bureau, Annual Survey of School System Finances, FY 2024, Tables 1 and 19. Per-pupil federal revenue is federal revenue divided by FY 2024 enrollment; federal shares match Census Table 5. Note that Census Table 11 misreports Connecticut’s federal revenue per pupil (it repeats Alaska’s $4,604); the correct figure is $2,418.
Effort is FY 2024 state and local school revenue divided by calendar 2023 personal income (Census Table 19), the same pairing Census uses. DC is excluded from the effort table because, as a single city with much of its economy earned by commuters who live elsewhere, its revenue and income base aren’t comparable to a state’s. Political leaning is based on the statewide popular vote margin in the 2024 presidential election, from FEC certified results.
FY 2024 federal revenue still includes some pandemic relief (ESSER) funds, which may inflate federal shares relative to a typical year. Federal shares also reflect formula drivers such as child poverty, disability counts and federal or tribal land (Impact Aid), which partly explains Alaska, New Mexico and the Dakotas.