Another southern miracle
Every so often someone discovers a miracle in a southern state. Back in February it was Mississippi. Now it’s Alabama, whose 4th graders gained 6.3 points in NAEP math from 2022 to 2024, against 2.4 points nationally. That gain is being held up as proof that “red state” reform (accountability, science of reading, numeracy coaches, and lately, school choice) is the model for everyone else.
So let’s look. I compare Alabama and Mississippi to Arizona and Florida, the two states that have gone furthest in dispersing public money to charters and private school vouchers, and benchmark all four against Massachusetts and New Jersey. My two points:
- There is no miracle in Alabama. In 8th grade, the better gauge of what a school system adds up to, Alabama is last among these six states in both math and reading, and still sliding.
- To the extent Alabama (and Mississippi) aren’t collapsing like Arizona and Florida, it’s less about what they did than what they didn’t do. They didn’t drive fiscal effort to the floor, didn’t build a parallel charter sector, and, until this year, didn’t send public money to private schools at scale. They kept investing in their public schools. Steadily, if not adequately.
No miracle in 8th grade
Alabama’s 8th graders scored 261.8 in NAEP math in 2024. That is essentially the score Alabama posted in 2003 (261.9). In reading, at 249.6, they’re below where they were in 2003 (253.2). Among these six states, Alabama is now last in both subjects.
As I said about Mississippi, 8th grade is a better indicator of the cumulative effect of a school system than 4th grade. A 4th grade bump can come from one well-targeted early-grades push. An 8th grade gain means the system is building on it.
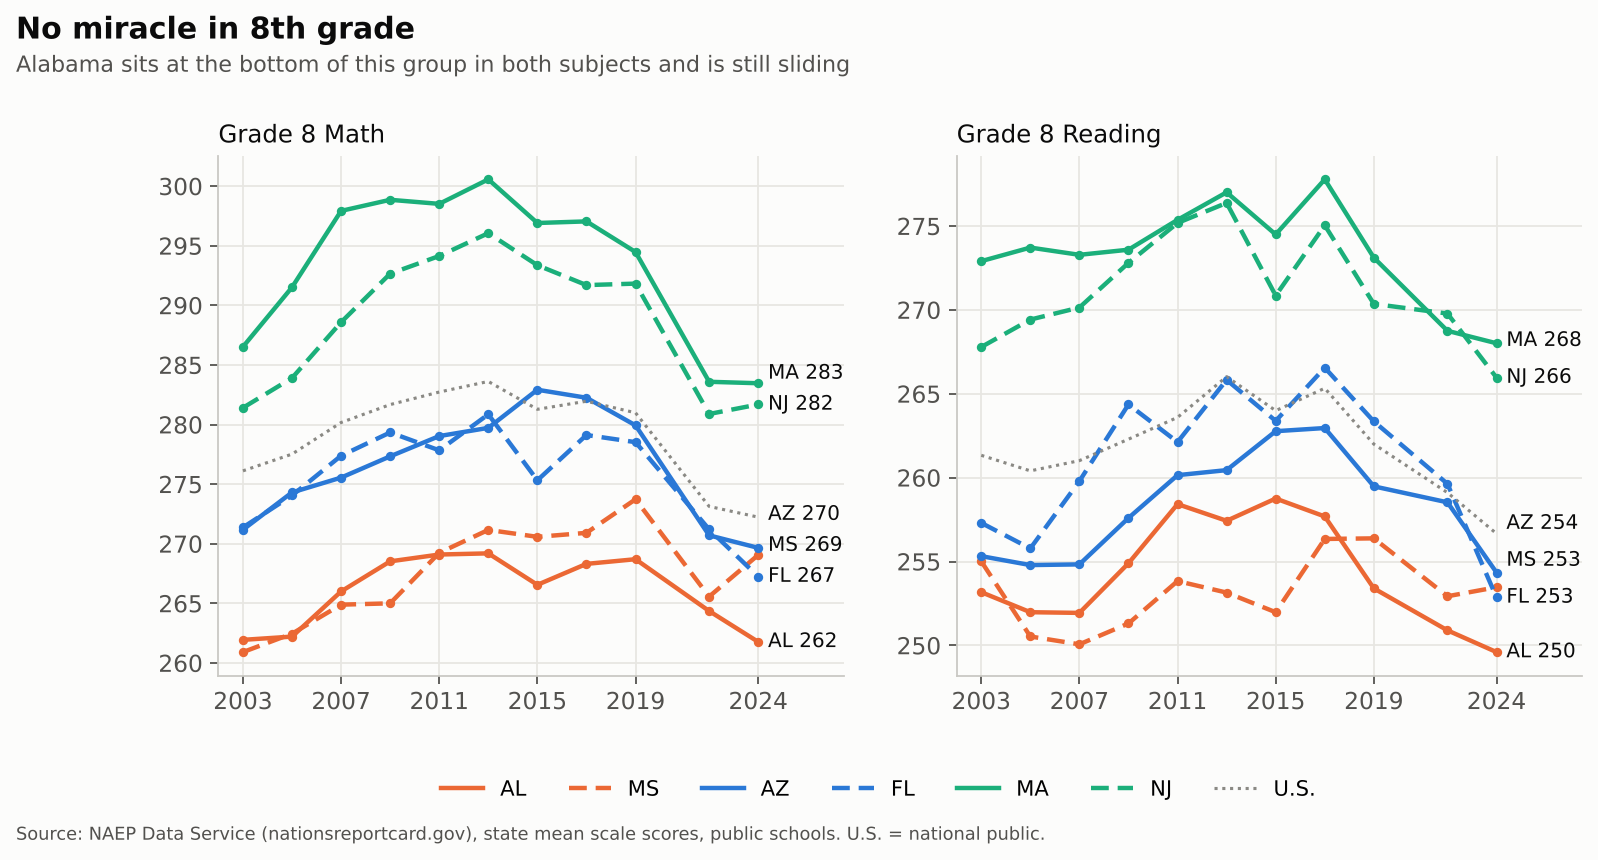
The “miracle” lives entirely in 4th grade math. Alabama gained 6.3 points there from 2022 to 2024. Over the same two years, Alabama’s 8th graders lost 2.6 points in math. Since 2019, it’s +6.7 in 4th grade and −6.9 in 8th. If there’s a story here, it’s an early-numeracy push that hasn’t (yet) carried into the middle grades.
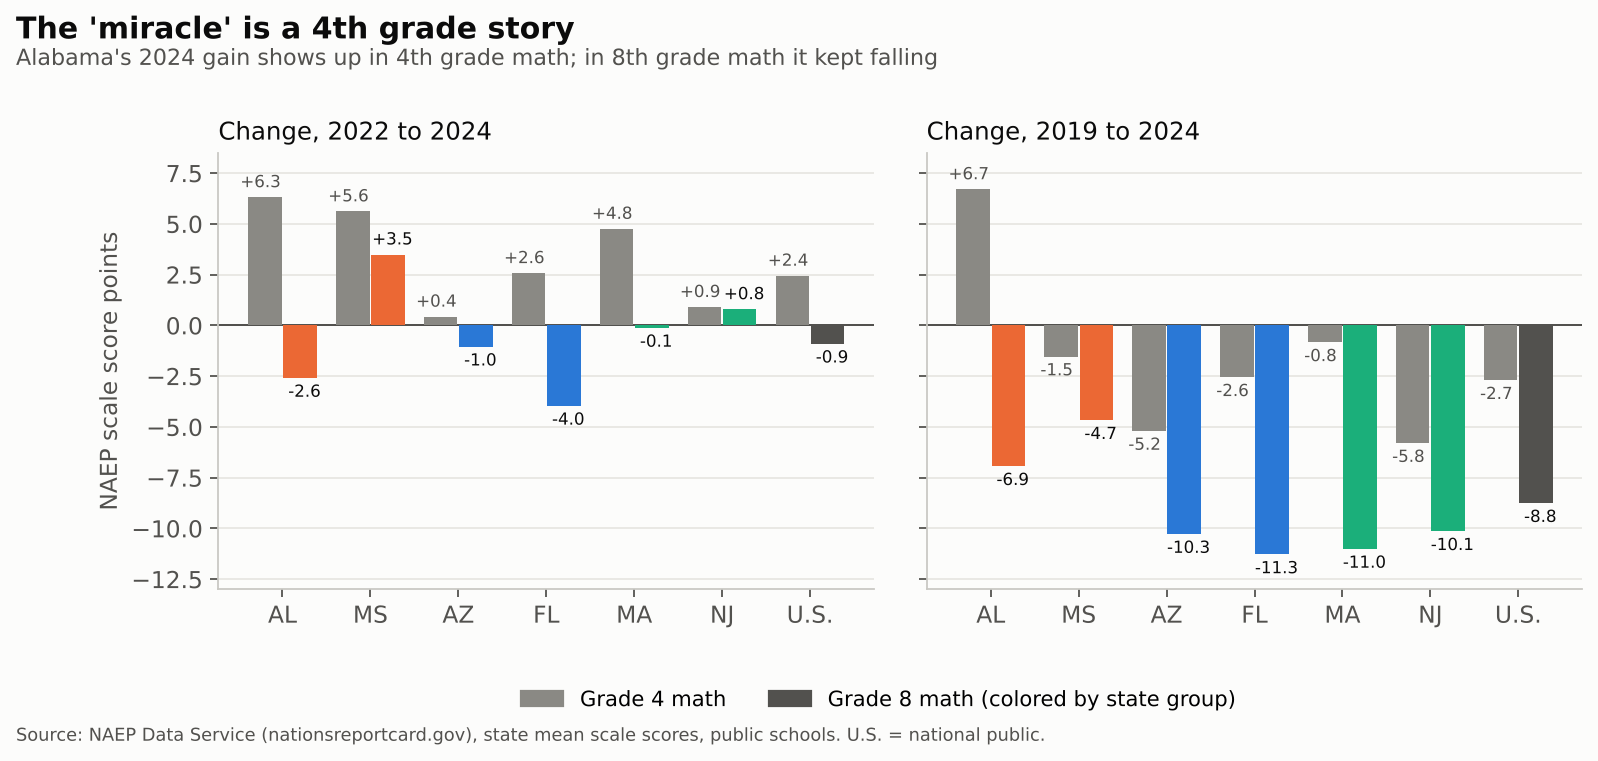
If anyone in this group has a claim to a rebound, it’s Mississippi, the only one of the six whose 8th grade math score rose meaningfully from 2022 to 2024 (+3.5). Even so, Mississippi doesn’t catch Massachusetts or New Jersey. Not even close. Both still sit 13 to 14 points above Mississippi in 8th grade math and 13 to 15 points above it in reading.
What Alabama and Mississippi didn’t do
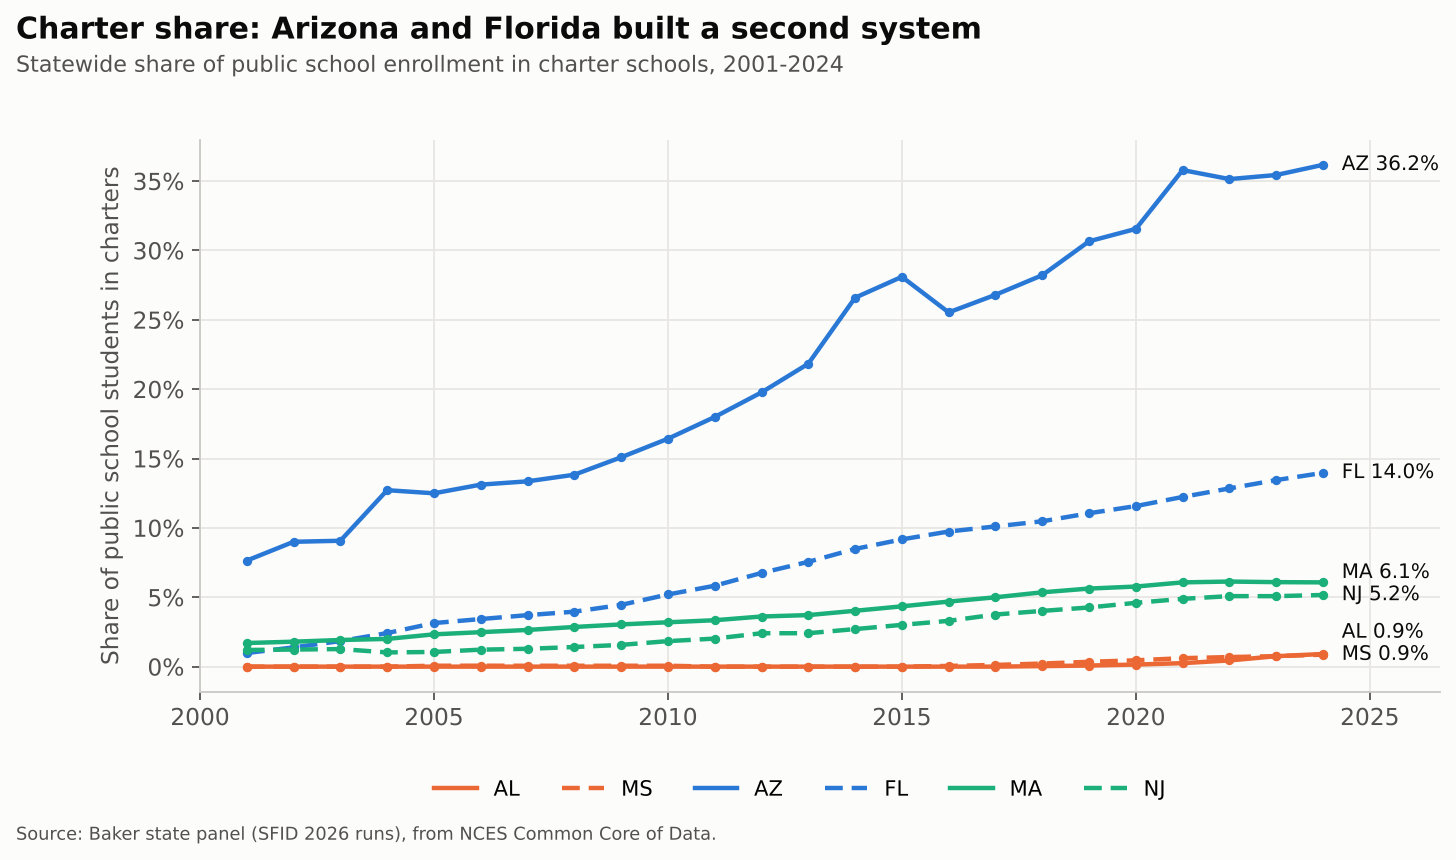
Arizona and Florida have spent two decades building a second school system alongside the first. By 2024, 36 percent of Arizona’s public school students were in charter schools, and 14 percent of Florida’s. Alabama and Mississippi? Under 1 percent each. Even Massachusetts and New Jersey, hardly charter-averse, sit at 5 to 6 percent.
Then there are vouchers, which in their current form are mostly education savings accounts (ESAs). Here the gap is even starker:
| State | Program(s) | Students (est.) | Public dollars (est.) |
|---|---|---|---|
| Florida | FES-EO, FES-UA, Tax Credit Scholarship | ~515,000 (2025-26) | ~$3.8 billion |
| Arizona | Empowerment Scholarship Accounts (universal since 2022) | 100,000+ (early 2026) | ~$1 billion a year |
| Alabama | CHOOSE Act ESA (new in 2025-26) | ~23,600 approved in 2025-26; 34,000+ for 2026-27 | ~$124 million; $174 million for 2026-27 |
| Mississippi | Special-needs ESA, dyslexia and speech-language scholarships | ~600 (2024-25) | small |
| Massachusetts | none | 0 | 0 |
| New Jersey | none | 0 | 0 |
Florida figure: 432,581 FES scholarship FTEs estimated by the state for 2025-26 (EDR) plus 81,947 Tax Credit Scholarship students (EdChoice); dollars from the Florida Policy Institute via WUSF. Arizona: AZPBS. Alabama: Yellowhammer News and Decatur Daily. Mississippi: Empower Mississippi.
The point isn’t that every charter or voucher dollar is wasted. It’s that Arizona and Florida have been spreading roughly the same (shrinking, as we’ll see) public effort across more and more systems, with less and less accountability for where it lands. During the period over which Alabama’s and Mississippi’s 4th grade gains were built, neither state was doing that.
Effort: Arizona and Florida walked away
Fiscal effort, K-12 spending as a share of gross state product, tells you how much of its economic capacity a state chooses to put into its schools. Alabama spent 3.3 percent of GSP on K-12 in 2024, the same as in 2013 and a bit above the U.S. state average (3.1 percent). Arizona fell from 2.5 to 2.0 percent over those years, and Florida from 2.6 to 2.2 percent. Both now put in less than half of New Jersey’s effort (4.8 percent).
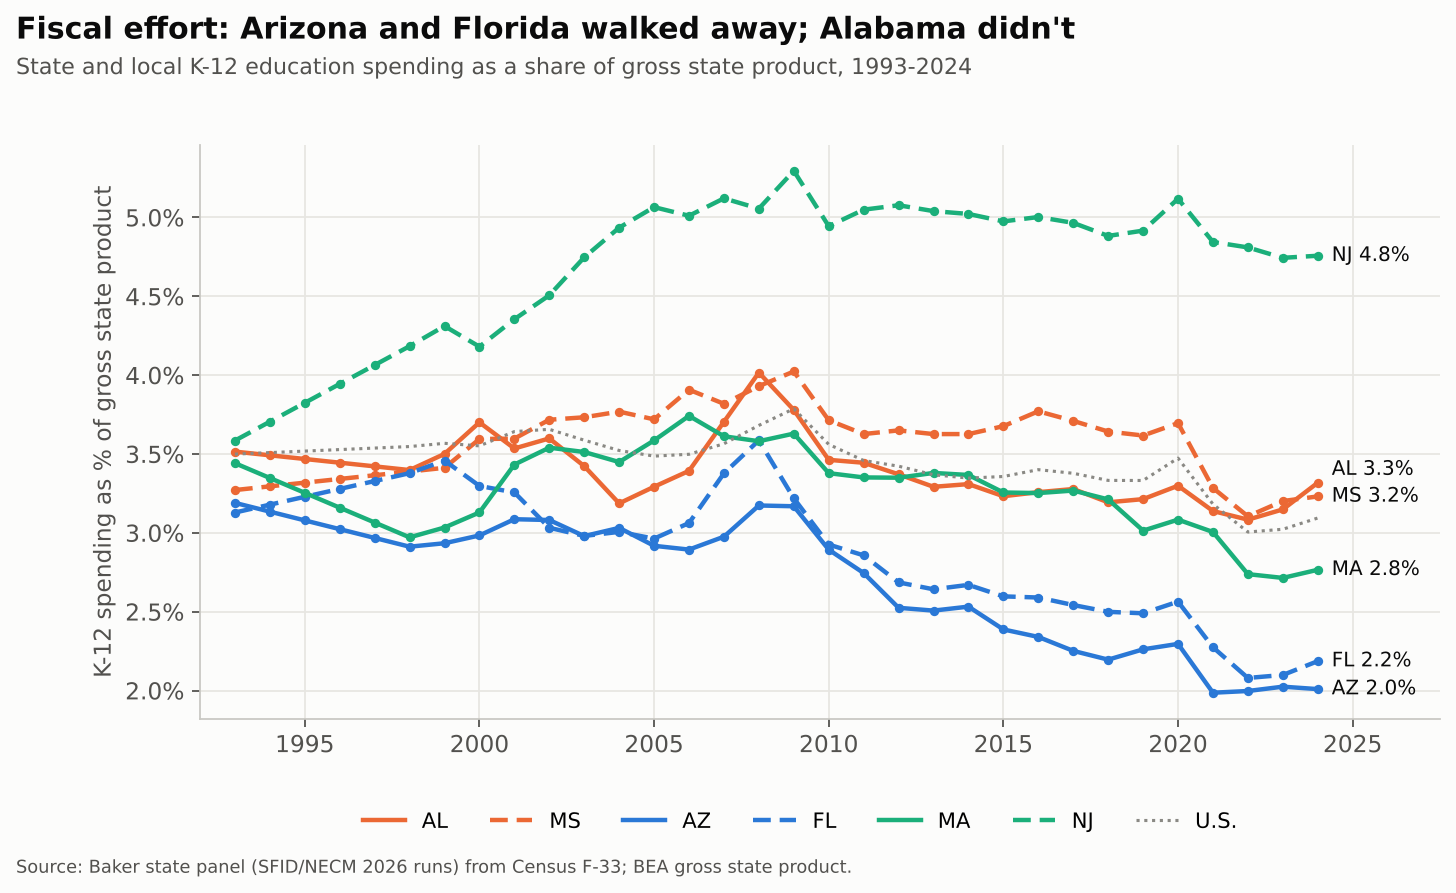
Alabama isn’t a hero here. Its effort peaked at 4.0 percent in 2008 and took a big hit after the recession. Mississippi dropped from 3.7 to 3.1 percent between 2020 and 2022 (partly fast post-pandemic GSP growth, not only budget choices). But neither has ridden effort to the floor the way Arizona and Florida have.
Spending: the order flipped
The result shows up in what schools actually have to spend. Adjusting for regional differences in labor costs (using the Education Comparable Wage Index), Alabama and Florida have traded places since the early 1990s. In 1993, Florida spent about $6,350 per pupil in labor-cost-adjusted dollars and Arizona about $5,340, both well ahead of Alabama ($4,890) and Mississippi ($4,470). By 2024:
- Alabama: $7,204, up 47 percent since 1993
- Mississippi: $6,627, up 48 percent
- Florida: $6,425, up 1 percent, and still 8 percent below its 2008 level
- Arizona: $5,965, up 12 percent
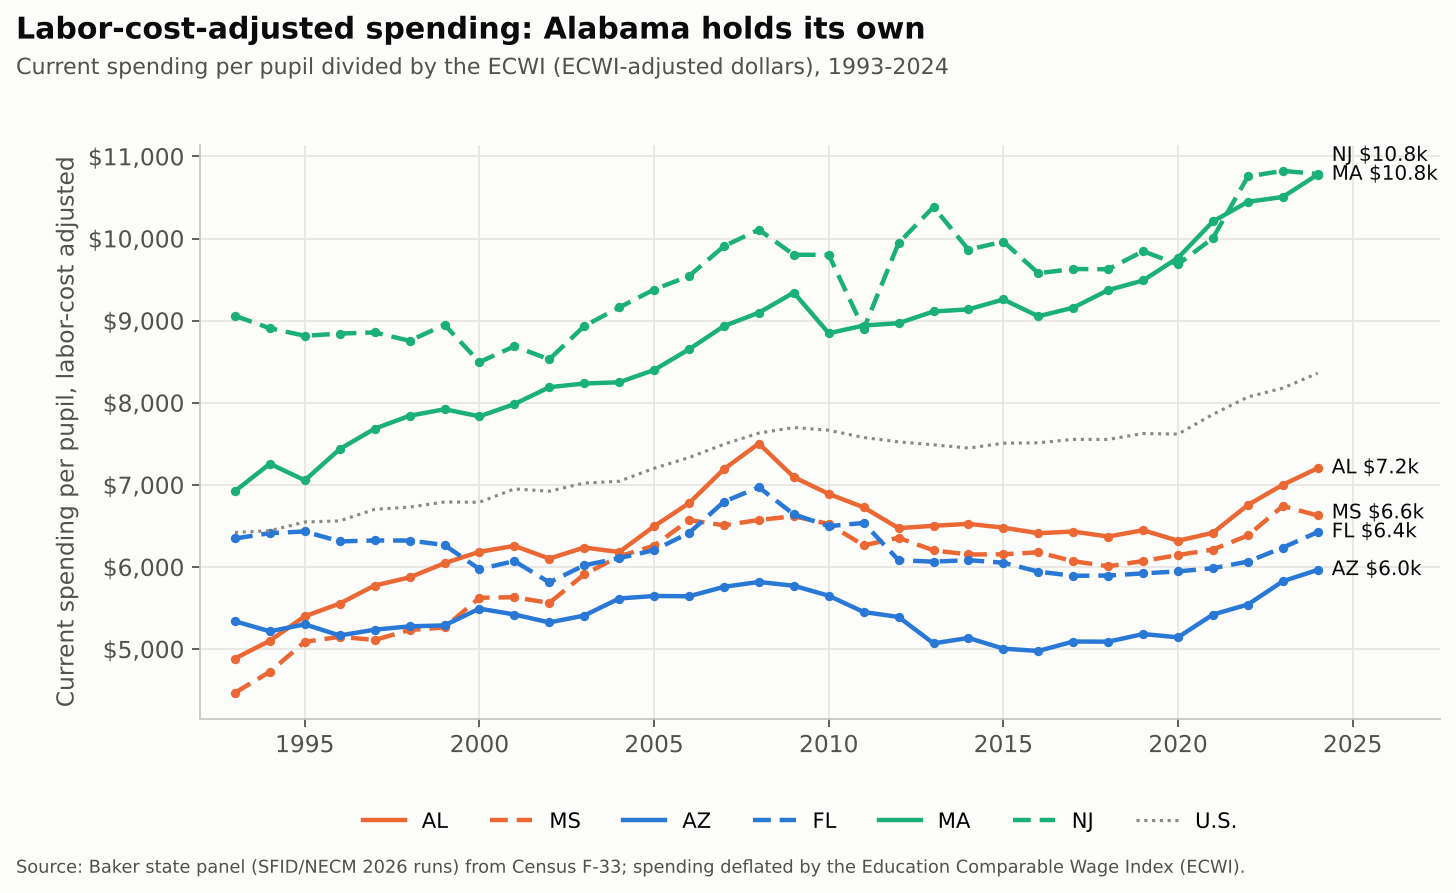
Massachusetts (up 56 percent, to $10,779) shows what sustained investment looks like at a higher level. Alabama and Mississippi are nowhere near that. But they’ve kept climbing while Arizona and Florida stalled.
Adequacy: steady isn’t the same as enough
Here’s where the “steady investment” story needs a caveat. Spending more than Arizona isn’t the same as spending enough. Our National Education Cost Model (NECM) estimates what each district would need to spend to reach national average outcomes, given its poverty, labor costs and size. Because Alabama’s children are poorer, its required spending is higher. So even though Alabama outspends Arizona and Florida, it’s further from adequate.
In 2024, Alabama districts spent 64 percent of what the NECM says they need, statewide. That’s third lowest among the 47 states we estimate, ahead of only Mississippi (51 percent) and Texas (59 percent). Arizona sits at 72 percent and Florida at 70. Massachusetts and New Jersey are well above adequate (132 and 136 percent). In Alabama’s highest-poverty districts, the figure is 44 percent.
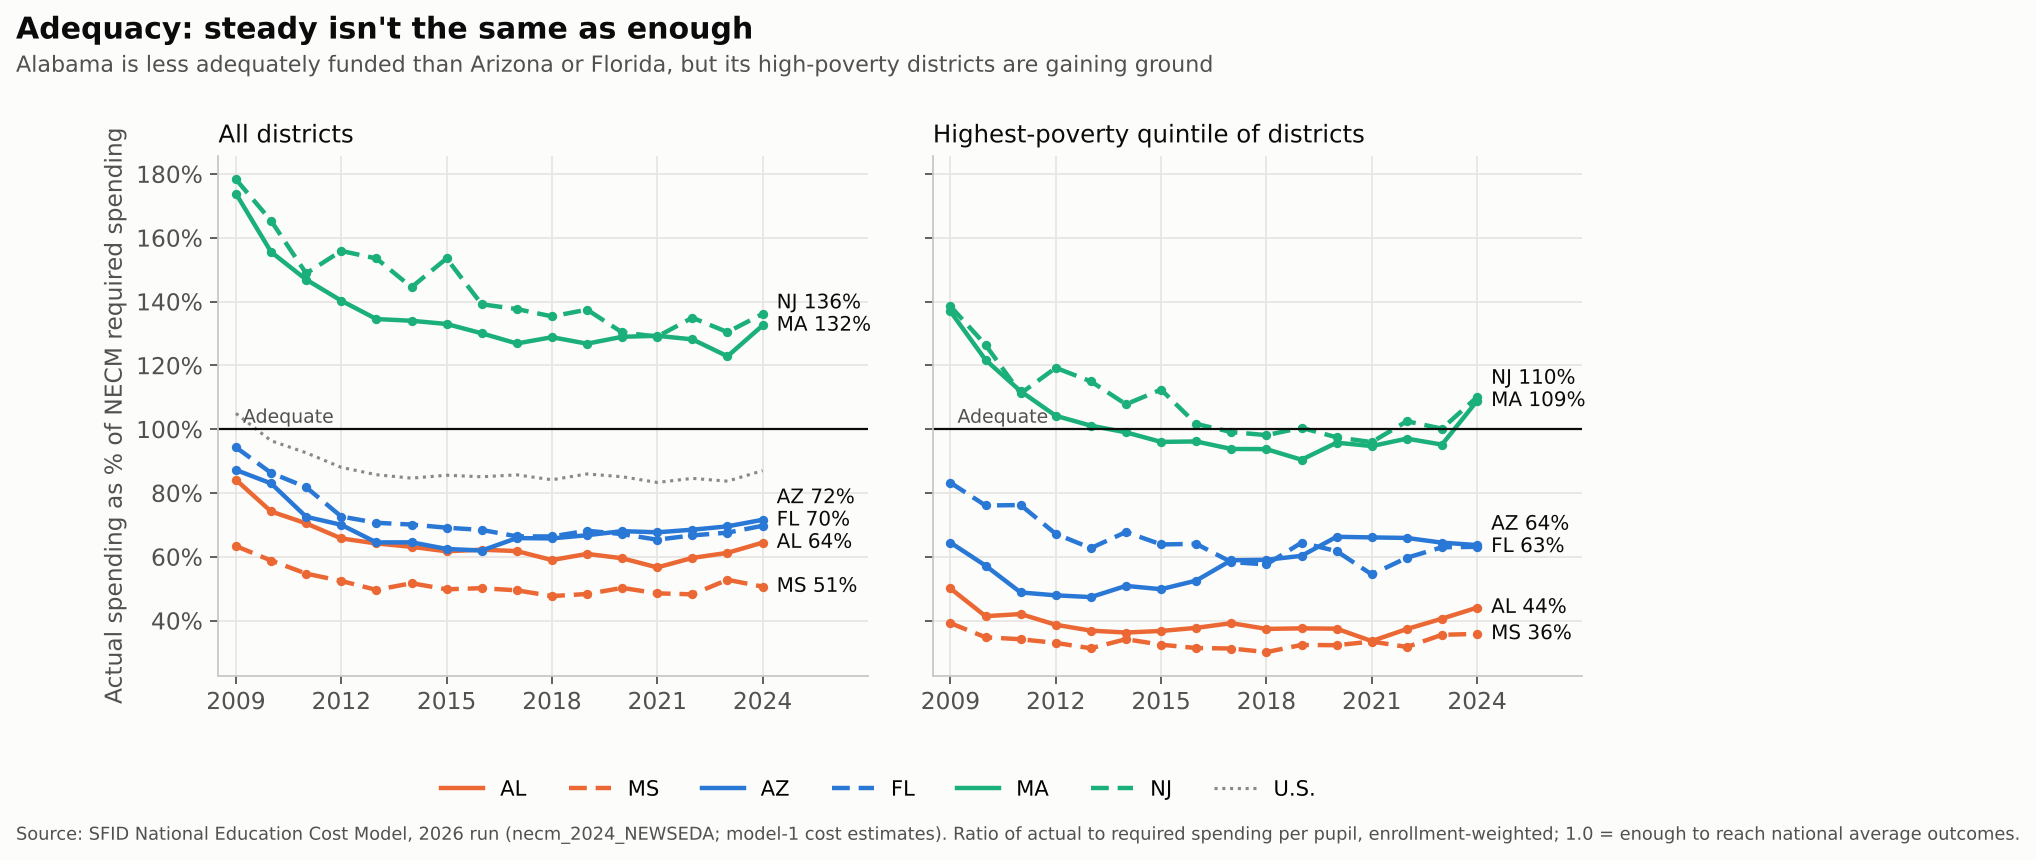
The encouraging part: Alabama’s high-poverty districts are gaining ground, from 34 percent of adequate in 2021 to 44 percent in 2024, and statewide from 57 to 64 percent. That’s the kind of sustained, if modest, investment that might eventually show up in 8th grade. It isn’t there yet.
Nearly every Alabama child (96 percent) attends a district funded below adequate levels, and about two thirds attend districts in the bottom fifth nationally. A state can hold effort steady and still leave its schools short. Alabama has.
Caveats, and how much they matter
A few things look, at first glance, like they cut against this story. Mostly they don’t.
First, NAEP gains and losses depend on where you start. Low-scoring states have more room to gain, and high-scoring states more room to fall. Across all 50 states, the correlation between a state’s starting score and its change is strongly negative over the long run: about −0.4 to −0.65 for 2013 to 2024, depending on grade and subject. It’s also negative for 4th grade math from 2022 to 2024 (−0.52). So part of Alabama’s 4th grade jump is what you’d expect from a low starting point. Adjusting for that, Alabama still beat expectations by about 3 points, fifth best in the country. Good, not miraculous.
The 2019 to 2024 drop in 8th grade is different. It hit high- and low-scoring states about equally (correlation near zero in math, −0.15 in reading). Here’s how each state did relative to what its 2019 level predicts:
| State | Grade 8 math, actual change | vs. expected (rank of 50) | Grade 8 reading, actual change | vs. expected (rank of 50) |
|---|---|---|---|---|
| Mississippi | −4.7 | +4.0 (3rd) | −2.9 | +2.2 (8th) |
| Alabama | −6.9 | +1.8 (14th) | −3.8 | +1.1 (20th) |
| Arizona | −10.3 | −1.8 (35th) | −5.1 | +0.2 (26th) |
| New Jersey | −10.1 | −1.9 (37th) | −4.4 | +1.8 (12th) |
| Florida | −11.3 | −2.7 (41st) | −10.5 | −4.9 (48th) |
| Massachusetts | −11.0 | −2.8 (42nd) | −5.1 | +1.3 (16th) |
So, relative to where they started, Alabama and Mississippi held up better than most states, and Florida held up worse than almost anyone. That’s the “not collapsing” point, and it survives the adjustment.
Second, Massachusetts and New Jersey fell further than Alabama in 8th grade math since 2019. In raw points, yes. How much of that is about where they started depends on how you fit it. A straight line says both fell 2 to 3 points more than expected. Let the relationship bend (a lowess fit), and both land about where their starting level predicts (−0.4 each, 29th and 30th of 50). The ten highest-scoring states in 2019 fell 9.0 points on average; the ten lowest fell 8.0. Either way, these gaps are a point or two, about the size of NAEP’s margin of error for a single state. What holds under every specification: Florida near the bottom (41st to 43rd in math, 48th in reading) and Mississippi near the top (3rd or 4th in math).
Third, Alabama is still sliding in 8th grade math in the latest round, down 2.6 points from 2022 to 2024 while Arizona dipped 1.0. That’s one two-year interval, and Alabama’s longer-run, level-adjusted record is average (22nd of 50 for 2013 to 2024). Average is the point: there’s no miracle.
Finally, Alabama just started down Arizona’s road. The CHOOSE Act ESA launched in 2025-26 with about 23,600 approved students, roughly three quarters of them already in private school or homeschooling. For 2026-27, 34,000+ students are approved at $174 million, with $250 million appropriated. Mississippi’s House passed a universal ESA bill this year, 61-59, before the Senate Education Committee killed it.
Expected change in the table comes from a linear regression of each state’s change on its starting score across all 50 states (NAEP state means, public schools). Quadratic and cubic terms add little (R² rises by about one point; the squared term is not significant), but a lowess fit moves Massachusetts and New Jersey to about average.
So what’s the lesson?
There’s no miracle in Alabama. Its 8th graders score where they did two decades ago, it’s last of these six states in both subjects, and its schools remain among the least adequately funded in the country.
But there may be a lesson in the comparison. Over the past decade, Alabama held its fiscal effort and Mississippi kept its above the national average. Both have raised labor-cost-adjusted spending by roughly half since the early 1990s, and both kept their public dollars in their public schools. Arizona and Florida cut effort to among the lowest levels in the nation, stalled their spending, and spread what was left across district schools, charters and private school accounts. Florida in particular is now in free fall.
That’s not a causal analysis, but it’s more rigorous than most of the “miracle” talk I’ve seen. If the folks touting Alabama want to learn something from it, the lesson isn’t the CHOOSE Act. It’s the boring stuff Alabama did before the CHOOSE Act: keep funding your public schools, and keep funding them better, especially where kids are poorest. Now Alabama is about to find out what happens when it stops.
Data notes and sources
- NAEP: state mean scale scores, public schools, from the NAEP Data Service, 2003-2024. “U.S.” is national public.
- Fiscal effort, labor-cost-adjusted spending, charter share: my state panel built from the 2026 SFID runs (Census F-33, BEA gross state product, NCES Common Core of Data). Spending is current spending per pupil divided by the Education Comparable Wage Index. Public version: SFID State Indicators Database, 2026 release.
- Adequacy: SFID National Education Cost Model, 2026 run with updated SEDA outcomes, extended through 2024 (model-1 cost estimates; districts under 100 students and outliers excluded; Alaska, Hawaii and Vermont not estimated). Ratios are enrollment-weighted actual over required spending; “bottom fifth” = the 20 percent of districts nationally furthest below adequate.
- Vouchers/ESAs: see the links under the table above. Counts mix awards, participants and FTEs, so treat them as orders of magnitude.
- Earlier post: On Miracles in Mississippi.


