There Is No Alabama Miracle (But There Is a Lesson)

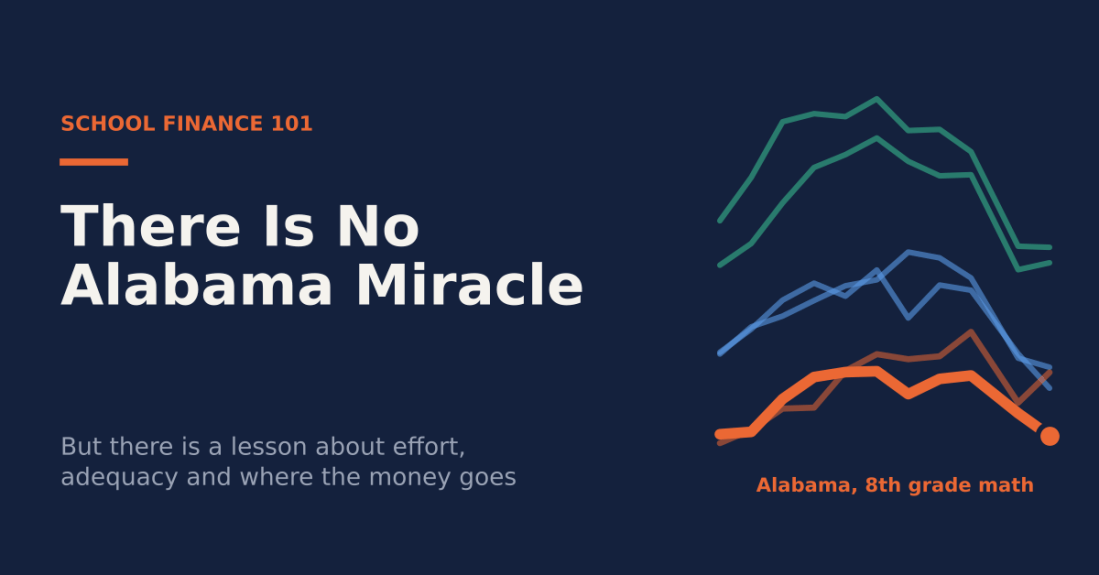
Header: There Is No Alabama Miracle. But there is a lesson about effort, adequacy and where the money goes. Trend lines of 8th grade NAEP math with Alabama highlighted.

Another southern miracle

Every so often someone discovers a miracle in a southern state. Back in February it was Mississippi. Now it’s Alabama, whose 4th graders gained 6.3 points in NAEP math from 2022 to 2024, against 2.4 points nationally. That gain is being held up as proof that “red state” reform (accountability, science of reading, numeracy coaches, and lately, school choice) is the model for everyone else.

So let’s look. I compare Alabama and Mississippi to Arizona and Florida, the two states that have gone furthest in dispersing public money to charters and private school vouchers, and benchmark all four against Massachusetts and New Jersey. My two points:

  1. There is no miracle in Alabama. In 8th grade, the better gauge of what a school system adds up to, Alabama is last among these six states in both math and reading, and still sliding.
  2. To the extent Alabama (and Mississippi) aren’t collapsing like Arizona and Florida, it’s less about what they did than what they didn’t do. They didn’t drive fiscal effort to the floor, didn’t build a parallel charter sector, and, until this year, didn’t send public money to private schools at scale. They kept investing in their public schools. Steadily, if not adequately.

No miracle in 8th grade

Alabama’s 8th graders scored 261.8 in NAEP math in 2024. That is essentially the score Alabama posted in 2003 (261.9). In reading, at 249.6, they’re below where they were in 2003 (253.2). Among these six states, Alabama is now last in both subjects.

As I said about Mississippi, 8th grade is a better indicator of the cumulative effect of a school system than 4th grade. A 4th grade bump can come from one well-targeted early-grades push. An 8th grade gain means the system is building on it.
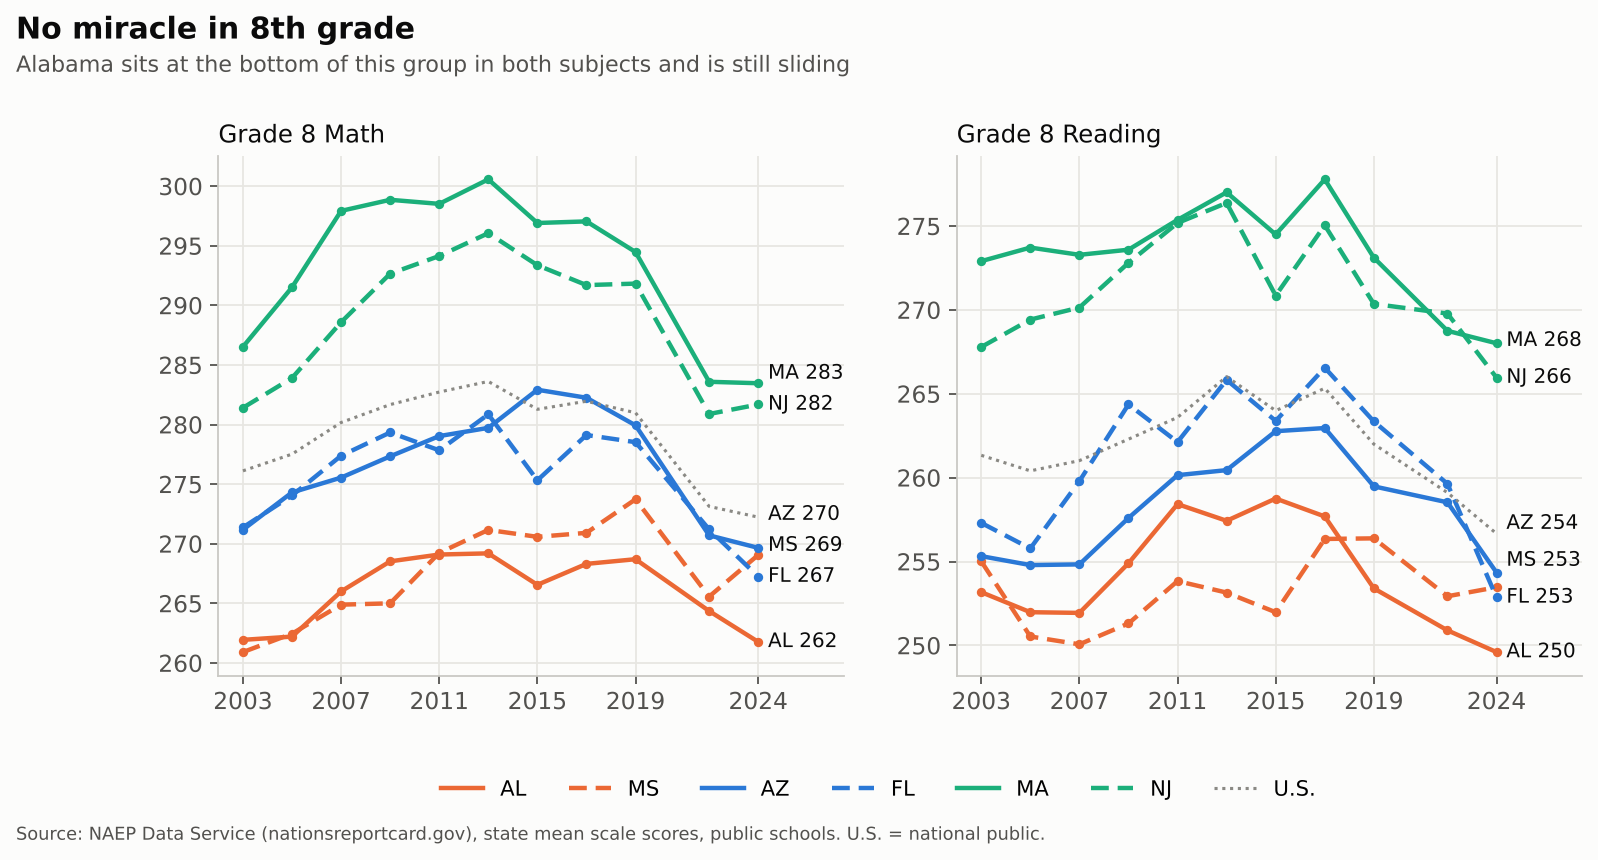
Line charts of grade 8 NAEP math and reading, 2003-2024, for Alabama, Mississippi, Arizona, Florida, Massachusetts and New Jersey.

The “miracle” lives entirely in 4th grade math. Alabama gained 6.3 points there from 2022 to 2024. Over the same two years, Alabama’s 8th graders lost 2.6 points in math. Since 2019, it’s +6.7 in 4th grade and −6.9 in 8th. If there’s a story here, it’s an early-numeracy push that hasn’t (yet) carried into the middle grades.
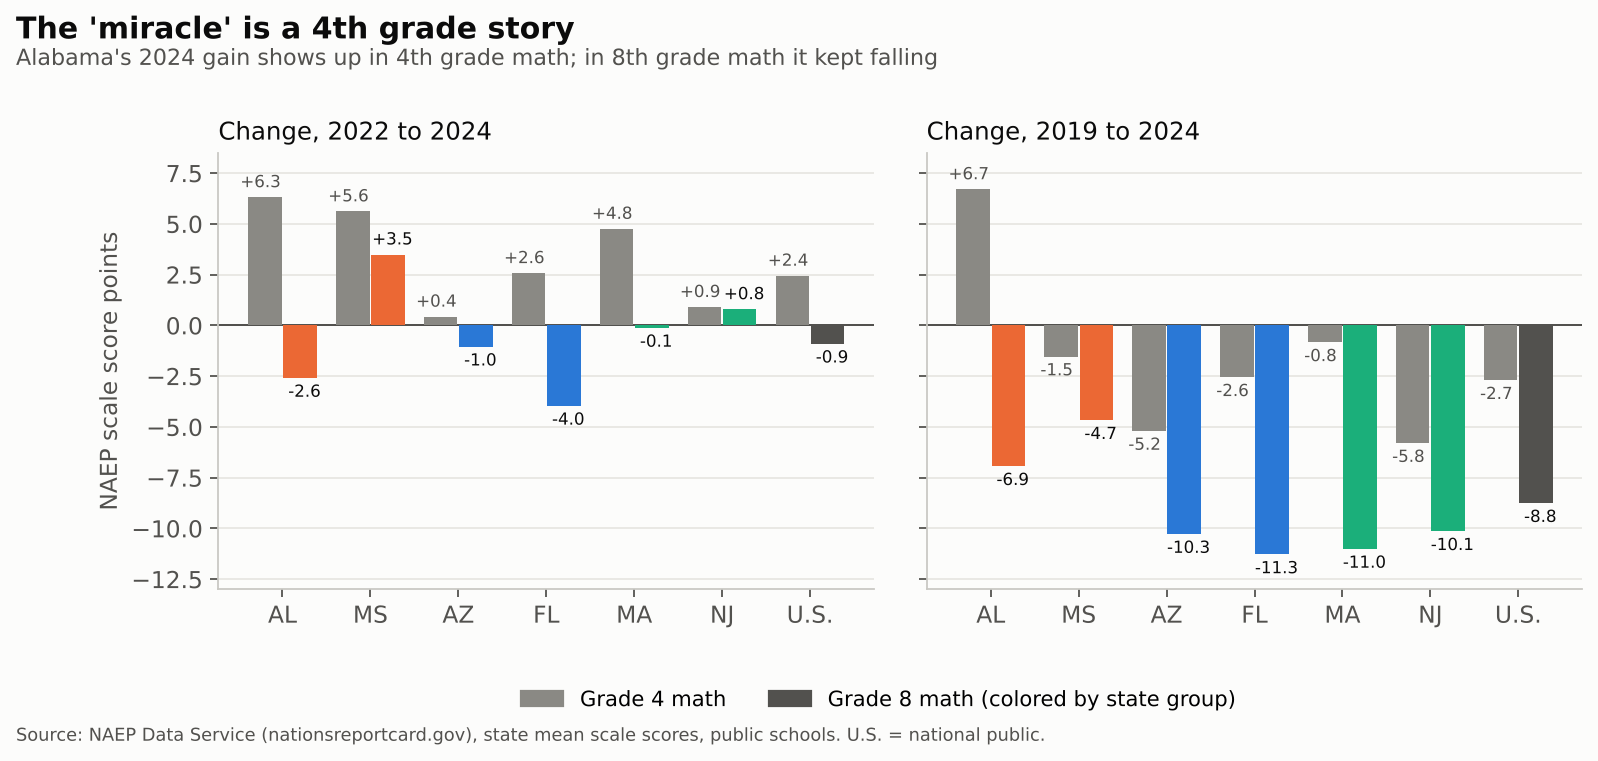
Bar charts of NAEP math changes in grade 4 and grade 8.

If anyone in this group has a claim to a rebound, it’s Mississippi, the only one of the six whose 8th grade math score rose meaningfully from 2022 to 2024 (+3.5). Even so, Mississippi doesn’t catch Massachusetts or New Jersey. Not even close. Both still sit 13 to 14 points above Mississippi in 8th grade math and 13 to 15 points above it in reading.

What Alabama and Mississippi didn’t do

Arizona and Florida have spent two decades building a second school system alongside the first. By 2024, 36 percent of Arizona’s public school students were in charter schools, and 14 percent of Florida’s. Alabama and Mississippi? Under 1 percent each. Even Massachusetts and New Jersey, hardly charter-averse, sit at 5 to 6 percent.
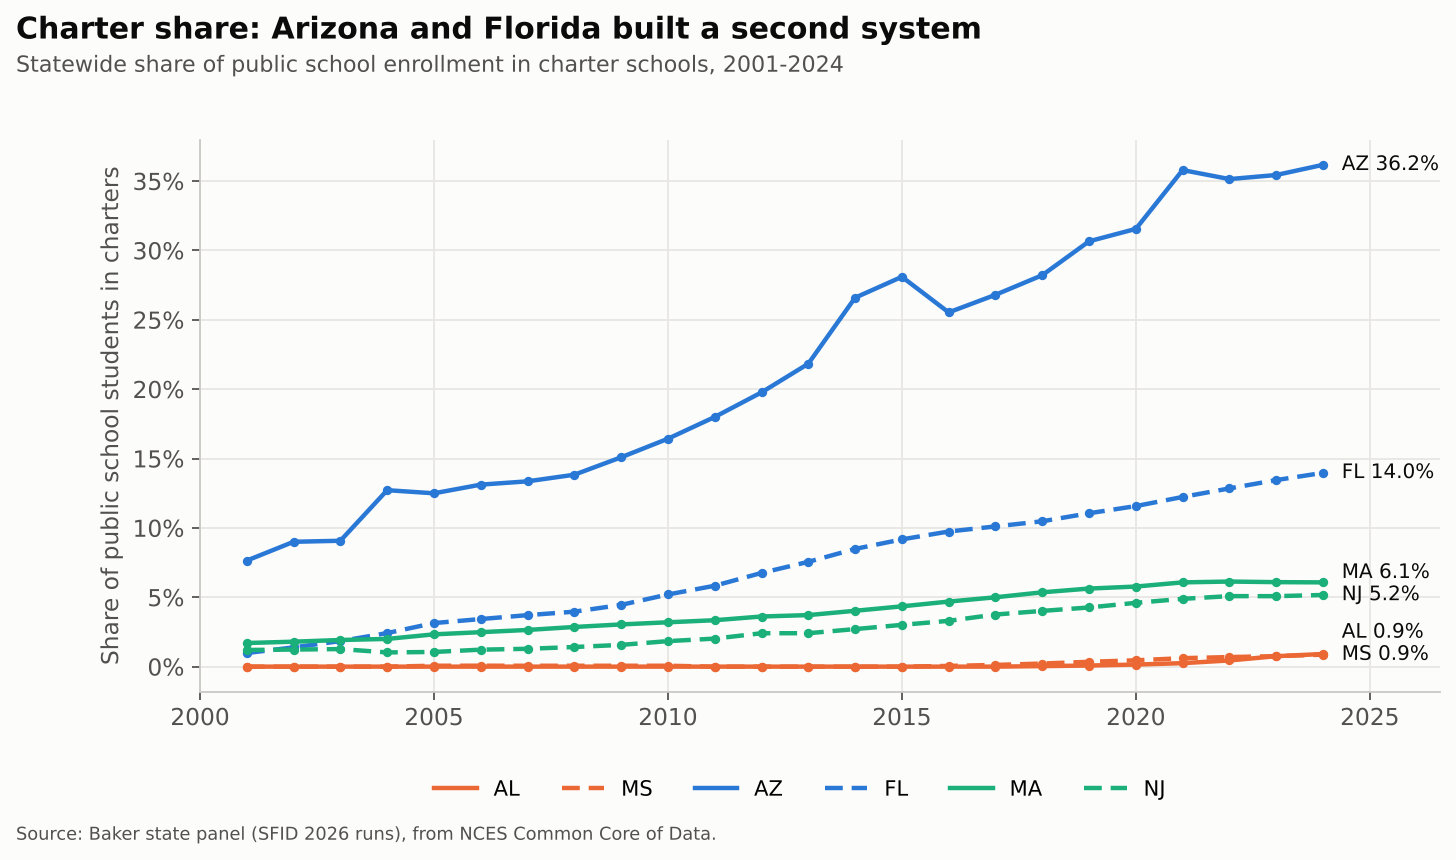
Charter share of public enrollment, 2001-2024.

Then there are vouchers, which in their current form are mostly education savings accounts (ESAs). Here the gap is even starker:

StateProgram(s)Students (est.)Public dollars (est.)
FloridaFES-EO, FES-UA, Tax Credit Scholarship~515,000 (2025-26)~$3.8 billion
ArizonaEmpowerment Scholarship Accounts (universal since 2022)100,000+ (early 2026)~$1 billion a year
AlabamaCHOOSE Act ESA (new in 2025-26)~23,600 approved in 2025-26; 34,000+ for 2026-27~$124 million; $174 million for 2026-27
MississippiSpecial-needs ESA, dyslexia and speech-language scholarships~600 (2024-25)small
Massachusettsnone00
New Jerseynone00

Florida figure: 432,581 FES scholarship FTEs estimated by the state for 2025-26 (EDR) plus 81,947 Tax Credit Scholarship students (EdChoice); dollars from the Florida Policy Institute via WUSF. Arizona: AZPBS. Alabama: Yellowhammer News and Decatur Daily. Mississippi: Empower Mississippi.

The point isn’t that every charter or voucher dollar is wasted. It’s that Arizona and Florida have been spreading roughly the same (shrinking, as we’ll see) public effort across more and more systems, with less and less accountability for where it lands. During the period over which Alabama’s and Mississippi’s 4th grade gains were built, neither state was doing that.

Effort: Arizona and Florida walked away

Fiscal effort, K-12 spending as a share of gross state product, tells you how much of its economic capacity a state chooses to put into its schools. Alabama spent 3.3 percent of GSP on K-12 in 2024, the same as in 2013 and a bit above the U.S. state average (3.1 percent). Arizona fell from 2.5 to 2.0 percent over those years, and Florida from 2.6 to 2.2 percent. Both now put in less than half of New Jersey’s effort (4.8 percent).
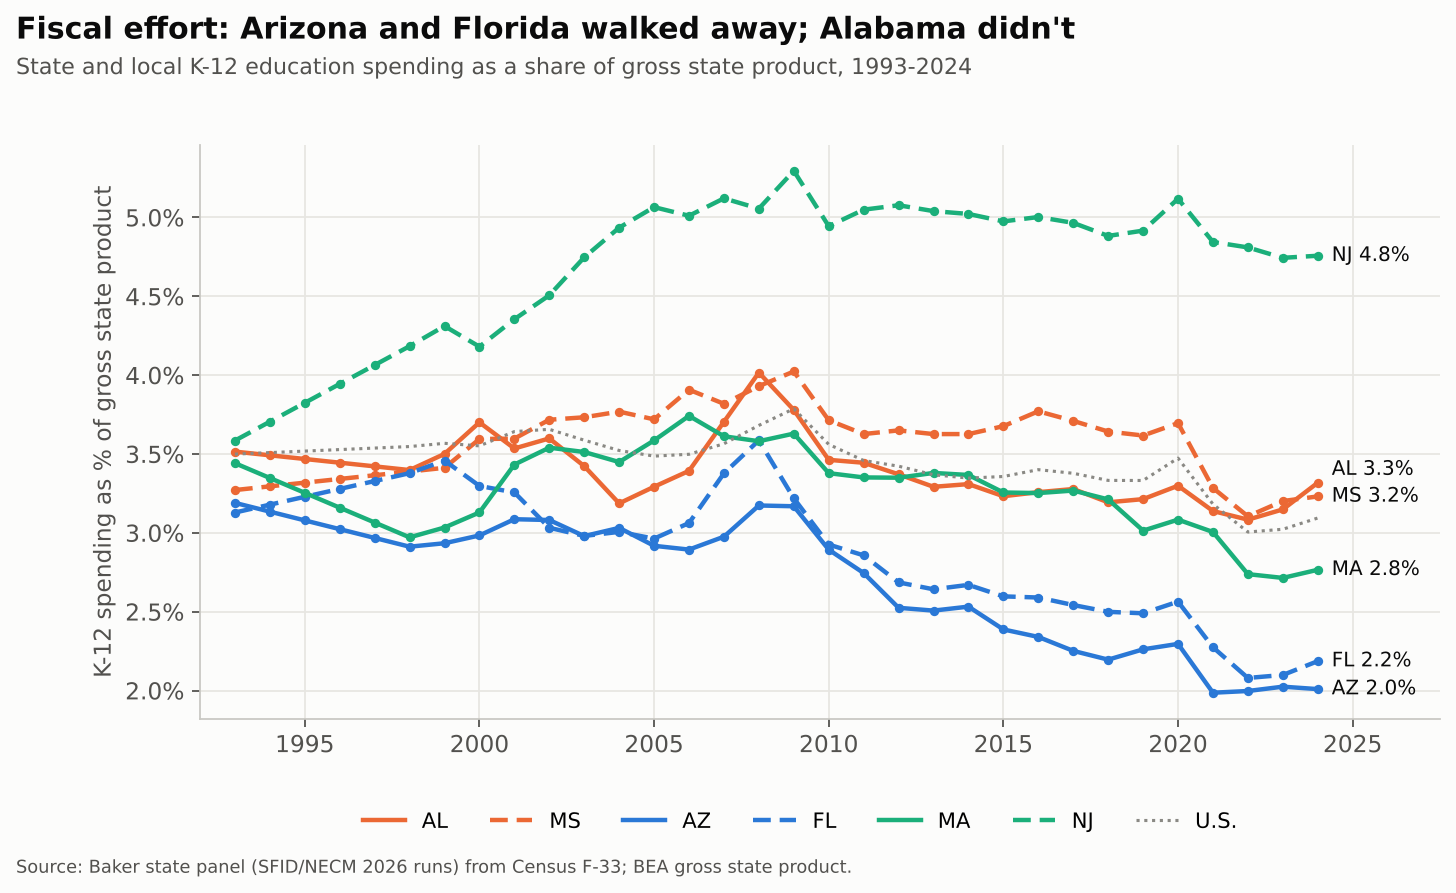
K-12 spending as a share of gross state product, 1993-2024.

Alabama isn’t a hero here. Its effort peaked at 4.0 percent in 2008 and took a big hit after the recession. Mississippi dropped from 3.7 to 3.1 percent between 2020 and 2022 (partly fast post-pandemic GSP growth, not only budget choices). But neither has ridden effort to the floor the way Arizona and Florida have.

Spending: the order flipped

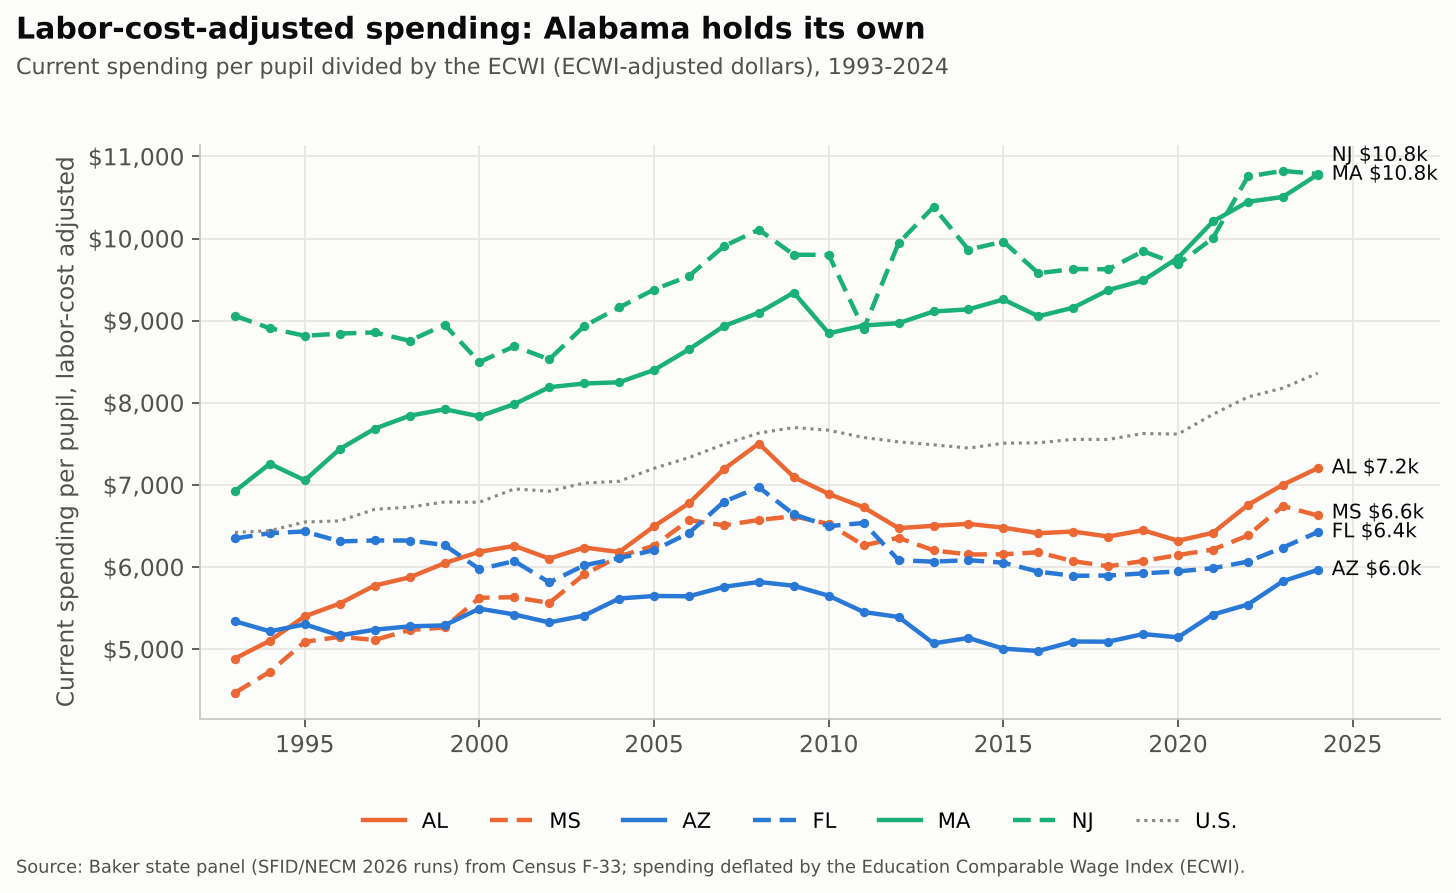
The result shows up in what schools actually have to spend. Adjusting for regional differences in labor costs (using the Education Comparable Wage Index), Alabama and Florida have traded places since the early 1990s. In 1993, Florida spent about $6,350 per pupil in labor-cost-adjusted dollars and Arizona about $5,340, both well ahead of Alabama ($4,890) and Mississippi ($4,470). By 2024:

  • Alabama: $7,204, up 47 percent since 1993
  • Mississippi: $6,627, up 48 percent
  • Florida: $6,425, up 1 percent, and still 8 percent below its 2008 level
  • Arizona: $5,965, up 12 percent
Labor-cost-adjusted spending per pupil, 1993-2024.

Massachusetts (up 56 percent, to $10,779) shows what sustained investment looks like at a higher level. Alabama and Mississippi are nowhere near that. But they’ve kept climbing while Arizona and Florida stalled.

Adequacy: steady isn’t the same as enough

Here’s where the “steady investment” story needs a caveat. Spending more than Arizona isn’t the same as spending enough. Our National Education Cost Model (NECM) estimates what each district would need to spend to reach national average outcomes, given its poverty, labor costs and size. Because Alabama’s children are poorer, its required spending is higher. So even though Alabama outspends Arizona and Florida, it’s further from adequate.

In 2024, Alabama districts spent 64 percent of what the NECM says they need, statewide. That’s third lowest among the 47 states we estimate, ahead of only Mississippi (51 percent) and Texas (59 percent). Arizona sits at 72 percent and Florida at 70. Massachusetts and New Jersey are well above adequate (132 and 136 percent). In Alabama’s highest-poverty districts, the figure is 44 percent.
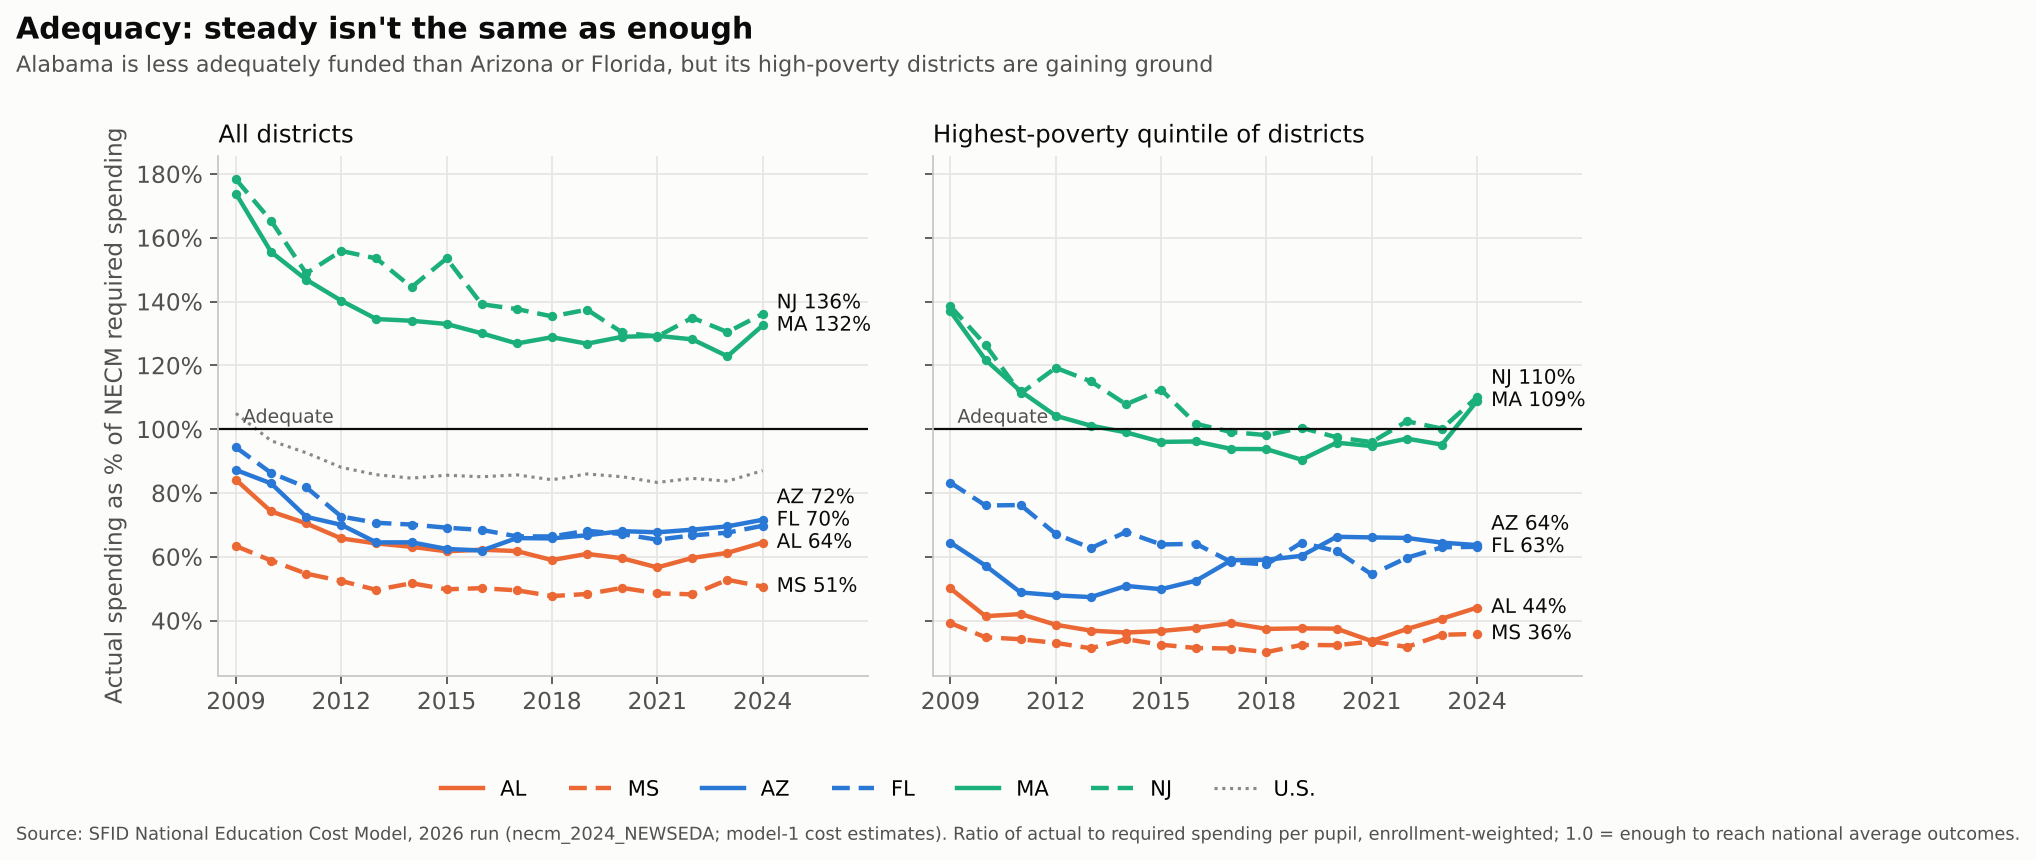
NECM adequacy ratios, all districts and highest-poverty districts, 2009-2024.

The encouraging part: Alabama’s high-poverty districts are gaining ground, from 34 percent of adequate in 2021 to 44 percent in 2024, and statewide from 57 to 64 percent. That’s the kind of sustained, if modest, investment that might eventually show up in 8th grade. It isn’t there yet.

Nearly every Alabama child (96 percent) attends a district funded below adequate levels, and about two thirds attend districts in the bottom fifth nationally. A state can hold effort steady and still leave its schools short. Alabama has.

Caveats, and how much they matter

A few things look, at first glance, like they cut against this story. Mostly they don’t.

First, NAEP gains and losses depend on where you start. Low-scoring states have more room to gain, and high-scoring states more room to fall. Across all 50 states, the correlation between a state’s starting score and its change is strongly negative over the long run: about −0.4 to −0.65 for 2013 to 2024, depending on grade and subject. It’s also negative for 4th grade math from 2022 to 2024 (−0.52). So part of Alabama’s 4th grade jump is what you’d expect from a low starting point. Adjusting for that, Alabama still beat expectations by about 3 points, fifth best in the country. Good, not miraculous.

The 2019 to 2024 drop in 8th grade is different. It hit high- and low-scoring states about equally (correlation near zero in math, −0.15 in reading). Here’s how each state did relative to what its 2019 level predicts:

StateGrade 8 math, actual changevs. expected (rank of 50)Grade 8 reading, actual changevs. expected (rank of 50)
Mississippi−4.7+4.0 (3rd)−2.9+2.2 (8th)
Alabama−6.9+1.8 (14th)−3.8+1.1 (20th)
Arizona−10.3−1.8 (35th)−5.1+0.2 (26th)
New Jersey−10.1−1.9 (37th)−4.4+1.8 (12th)
Florida−11.3−2.7 (41st)−10.5−4.9 (48th)
Massachusetts−11.0−2.8 (42nd)−5.1+1.3 (16th)

So, relative to where they started, Alabama and Mississippi held up better than most states, and Florida held up worse than almost anyone. That’s the “not collapsing” point, and it survives the adjustment.

Second, Massachusetts and New Jersey fell further than Alabama in 8th grade math since 2019. In raw points, yes. How much of that is about where they started depends on how you fit it. A straight line says both fell 2 to 3 points more than expected. Let the relationship bend (a lowess fit), and both land about where their starting level predicts (−0.4 each, 29th and 30th of 50). The ten highest-scoring states in 2019 fell 9.0 points on average; the ten lowest fell 8.0. Either way, these gaps are a point or two, about the size of NAEP’s margin of error for a single state. What holds under every specification: Florida near the bottom (41st to 43rd in math, 48th in reading) and Mississippi near the top (3rd or 4th in math).

Third, Alabama is still sliding in 8th grade math in the latest round, down 2.6 points from 2022 to 2024 while Arizona dipped 1.0. That’s one two-year interval, and Alabama’s longer-run, level-adjusted record is average (22nd of 50 for 2013 to 2024). Average is the point: there’s no miracle.

Finally, Alabama just started down Arizona’s road. The CHOOSE Act ESA launched in 2025-26 with about 23,600 approved students, roughly three quarters of them already in private school or homeschooling. For 2026-27, 34,000+ students are approved at $174 million, with $250 million appropriated. Mississippi’s House passed a universal ESA bill this year, 61-59, before the Senate Education Committee killed it.

Expected change in the table comes from a linear regression of each state’s change on its starting score across all 50 states (NAEP state means, public schools). Quadratic and cubic terms add little (R² rises by about one point; the squared term is not significant), but a lowess fit moves Massachusetts and New Jersey to about average.

So what’s the lesson?

There’s no miracle in Alabama. Its 8th graders score where they did two decades ago, it’s last of these six states in both subjects, and its schools remain among the least adequately funded in the country.

But there may be a lesson in the comparison. Over the past decade, Alabama held its fiscal effort and Mississippi kept its above the national average. Both have raised labor-cost-adjusted spending by roughly half since the early 1990s, and both kept their public dollars in their public schools. Arizona and Florida cut effort to among the lowest levels in the nation, stalled their spending, and spread what was left across district schools, charters and private school accounts. Florida in particular is now in free fall.

That’s not a causal analysis, but it’s more rigorous than most of the “miracle” talk I’ve seen. If the folks touting Alabama want to learn something from it, the lesson isn’t the CHOOSE Act. It’s the boring stuff Alabama did before the CHOOSE Act: keep funding your public schools, and keep funding them better, especially where kids are poorest. Now Alabama is about to find out what happens when it stops.

Data notes and sources

  • NAEP: state mean scale scores, public schools, from the NAEP Data Service, 2003-2024. “U.S.” is national public.
  • Fiscal effort, labor-cost-adjusted spending, charter share: my state panel built from the 2026 SFID runs (Census F-33, BEA gross state product, NCES Common Core of Data). Spending is current spending per pupil divided by the Education Comparable Wage Index. Public version: SFID State Indicators Database, 2026 release.
  • Adequacy: SFID National Education Cost Model, 2026 run with updated SEDA outcomes, extended through 2024 (model-1 cost estimates; districts under 100 students and outliers excluded; Alaska, Hawaii and Vermont not estimated). Ratios are enrollment-weighted actual over required spending; “bottom fifth” = the 20 percent of districts nationally furthest below adequate.
  • Vouchers/ESAs: see the links under the table above. Counts mix awards, participants and FTEs, so treat them as orders of magnitude.
  • Earlier post: On Miracles in Mississippi.
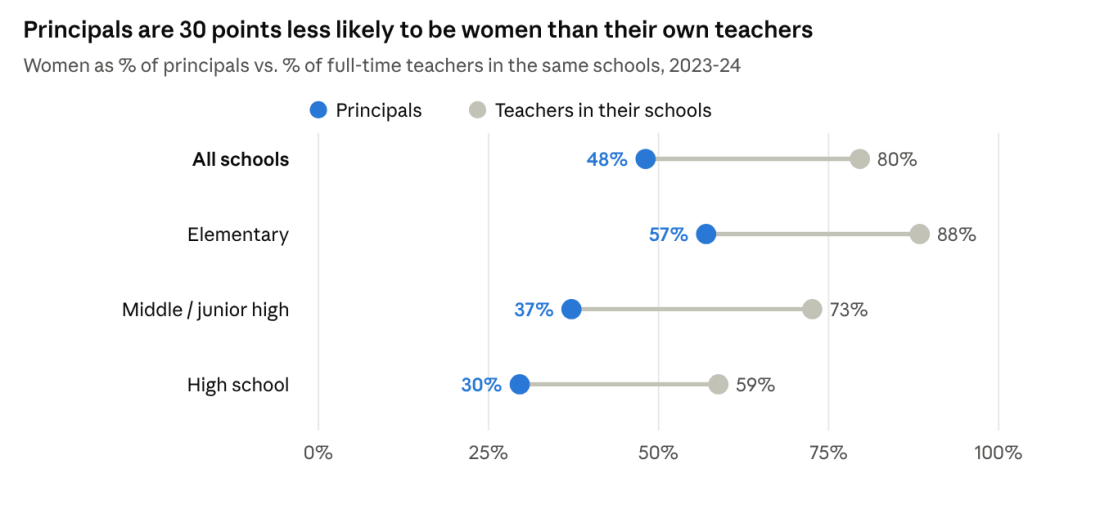
The Gender Pay Gap in New Jersey Schools Lives in the Principal’s Office

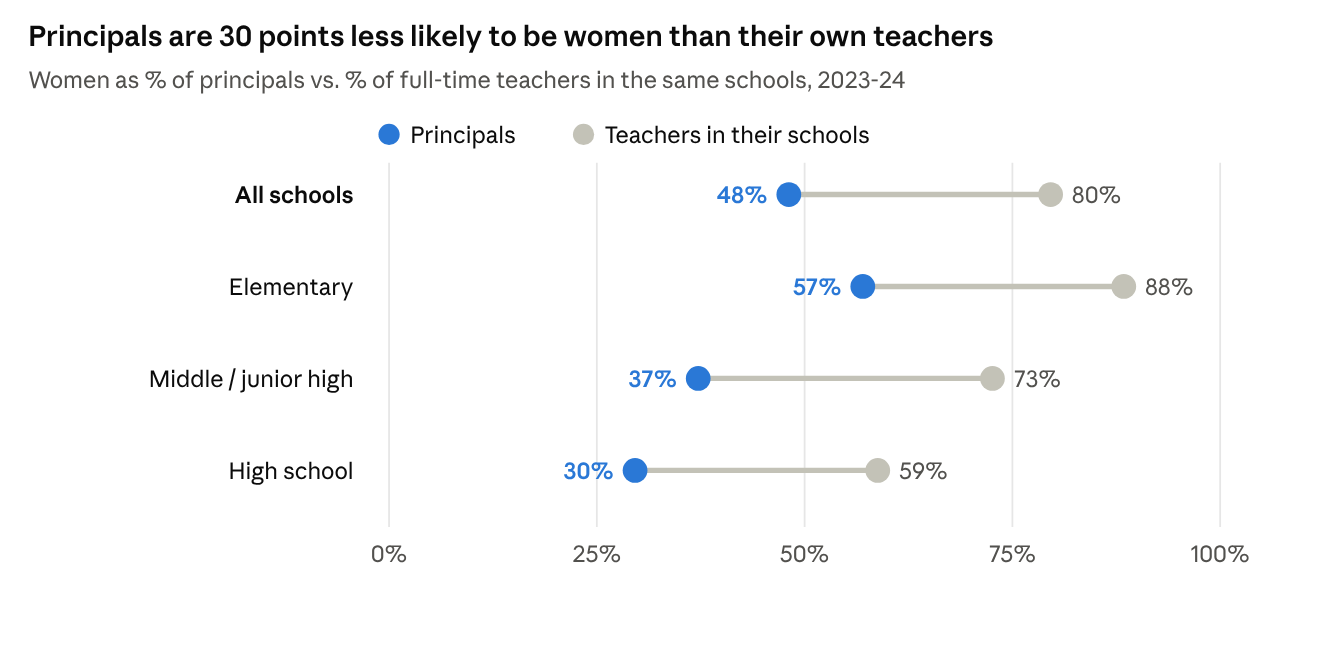
Dot chart: women are 48% of principals vs 80% of their teachers overall; elementary 57% vs 88%; middle 37% vs 73%; high school 30% vs 59%, 2023-24.

Teaching is a predominantly female profession. Nationally, 77% of public school teachers are women (NCES); in New Jersey, women hold 76% of full-time teaching jobs.

It is also an underpaid one. The Economic Policy Institute finds that teachers earned 25.2% less in weekly wages than comparable college-educated workers in 2025, up from 6.1% in 1996. Counting teachers’ better benefits, the penalty is still 14.5% (EPI). New Jersey does better than most states but not well: EPI puts its penalty at about 14%. School Finance Indicators Database estimates found New Jersey teachers earning 15.9% less than similarly educated non-teachers of the same age (SFID via NJPP; Shanker Institute). A mostly female profession paid well below its peers is already a gender pay story.

Within teaching, though, it would at least seem that there should be no gender pay gap. Public school salaries are set by negotiated guides: a step for each year of experience, a column for each degree, the same scale for everyone in the district. A woman and a man with the same degree and years should earn the same.

The data tell a few different stories. I looked at every full-time certificated employee in New Jersey from 2017-18 through 2023-24, more than 800,000 person-years of salary records.

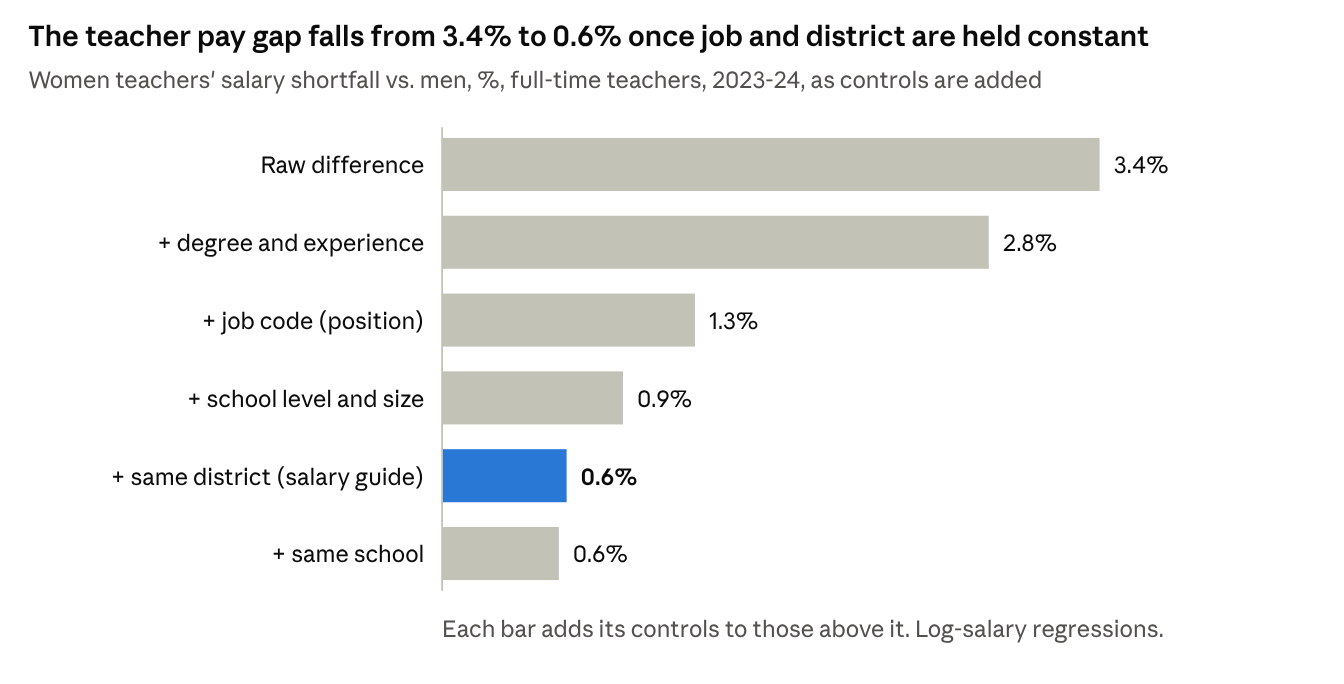
  1. The pay gap does exist. In 2023-24 the typical woman teacher earned $79,069 and the typical man $83,510, about 95 cents on the dollar. Even among teachers in the same district with the same degree, experience and assignment, women earn about 0.6% less.
  2. It is bigger for principals. The typical woman principal earned $145,500, against $155,567 for men. Within the same district, at the same school level and size, women principals earn 3.3% less, about five times the teacher gap. Among high school principals the median gap is $20,496.
  3. Women tend to be in the lower-paying jobs and settings, even within K-12 schooling. Elementary-only districts are 86% women and pay about 6% below average for the same credentials. Principals are 30 points less likely to be women than the teachers in their own schools, and men principals are twice as likely to lead a high school.

The common thread: where pay follows a published rule, the gap nearly disappears. It persists where pay is negotiated person by person, and where women and men end up in different districts and different jobs.

Teachers: the salary guide does its job

Most of the teacher gap comes from who teaches what, and where. Men are concentrated in high schools, in larger schools, and in fields such as science, industrial arts, vocational education and social studies, and those settings pay more. Hold job code, school level and size, and district constant, and the gap all but disappears.

Bar chart: women teachers' pay shortfall falls from 3.4% raw to 2.8% with degree and experience, 1.3% with job code, 0.9% with school level and size, 0.6% within district and 0.6% within school, 2023-24.
Source: NJDOE certificated staff file, 2023-24; 93,263 full-time teachers with name-classified gender.

Within the same district, a woman teacher with the same degree, experience and assignment as a man earns about 0.6% less, roughly $520 a year. In elementary and middle schools it is 0.2–0.3%, and for teachers with 25 or more years’ experience it is essentially zero.

What is left is mostly money outside the guide. In 2022-23 and 2023-24, men teachers’ supplements, such as coaching and club stipends, averaged $1,460 against $814 for women. Measured on base salary alone, the within-district gap shrinks from 0.71% to 0.39%.

Principals: the gap the guide doesn’t reach

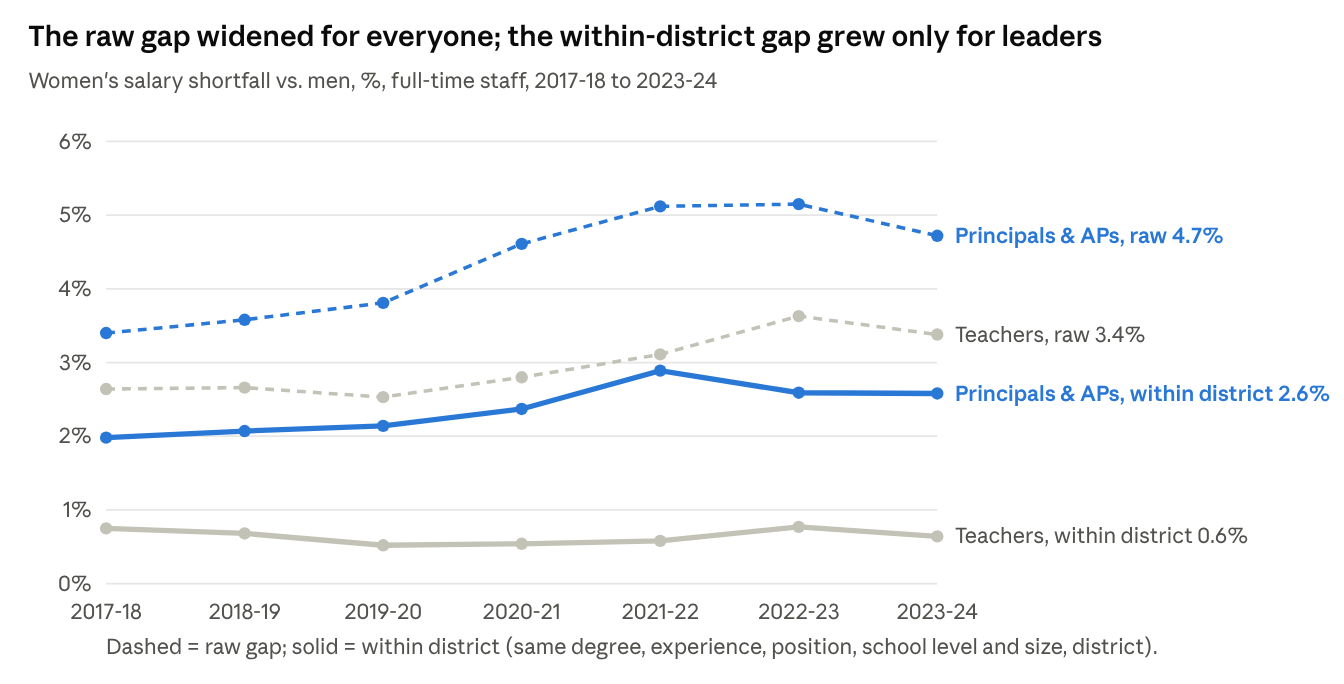
Principals are a different story. In 2023-24, women principals earned 3.3% less than men in the same district, at the same school level and size, with the same degree and experience. That is roughly $4,800 a year, about five times the teacher gap. Assistant principals show about 2%. Superintendents show about 2% after accounting for district enrollment.

The gap does not depend on what kind of school a principal leads: it is 2.6% in elementary schools, 2.3% in middle schools and 3.0% in high schools. It does grow with seniority, from 2.0% for principals with under 15 years of experience to 3.2% for those with 25 or more. That is what we would expect if pay is negotiated contract by contract and differences compound over a career.

Line chart, 2017-18 to 2023-24: raw gap for principals and APs rose from 3.4% to 4.7%, within-district from 2.0% to 2.6%; teachers raw from 2.6% to 3.4%, within-district flat at 0.5-0.8%.
Source: NJDOE certificated staff files, 2017-18 to 2023-24; log-salary regressions by year.

The trend makes the contrast plain. Raw gaps widened for teachers and leaders alike between 2018 and 2024. For teachers, the gap within the same district held at 0.5–0.8% every year. For principals and assistant principals it grew, from 2.0% to 2.6%.

Representation compounds the problem. Women are 76% of New Jersey’s teachers but 48% of its principals, 37% of its superintendents and 31% of its high school principals, the best-paid principal jobs.

Who works where

Much of the raw gap comes from structure rather than from different pay for the same post. Three patterns stand out.

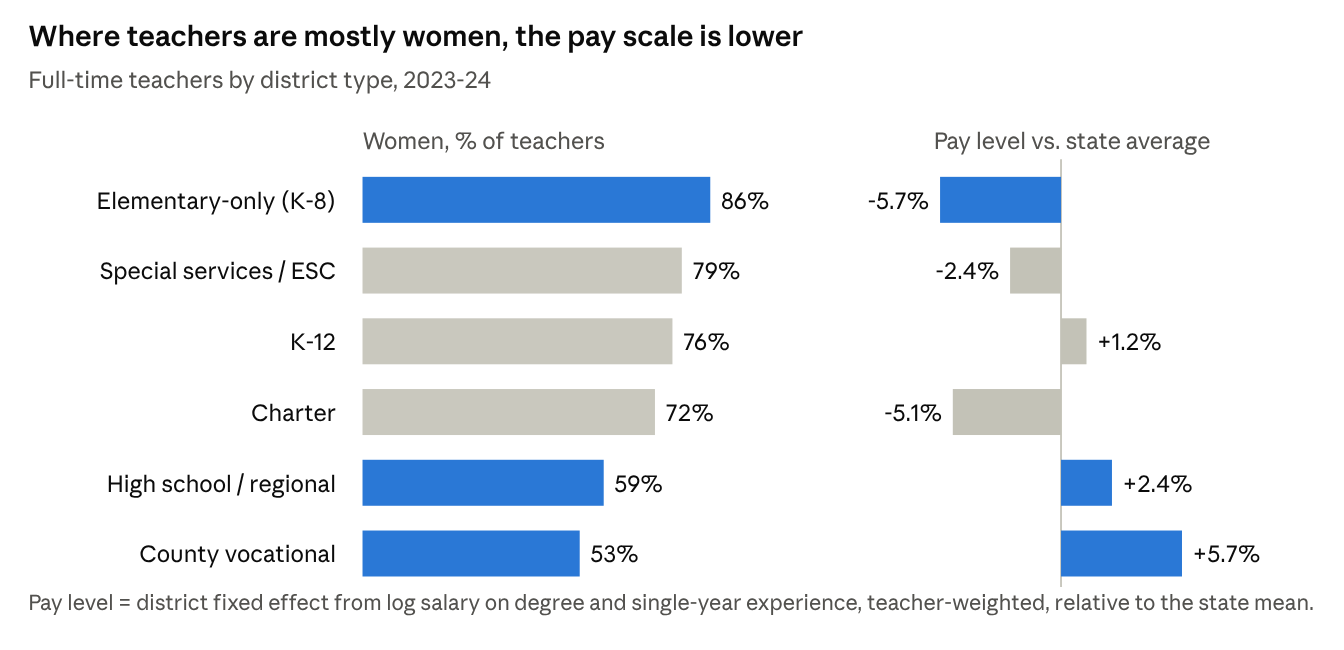
Different districts, different staffs, different guides. New Jersey still runs hundreds of elementary-only (K-8) districts alongside regional high school and county vocational districts. The elementary districts are 86% women and pay about 6% below the state average for the same degree and experience. Regional high school districts (59% women) and county vocational districts (53% women) pay 2–6% above it.

Chart by district type: elementary-only 86% women, pay 5.7% below state average; special services 79%, -2.4%; K-12 76%, +1.2%; charter 72%, -5.1%; high school/regional 59%, +2.4%; county vocational 53%, +5.7%.
Source: NJDOE certificated staff and enrollment files, 2023-24. Pay level = district effect on log salary net of degree and experience.

Men teachers are more likely to work under those higher guides. 8.0% of men teachers work in regional high school districts, against 3.6% of women, and 4.9% of men work in county vocational districts, against 1.7% of women. Nearly one in five women teachers (18.5%) works in an elementary-only district, against one in ten men.

This is not just a difference in job mix. Comparing teachers in the same job code, elementary-only districts still pay 5.1% below average, while regional high school districts pay 0.7% above and vocational districts 2.2% above. District by district the pattern holds: each 10 points more women on a teaching staff goes with a pay scale about 3.5% lower. Which district a teacher works in accounts for about 23% of the raw teacher gap.

Principals don’t look like their staffs. In 2023-24, 48% of principals were women, compared with 80% of the teachers in their own schools. The shortfall is about 30 points at every level: elementary principals are 57% women against 88% of their teachers, and high school principals 30% against 59%. Even in schools where 90% or more of the teachers are women, only 56% of principals were women between 2018 and 2024. If principals mirrored their own schools’ teachers, roughly 620 more women would have been principals in 2023-24. Assistant principals come closer, at 50% women against 70% of their teachers.

Dot chart: women are 48% of principals vs 80% of their teachers overall; elementary 57% vs 88%; middle 37% vs 73%; high school 30% vs 59%, 2023-24.
Source: NJDOE certificated staff files, 2023-24; 1,967 principals matched to schools with 10+ classified full-time teachers.

Men lead the high schools. A quarter of men principals lead high schools, against an eighth of women; 71% of women principals lead elementary schools, against half of men. In regional high school districts, 7 of 50 high school principals are women.

Principals, 2023-24MenWomen
Share leading high schools25%12%
Median salary, elementary$152,230$145,481
Median salary, high school$169,096$148,600

The high school premium goes mostly to men. Men high school principals earn $16,867 more at the median than men elementary principals; for women the difference is $3,120. Women who lead high schools tend to run smaller ones (median enrollment 735 vs. 1,022), and more often in charters and lower-paying districts. Inside the same district, women high school principals earn about 3% less than men, about the same as at other levels.

Putting it together: for teachers, school level, job, school size and district explain about 60% of the raw gap. Experience explains most of the rest, and about a fifth is left unexplained. For principals, school level explains about a fifth and district and school size about a third. Half the principal gap remains unexplained, among people in the same district, at the same level, leading schools of the same size.

The full policy brief, with data and methods, detailed tables, robustness checks and policy recommendations, is available as a PDF:

Abbott Elementary Is Entertaining. The Damage Is Real.

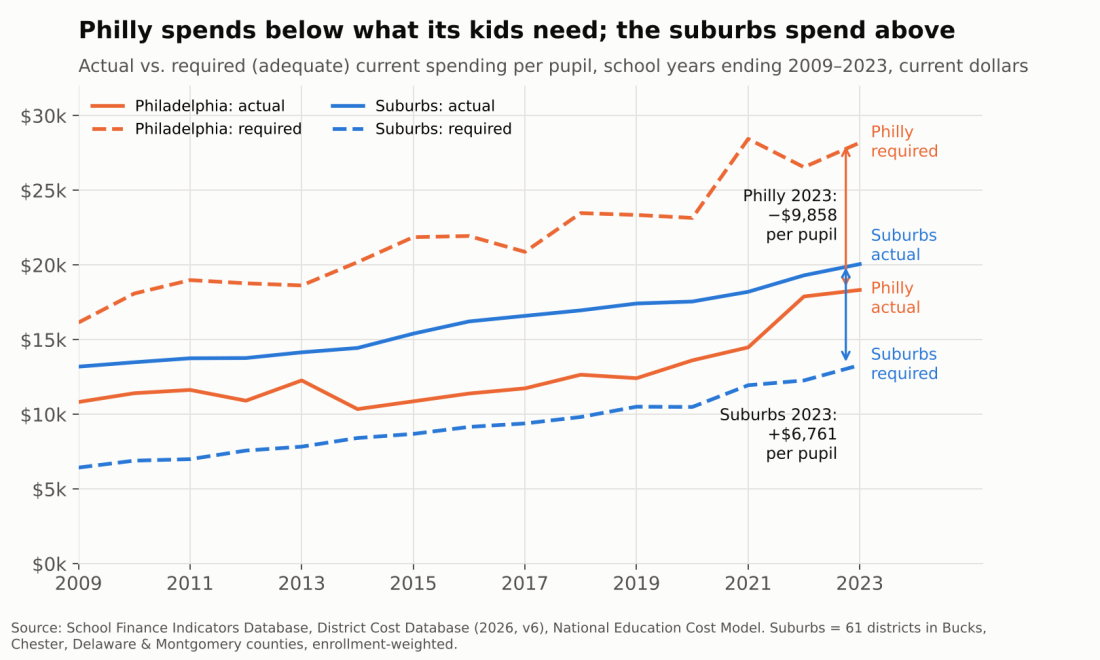
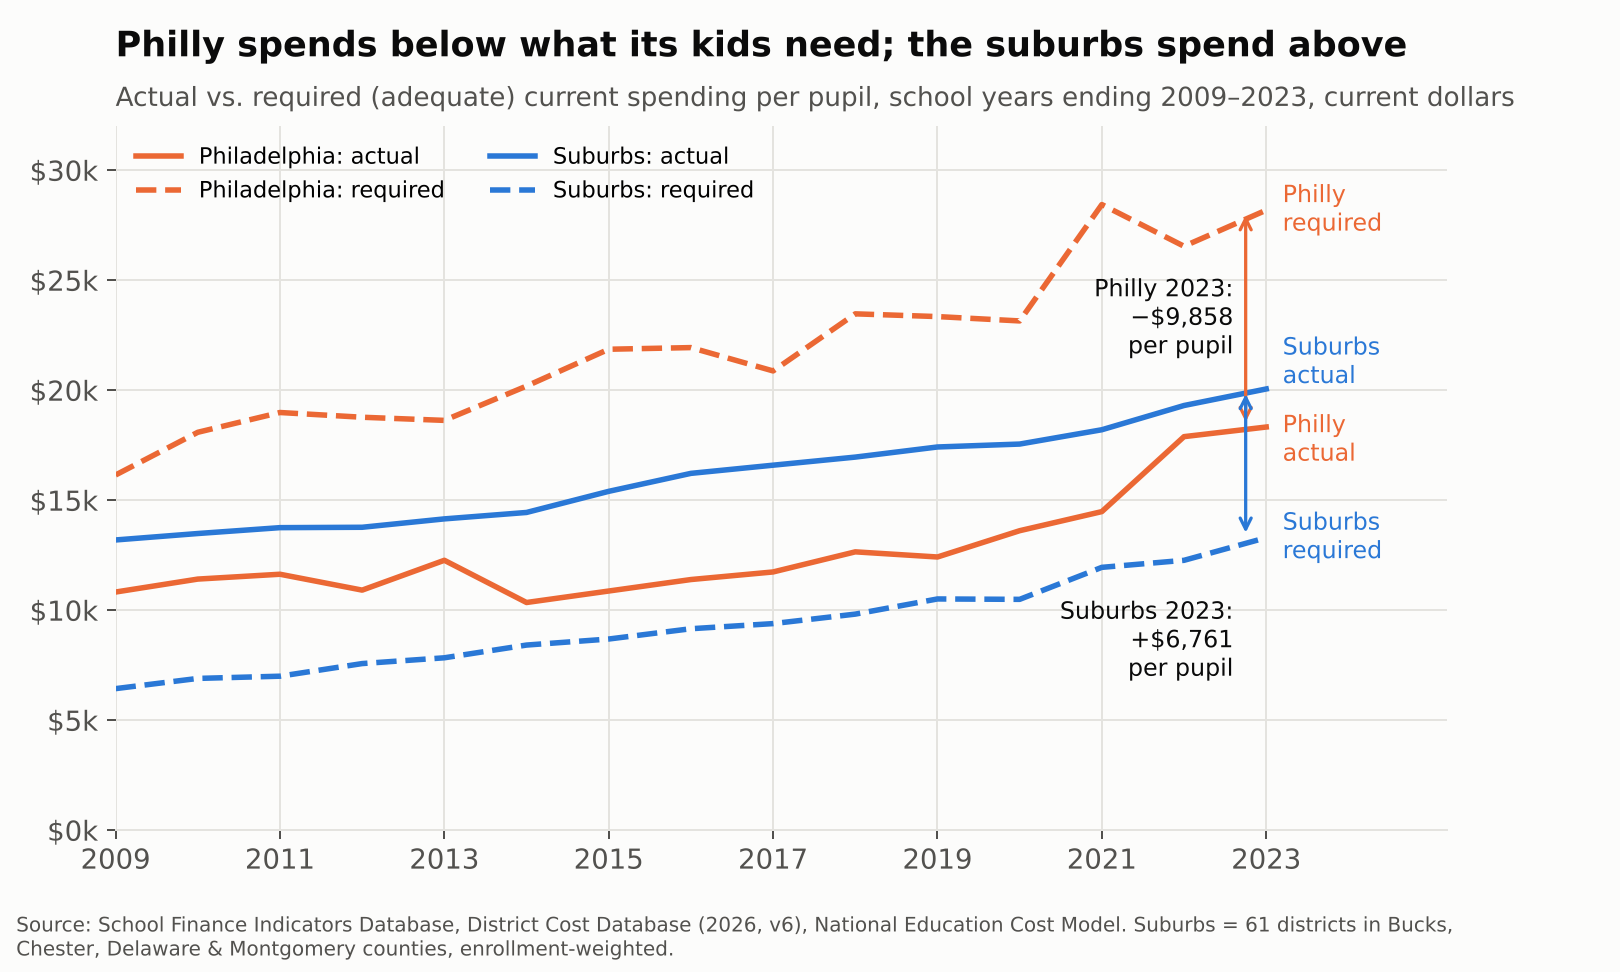
Actual vs. required spending per pupil, Philadelphia and suburbs, 2009–2023

Abbott Elementary plays it for laughs. Janine Teagues hunts for a working rug, a functioning copier, a single extra aide. Barbara Howard has seen every reform come and go. Gregory Eddie inherits a classroom with no curriculum. Melissa Schemmenti knows a guy who can get the supplies the district can’t.

The show is entertaining. The damage is real. Behind every running gag is a funding gap that has been measurable, year after year, for at least fifteen years, and that has landed on real children in real Philadelphia classrooms.

Philadelphia’s district schools have spent between a third and a half less than what it would cost to get their students to national-average outcomes in every year from 2009 to 2023. Over the same years, the 61 suburban districts in Bucks, Chester, Delaware and Montgomery counties spent between half again and twice what their own students needed. We laugh at the broken boilers, missing counselors and teachers buying their own supplies. The kids living it don’t get a laugh track.

What follows walks from the money to the classroom: first the adequacy gap, then the simple “screwed city” picture, then teachers per child, teacher pay, and finally who is actually standing in front of the kids.

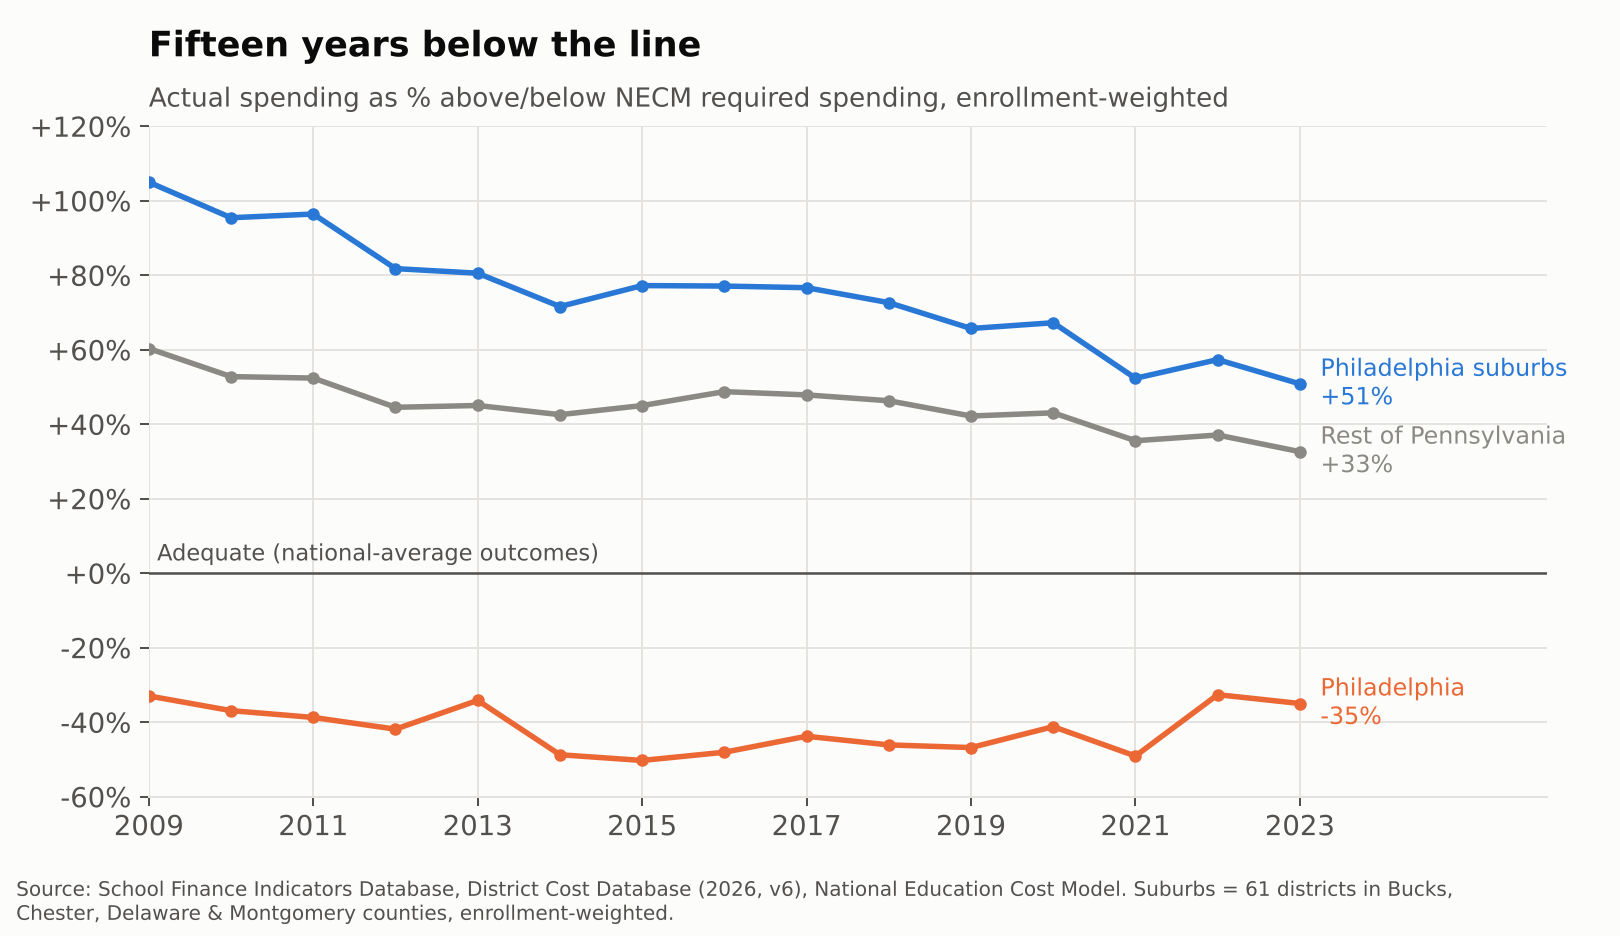
Fifteen years below the line

In 2022-23, the School District of Philadelphia spent $18,329 per pupil. Our National Education Cost Model estimates it would have needed $28,187 to give its students a shot at national-average test scores. That is a gap of $9,858 per child, or roughly $1.2 billion across 118,000 students, in a single year.

The suburbs face the mirror image. Their enrollment-weighted average spending was $20,059 against a required $13,298, a surplus of $6,761 per child. Same metro, same labor market, same state constitution.

Actual vs. required spending per pupil, Philadelphia and suburbs, 2009–2023

This is not a recent dip. Philadelphia sat 33% below its adequacy target in 2009, sank to 50% below in 2015 in the wake of the “doomsday” budgets, and was still 35% short in 2023, even with federal pandemic aid in the mix. The suburbs started out spending more than double their target and have drifted down to about 51% above it. The rest of Pennsylvania sits in between, about a third above.

Percent above or below adequacy, Philadelphia, suburbs, and rest of Pennsylvania

The outcome side tells the same story. Philadelphia’s students scored roughly 0.8 standard deviations below the national average in 2022-23, while suburban students scored about 0.2 above. Abbott’s students are not falling short because nobody cares. They are falling short where the money falls short.

The simple version: a “screwed city”

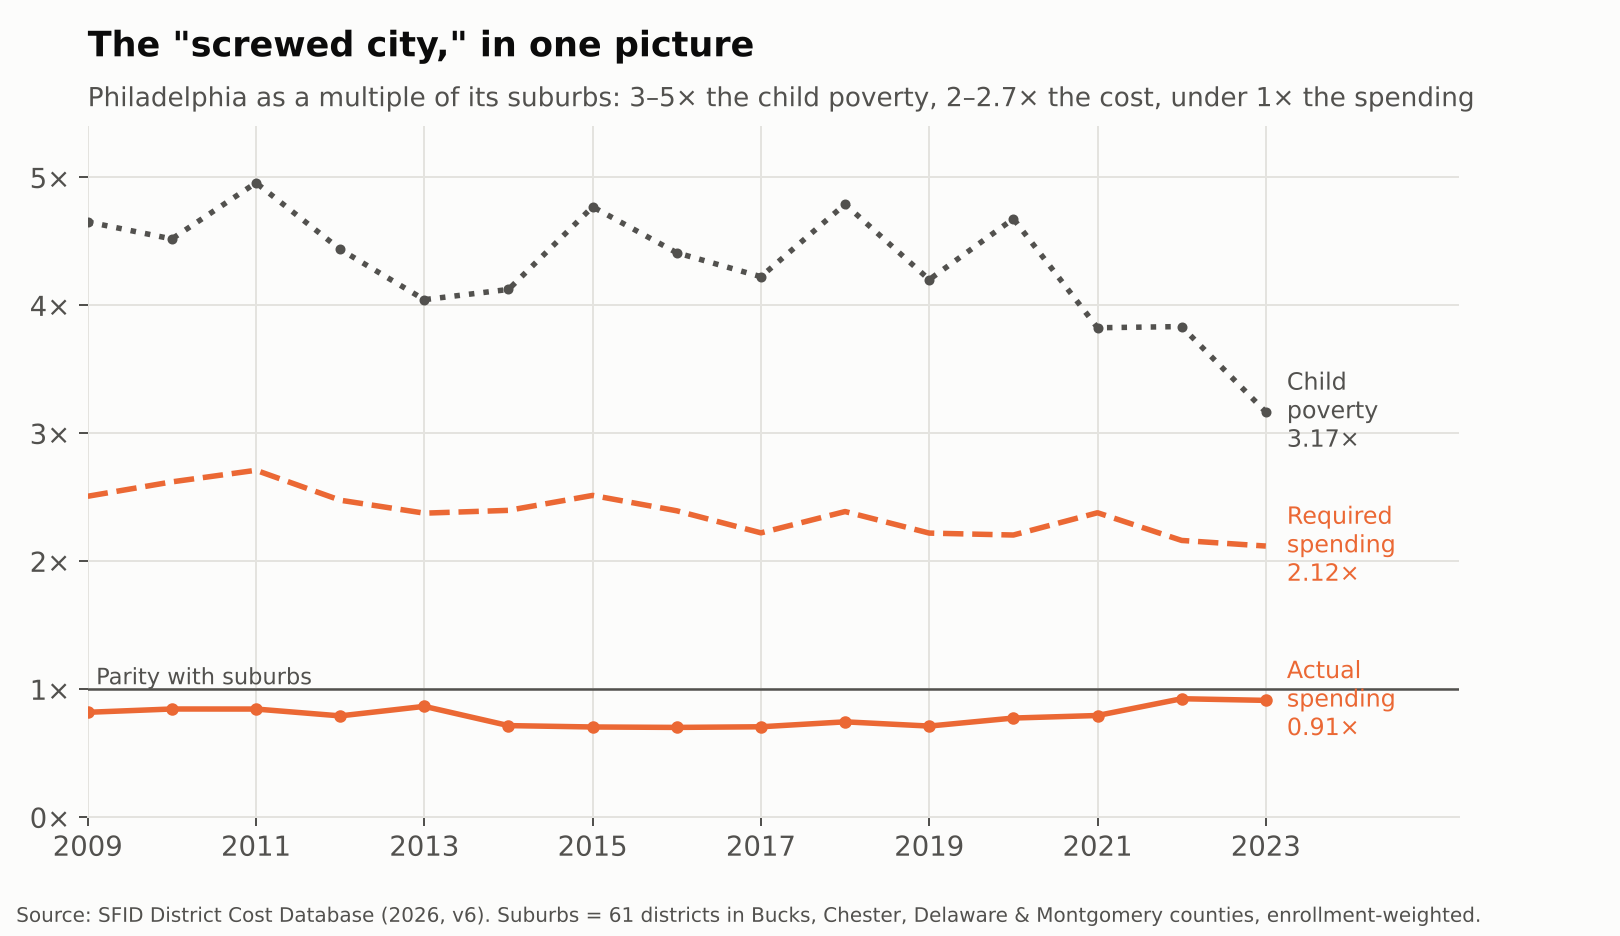
You don’t need a cost model to see the problem. Divide Philadelphia by its suburbs. In 2022-23, the city had 3.2 times the suburban child poverty rate. Under the NECM, that translates into 2.1 times the cost of reaching national-average outcomes. And the city spent 0.91 times what the suburbs spent.

Philadelphia as a multiple of its suburbs: poverty, required spending, actual spending

That pattern has held every year since 2009. Philly’s poverty rate has run 3 to 5 times the suburban rate, its costs 2 to 2.7 times, and its spending has never once caught up to the suburbs, let alone exceeded them.

That is what it means to be a screwed city. Not just underfunded relative to need, but outspent outright by the comfortable districts a short SEPTA ride away.

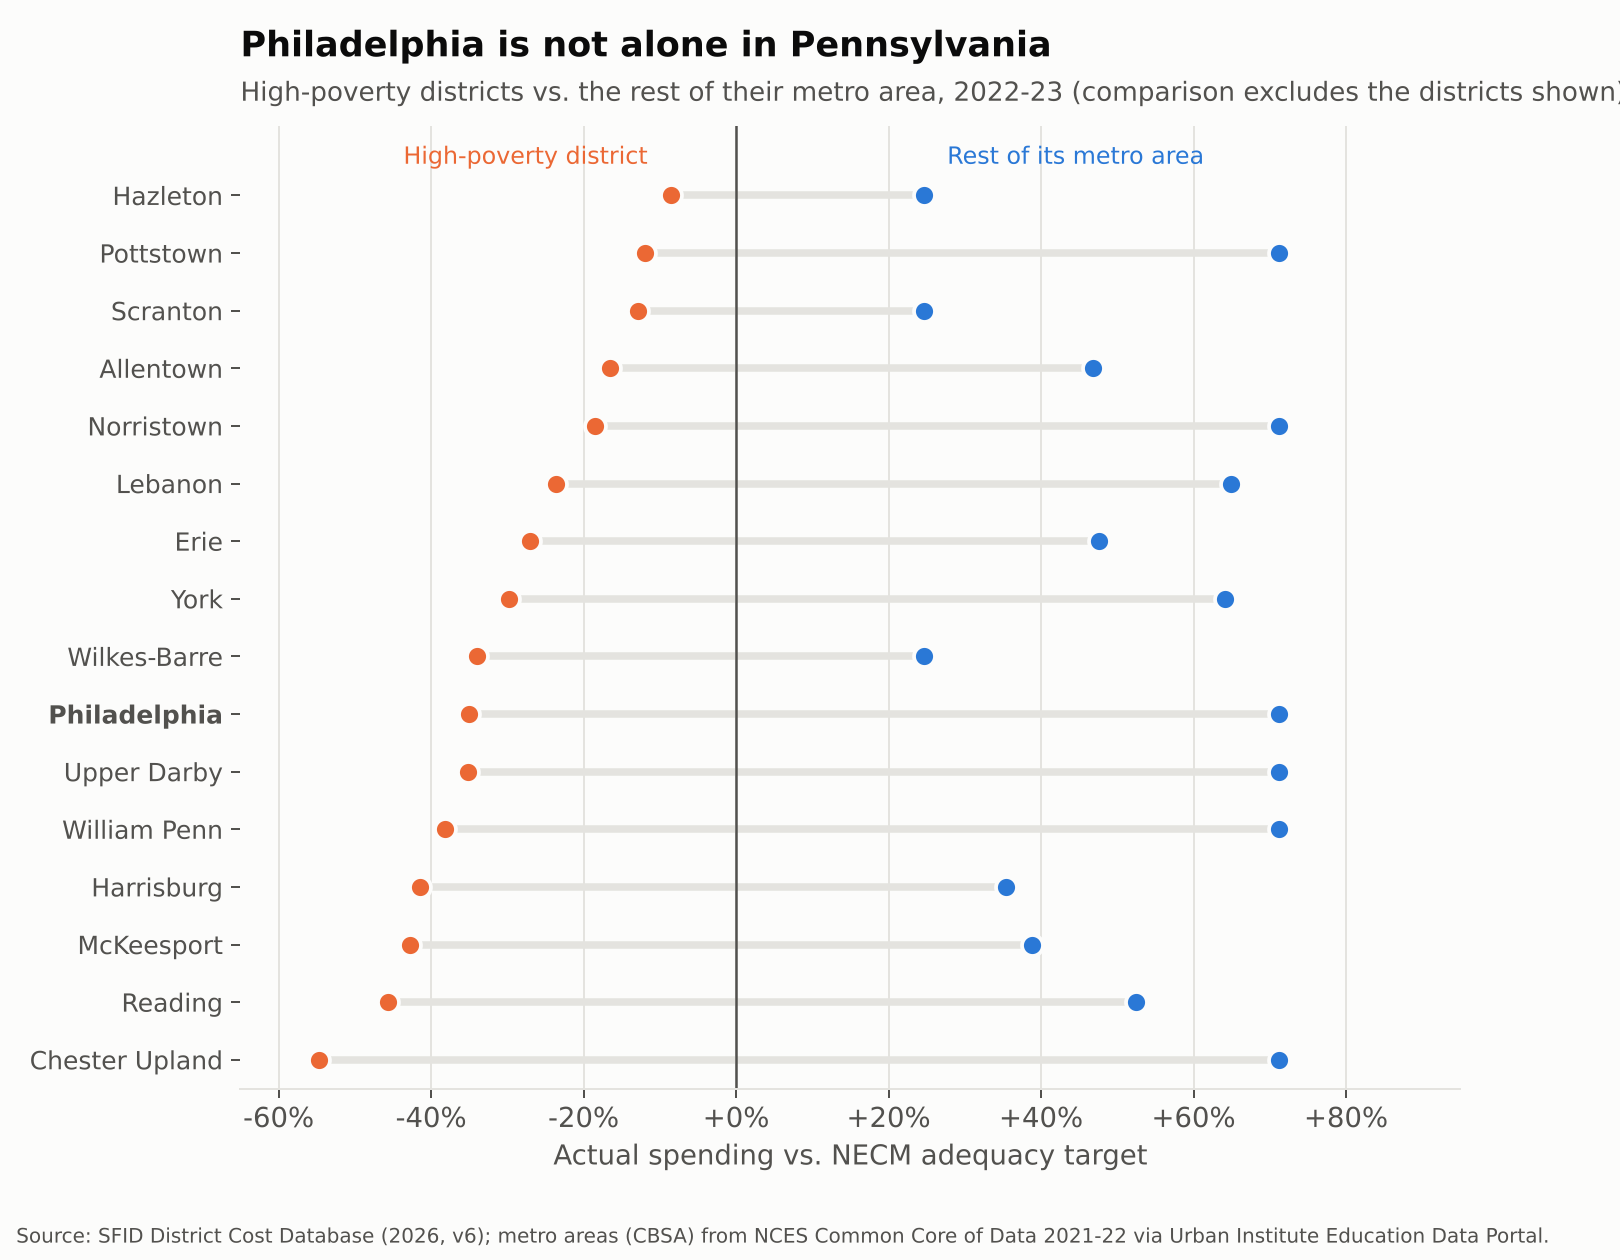
Even in Pennsylvania, Philadelphia is not alone

Philadelphia is the biggest case, not the only one. Reading spent 46% below its adequacy target in 2022-23, while the rest of the Reading metro spent 53% above. Allentown was 17% short while its Lehigh Valley neighbors were 47% over. Harrisburg, York, Lebanon, Erie, Wilkes-Barre and Chester Upland tell the same story.

High-poverty Pennsylvania districts vs. the rest of their metro areas, percent above or below adequacy

The pattern reaches into Philly’s own suburbs. Chester Upland, Upper Darby, William Penn, Norristown and Pottstown are all below adequacy, surrounded by districts in the same four counties that spend about 71% above theirs.

Across the state, 56 of 497 districts spent below their adequacy targets in 2022-23. They enroll 23% of Pennsylvania’s students, but 67% of its Black students and 49% of its Hispanic students, compared to 8% of its white students. Philadelphia accounts for about a third of the students in those districts. Fixing Philly alone would not fix Pennsylvania.

This is the system the Commonwealth Court found unconstitutional in William Penn School District v. Pennsylvania Department of Education in February 2023. The state has since begun phasing in adequacy aid, including $565 million statewide in the 2025-26 budget (WHYY). The gaps above are what that aid is chasing.

From dollars to classrooms: fewer adults per child

School money is mostly people. When a district is short a third of what it needs, the shortfall shows up as fewer teachers, larger classes and missing specialists.

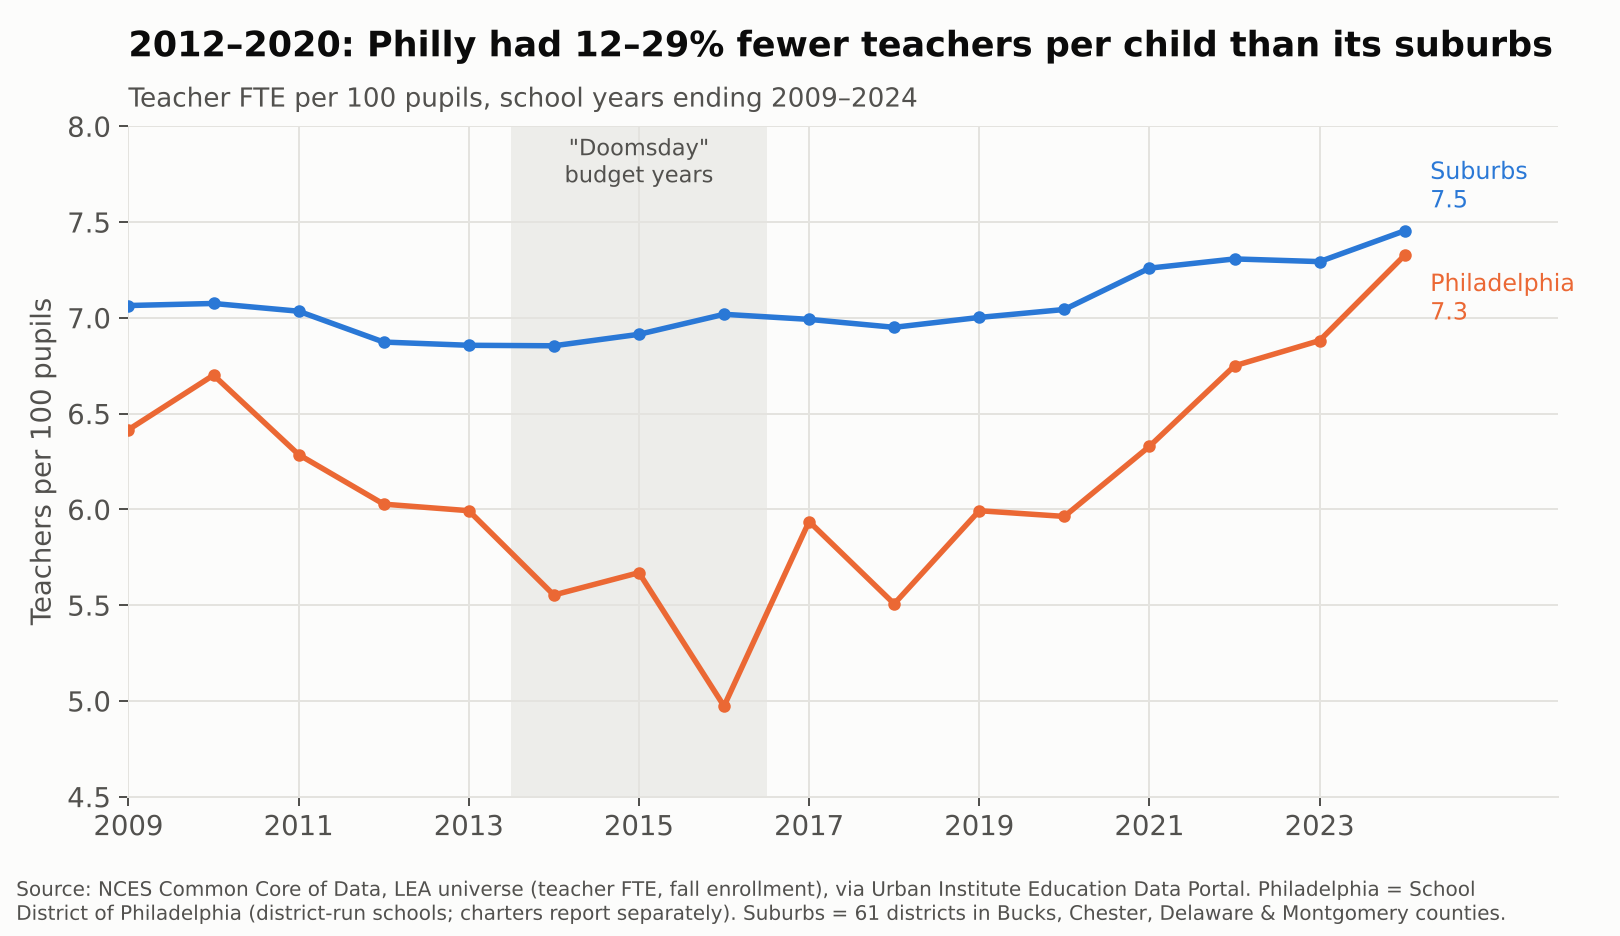
Philadelphia reported 11,103 teachers in 2009-10. By 2013-14 it had 7,645, a 31% cut, while enrollment fell only 17%. From 2012 through 2020, the district ran between 12% and 29% fewer teachers per 100 pupils than its suburbs. That is Gregory Eddie’s world: a full roster of kids, and not enough colleagues to share them with.

Teachers per 100 pupils, Philadelphia vs. suburbs, 2009–2024

The gap has nearly closed since 2021, to 7.3 teachers per 100 pupils in Philadelphia vs. 7.5 in the suburbs in 2023-24, helped by federal pandemic aid and new state money. But parity is not adequacy. A district whose students cost twice as much to serve, by the NECM’s estimate, does not get there with the same staffing ratio as Lower Merion.

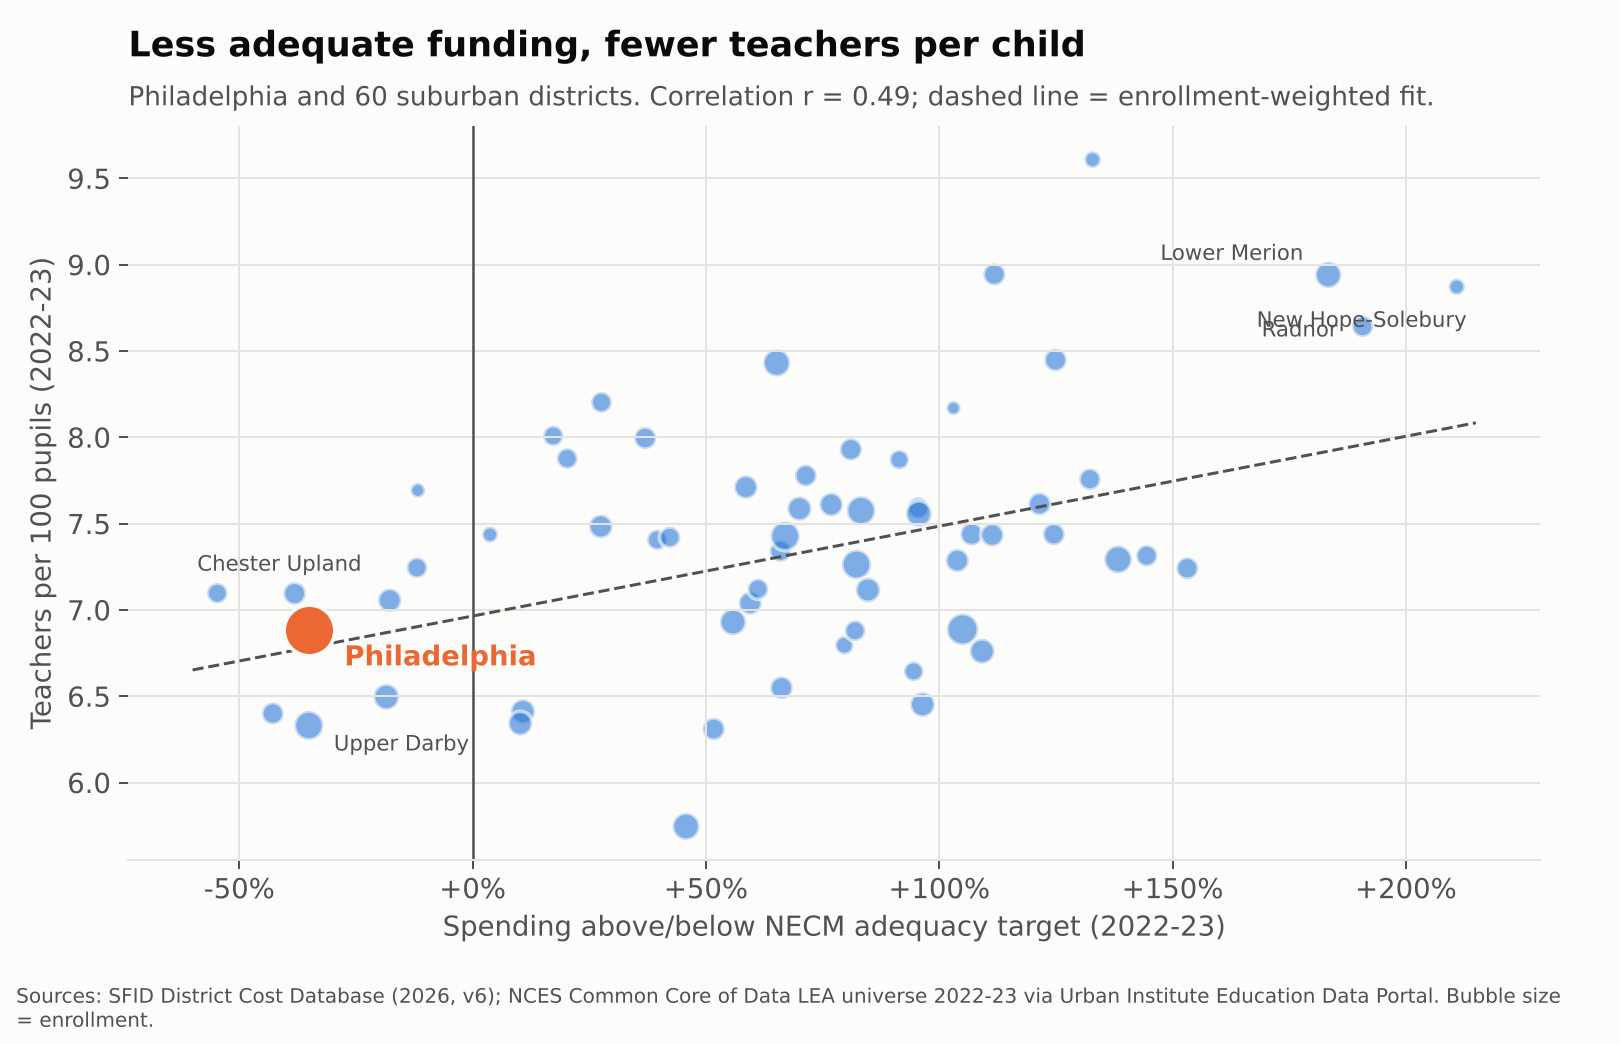
Across Philadelphia and its suburbs, adequacy and staffing move together. Districts further above their adequacy targets employ more teachers per child (r = 0.49 in 2022-23). The fitted line implies that if Philadelphia were funded like the average suburb, it would have roughly 0.45 more teachers per 100 pupils, or about 500 more teachers, before accounting for its higher needs at all.

Adequacy vs. teachers per 100 pupils, Philadelphia and suburban districts, 2022-23

Teacher pay: same labor market, different paychecks

Philadelphia and its suburbs hire from the same pool of teachers, often the same graduating classes. So pay comparisons here need no regional cost adjustment. They are apples to apples.

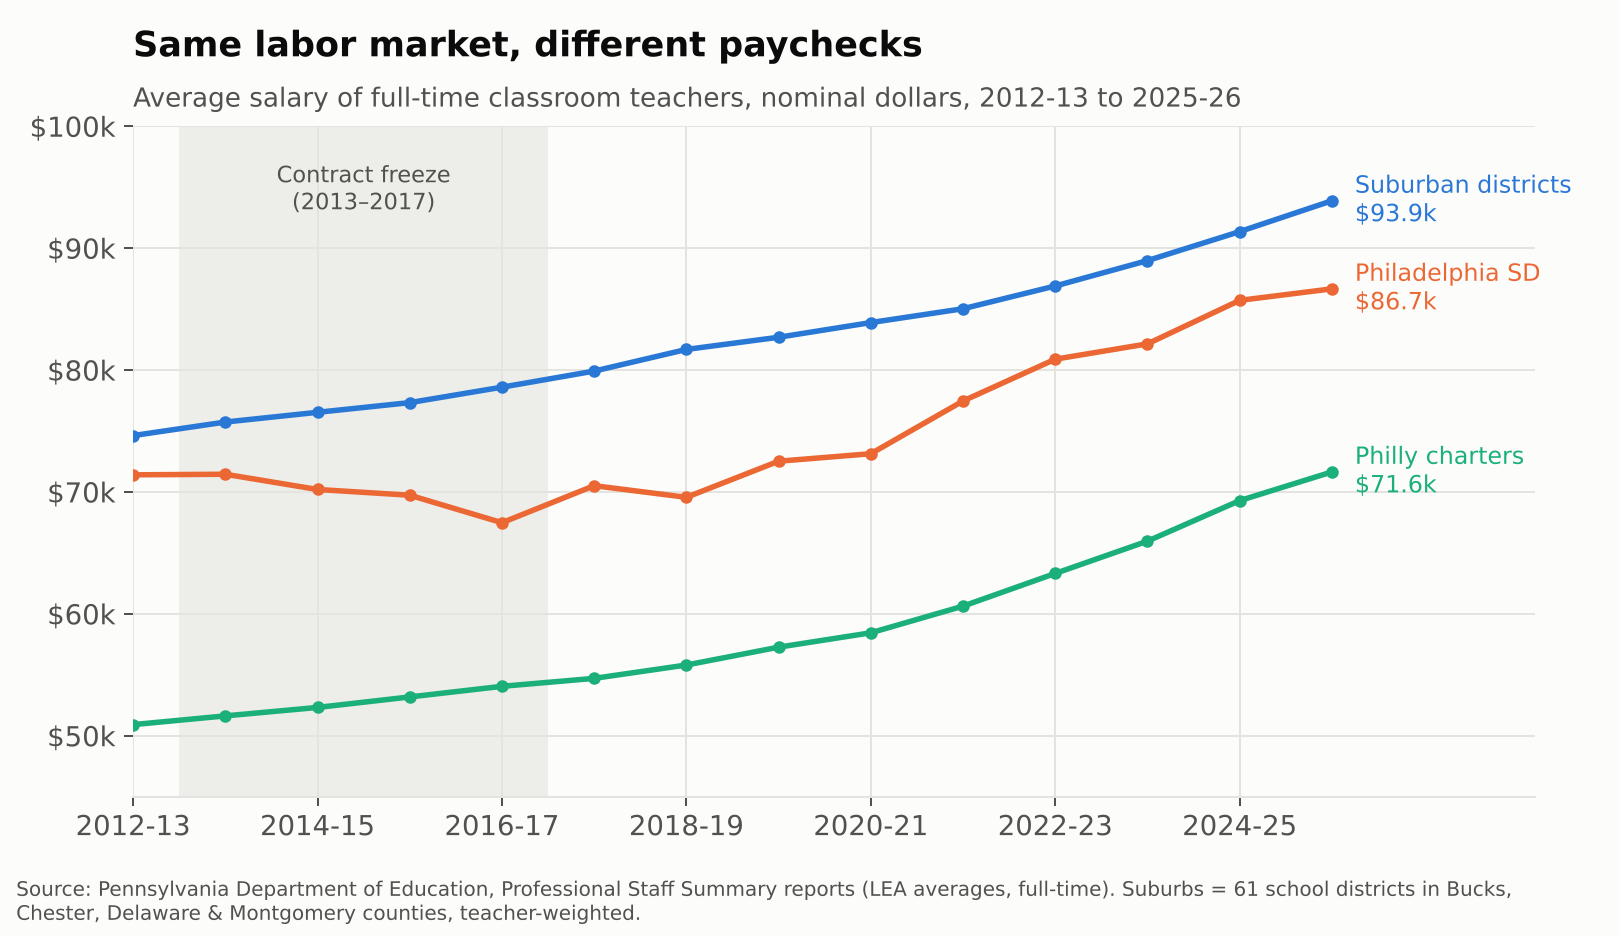
In 2012-13, the average full-time Philadelphia district teacher earned $71,407, about 96% of the suburban average. Then came four years without a contract. By 2016-17, Philly’s average had actually fallen to $67,479 while the suburbs rose to $78,598, a gap of more than $11,000. The district has climbed back since, to $86,664 in 2025-26, but that is still about $7,200 behind the suburbs. Teachers in the city’s charter schools averaged $71,644, roughly three quarters of the suburban figure.

Average teacher salary, Philadelphia SD, Philadelphia charters, and suburbs, 2012-13 to 2025-26

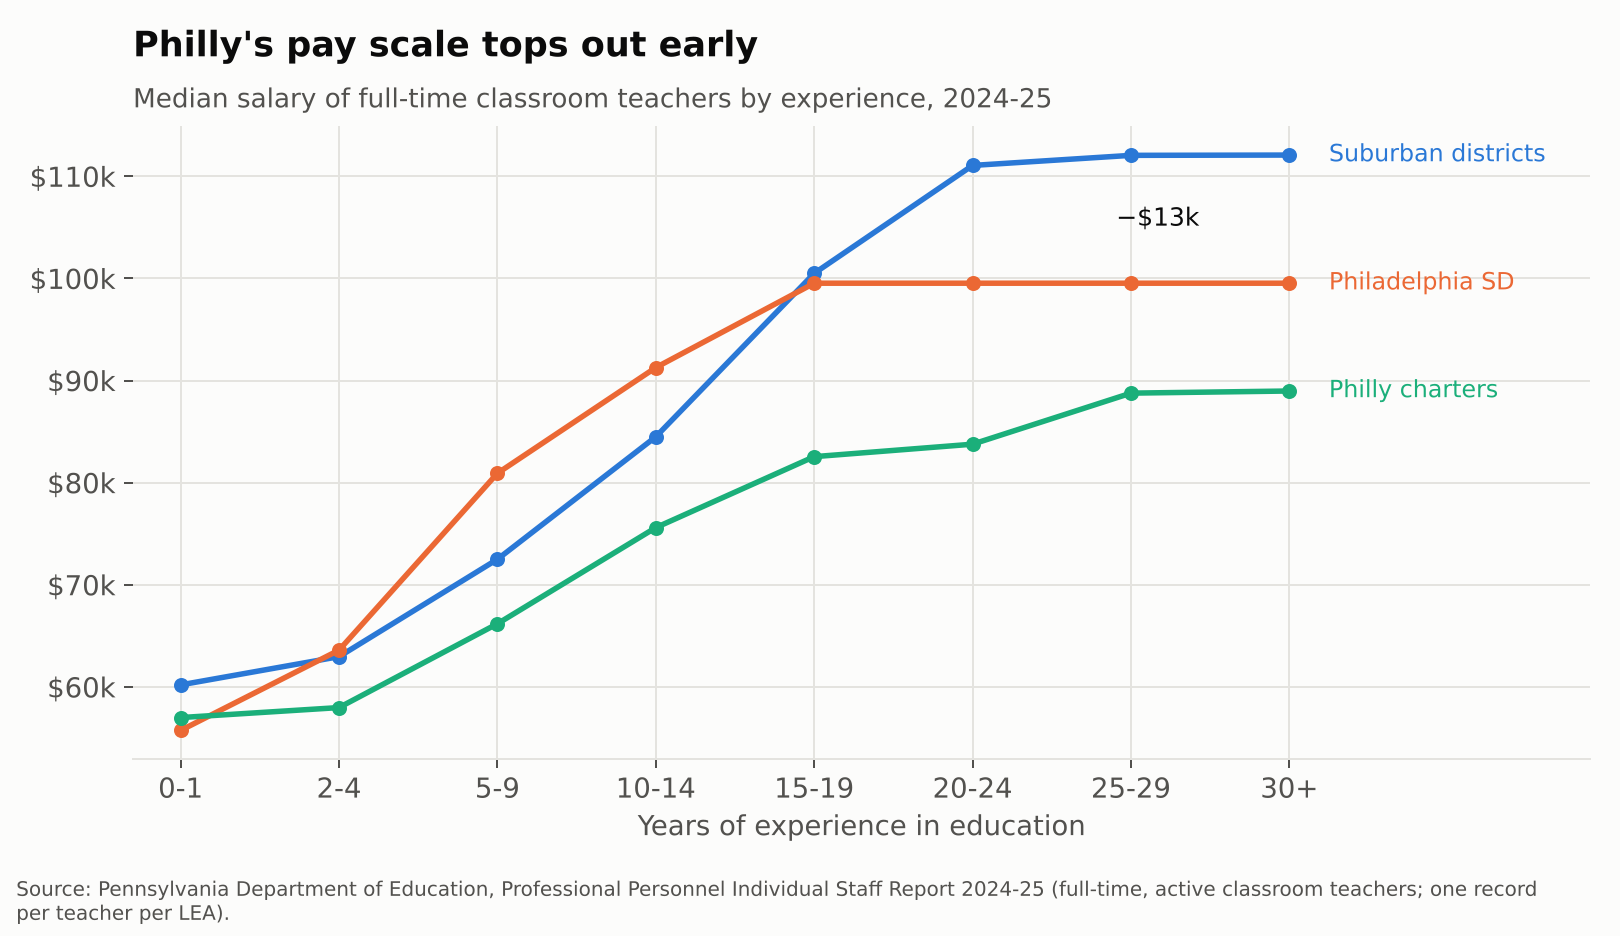
The averages hide where the gap bites. Philadelphia’s current salary scale is competitive in the middle years. Teachers with 5 to 14 years of experience actually earn more than their suburban peers. But the scale flattens at $99,534 after about 15 years. Suburban veterans keep climbing, to a median of about $112,000. A 25-year Philly veteran makes roughly $12,500 less than one in the suburbs.

Median teacher salary by years of experience, 2024-25

That matters for who stays. Philadelphia district teachers average 13.7 years of experience, vs. 15.6 in the suburbs. Charter teachers average 8.9. Every school needs its Barbara Howards. An underfunded system has the hardest time keeping them.

Inside the building: who is actually in front of the kids

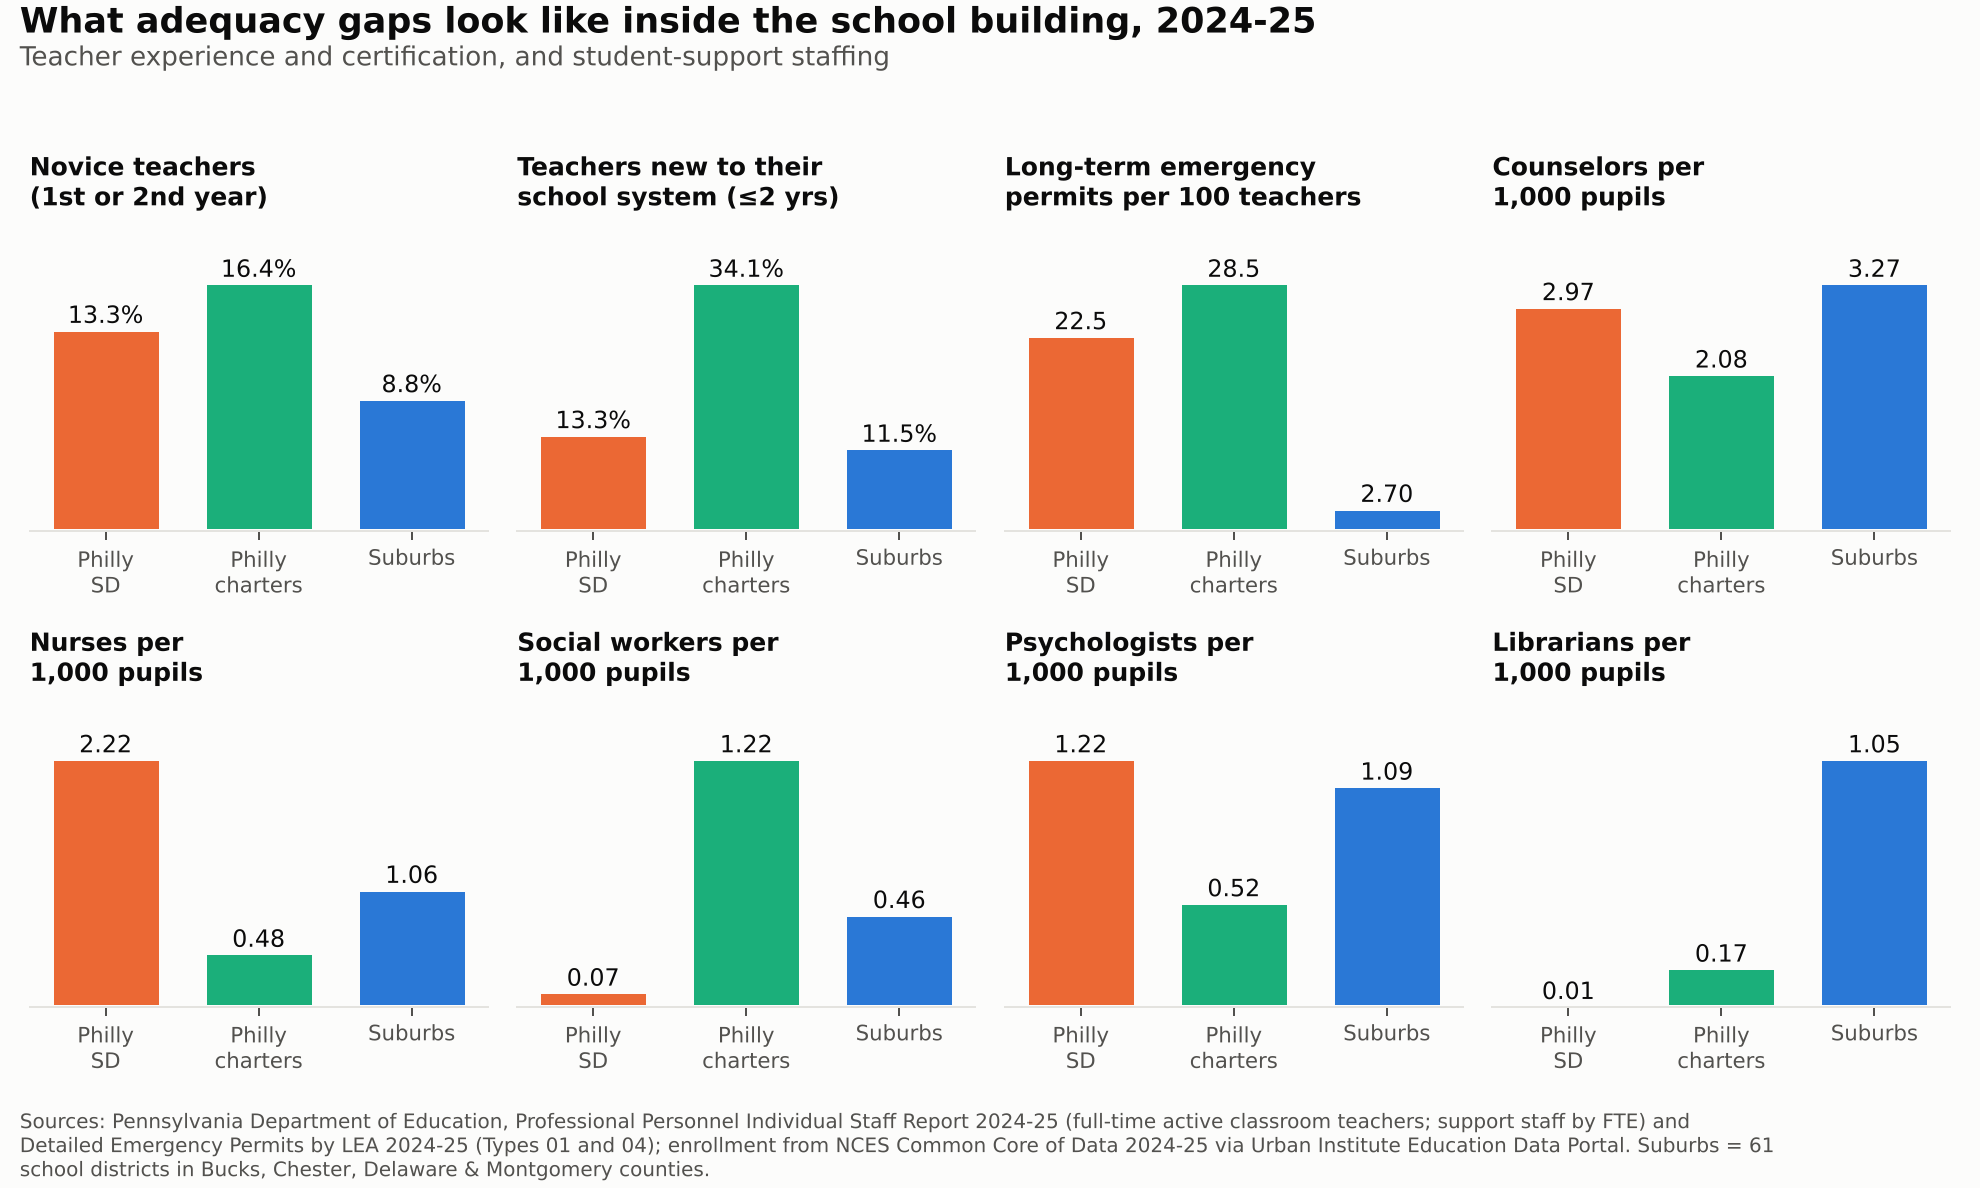
Pennsylvania’s own staff records let us look at who is actually in the classroom, through 2024-25. Janine is not the exception at Abbott. In 2024-25, 13.3% of district teachers were in their first or second year in education, vs. 8.8% in the suburbs. In the city’s charters it was 16.4%, and more than a third of charter teachers had been with their school system for two years or less.

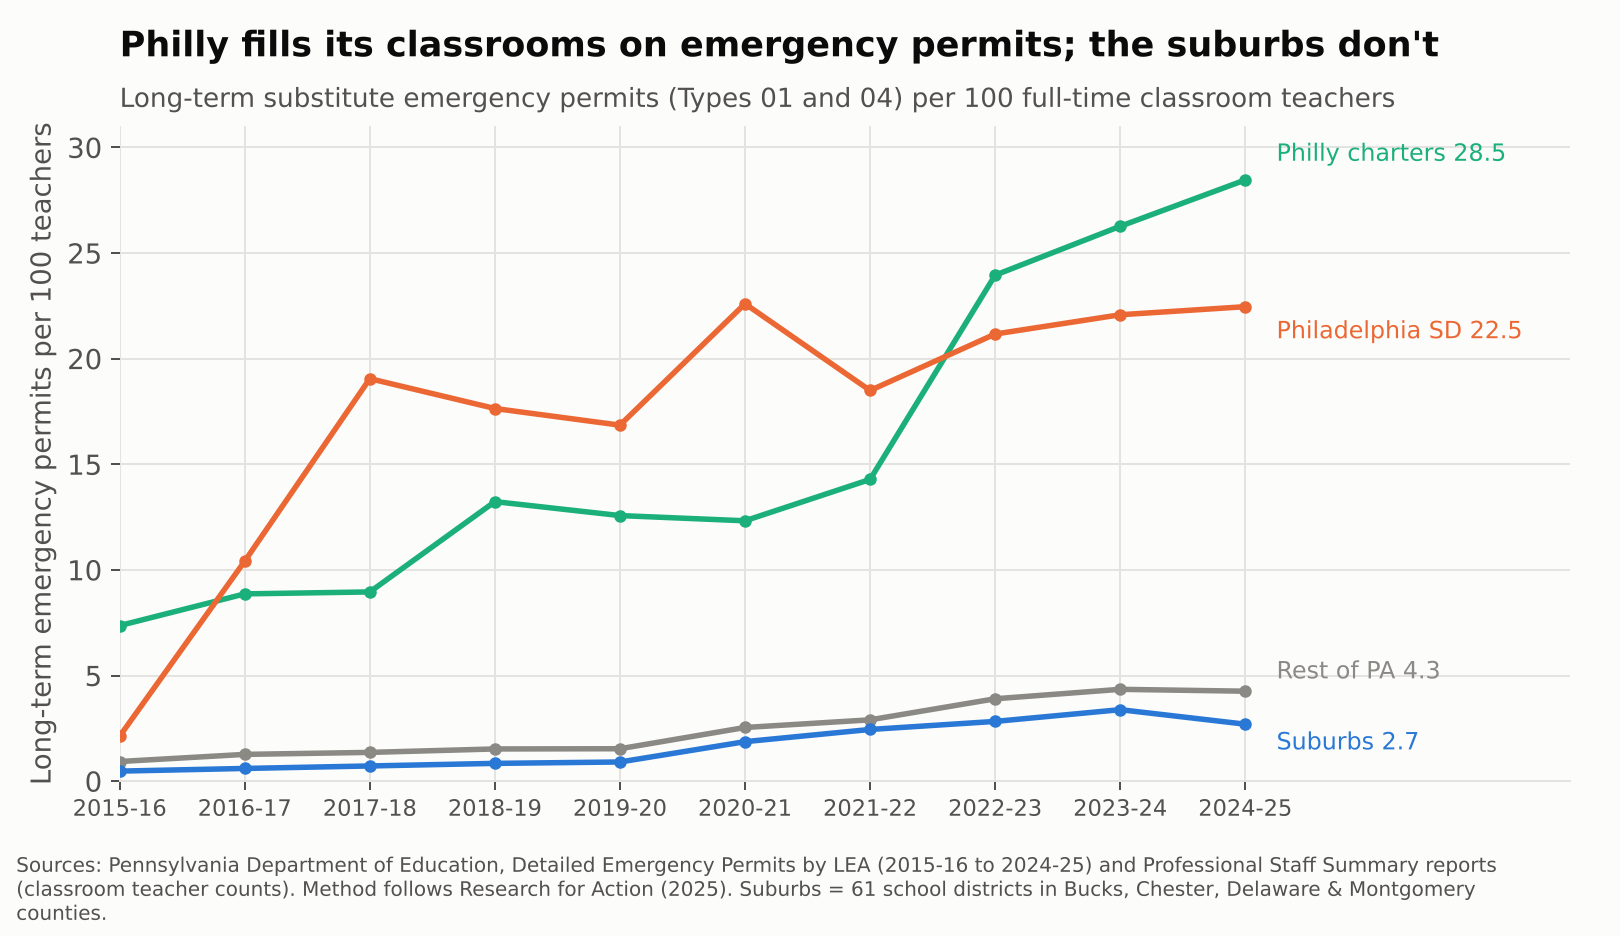
The starkest gap is certification. Pennsylvania lets districts fill vacancies with long-term substitutes on emergency permits when they can’t hire a certified teacher. In 2024-25 the School District of Philadelphia held 22.5 of those permits for every 100 classroom teachers. Philly charters held 28.5. The suburbs held 2.7, and the rest of the state 4.3. Philadelphia’s rate jumped from about 2 to 19 per 100 between 2015-16 and 2017-18, during and right after the contract freeze, and has never come back down.

Long-term emergency permits per 100 classroom teachers, 2015-16 to 2024-25

Support staff tell a more complicated story. After the 2013 layoffs left many schools without counselors or nurses, the district rebuilt. In 2024-25 it reported more nurses and psychologists per 1,000 pupils than the suburbs, and nearly as many counselors (3.0 vs. 3.3). That is what recent money bought. But it is rough parity for students with three times the poverty, and some positions never came back. The district reported 9 social worker FTE and 1 librarian for about 120,000 students. The suburbs had about 148 social workers and 342 librarians for 325,000.

Novice teachers, emergency permits, and support staffing, 2024-25: Philadelphia district, Philadelphia charters, suburbs

Teachers are also absent more. In the most recent federal data with that measure, 2017-18, 46% of district teachers missed 10 or more days, vs. 38% in the suburbs.

The show is entertaining. The damage is real.

Abbott Elementary works because its teachers are heroic and funny and stubborn. Real Philadelphia teachers are too. But heroism is not a funding formula. Year after year, the data show the same chain: Pennsylvania’s system leaves Philadelphia, Reading, Allentown, Harrisburg and their peers far below what their students need. That shortfall becomes fewer teachers per child, a pay scale that stops rewarding veterans, more novices and uncertified teachers, and libraries with no librarians.

The Commonwealth Court said in 2023 that this system violates the state constitution. The new adequacy aid is a start, and the recent staffing gains show money does show up in classrooms when it arrives. But a district still roughly $10,000 per child short of adequacy in 2022-23 will not close that gap with a few hundred million dollars spread across the state.

Janine shouldn’t have to fix the copier herself. And the kids in her class shouldn’t have to be in a sitcom for anyone to notice.

Bonus track: “Below the Line (Philly’s Song)”

Some things are easier to sing than to chart. Here is the same story as an a cappella ballad, with the numbers from this post rising out of the horn.

Below the Line (Philly’s Song). Figures in the video come from the analysis above.

Data notes and sources

  • Adequacy: School Finance Indicators Database, District Cost Database 2026 (v6), National Education Cost Model estimates of required spending to reach national-average outcomes. Spending is current spending per pupil, direct to elementary and secondary education, in current dollars. Years are school years (2023 = 2022-23).
  • Suburbs: the 61 regular school districts in Bucks, Chester, Delaware and Montgomery counties, enrollment-weighted unless noted. Metro comparisons for other Pennsylvania cities use Census CBSAs from the NCES Common Core of Data.
  • Staffing: teachers per pupil from the NCES Common Core of Data LEA universe; teacher absences from the Civil Rights Data Collection; both via the Urban Institute Education Data Portal. Philadelphia SD figures cover district-run schools; charters report separately.
  • Classroom staffing and certification: Pennsylvania Department of Education Professional Personnel Individual Staff Report 2024-25 (teacher experience; counselors, psychologists, nurses, social workers and librarians by FTE) and Detailed Emergency Permits by LEA, 2015-16 to 2024-25. Permit-rate method from Research for Action (2025).
  • Teacher pay: Pennsylvania Department of Education, Professional Staff Summary and Professional Personnel Individual Staff reports, full-time classroom teachers.
  • Caveats: NECM estimates are model-based and benchmarked to grade 3–8 math and reading outcomes. Emergency permit rates count long-term substitute permits (Types 01 and 04) per full-time classroom teacher, following Research for Action (2025); a permit is not an FTE, so read them as rates of reliance, not exact shares of classrooms. Teacher absences come from the 2017-18 Civil Rights Data Collection, the latest year with that item.
  • Related: Rachel Wessler’s earlier Shanker Institute reflection on the show, Heartwarming or Heartbreaking; state budget coverage from WHYY.

Short term plan to Un-Florida Florida’s Public Schools

A Two-Year Plan for Reforming Florida Public Education Finance & Governance

In a recent report on public education in Florida, I made the following recommendations:[1]

  • Recommendation 1 –Financing a Uniform System of High Quality Public Schools
    • Phase 1: Engage in the work of setting a manageable standard of “high quality” public schooling for Florida’s children by engaging in analyses of the costs associated with providing each and every child in Florida with equal educational opportunity to achieve high education outcomes.
      • Establish a statewide commission on school funding.
      • Engage stakeholders in setting standards of excellence for Florida children.
      • Engage experts to estimate the costs associated with meeting those standards, applying appropriately rigorous methods.
    • Phase 2: Guided by those estimates, reform the school finance formula and increase state aid to schools so as to provide them with the necessary resources for all children to have equal educational opportunity to achieve high education outcomes. That is, meet the constitutional standard ratified by Florida voters in 1998 and 2002. This should include estimates of commensurate funding for charter schools, based on needs and costs.
      • Take eliminating or reducing property taxes off the table. The most effective form of property tax relief is increased state aid, as would occur under implementation of this recommendation.
  • Recommendation 2 – Charter School Reset
    • Part 1: Impose a moratorium on charter school expansion, including the Schools of Hope Program. The existing charter school sector in Florida is compromising equity, eroding efficiency and producing poor educational outcomes for those it serves.
    • Part 2: Establish new regulations for evaluating existing charter operators and vetting new charter operators to ensure improved equity in the distribution of students by their needs across schools. Adopt and enforce stricter regulations pertaining to student outcomes.
    • Part 3: Adopt updated charter school legislation to ensure that charter schools are sufficiently “public,” required to operate as if “state actors,” protecting children’s constitutional rights and abiding by all relevant federal statutes.
  • Recommendation 3 – Voucher Freeze & Reallocate
    • Freeze expansion of the voucher program to free up state resources to support a fully funded, overhauled public school finance formula, to provide a uniform system of free public schools.

The justification for each of these recommendations is thoroughly documented in the cited report. The next step is to lay out an action plan for policy advocacy for the next two years, and next two Florida legislative cycles.

Two year Plan

Following are my recommendations for that two -year action plan:

Year 1 (2026 Session, fy2027) – Pause, Reset & Evaluate

  • Repeal and rethink Schools of Hope (SoH)

    The Schools of Hope legislation and regulations which have been fast tracked over the past year are an ill-conceived patchwork with little potential to solve systemic problems in Florida public education. But, conversations around that program have revealed three key issues worthy of consideration.

    • First, the SoH plan acknowledges that Florida’s existing charter sector is not strong and that recruiting proven providers from other states might be necessary.
    • Second, the SoH plan includes substantial additional funding (nearly $5k) per pupil to ensure that designated schools could be successful.
    • Third, the SoH plan acknowledges the importance of and costs related to operations and maintenance of capital – land and buildings needed for providing quality education.

    Presumptively, a taxpayer financed school of choice shouldn’t exist to begin with unless it provides some element of “hope.” Hope for better student academic outcomes, while maintaining children’s and taxpayers’ rights. Empirical evidence in my report indicates that the charter sector on average in Florida, does not advance “hope” for better academic outcomes for Florida’s children. The purported need to create a special class of charter schools (ones that do offer “hope”), requiring access to free capital and substantial additional funding in order to be “successful” is indicative of the systemic problem state legislators have failed to address.

    My report explains that Florida public schools, inclusive of charter schools lack the funding needed to achieve high performance. Still, they perform quite efficiently with the funding they have. Florida public district AND charter schools would benefit from that same boost in funding (approximately 50% increase to annual operating expenditures). But the proposed SoH plan instead, taps into the operating expenses of district schools to offset costs for charter schools (for operations and maintenance of facilities), giving district officials little control over that allocation, while also boosting revenues for designated SoH charter operators. This plan is grossly inequitable, applying non-uniform treatment across schools and usurping constitutional authority of local boards of education to efficiently operate a system of high-quality schools. The plan as currently proposed must be repealed. 

    • Revisit charter schools and charter sector statutes and regulations

    The U.S. Supreme Court may soon rule that charter schools under most state charter school laws do not operate as “state actors” and thus are not compelled recognize children’s constitutional rights to free speech, free exercise of religion, due process in cases of disciplinary action, or equal protection. Thus, it will fall on states to rewrite their charter school legislation to ensure that the protections available to children in charter schools are equal to those attending public district schools.[2]

    A second issue that must be addressed is the evaluation of a) current charter operators and their reauthorization and b) the vetting of potential outside providers. The state must tighten statutory and regulatory requirements – and apply existing ones – to ensure that providers of schools of choice are a) not having detrimental economic or demographic segregative impact on local neighborhoods and schools and b) are provided quality education as measured by relevant outcomes compared against schools serving similar student populations and with equitable resources. Outside providers wishing to be authorized should validate that they have been successful serving a representative population with respect to the spaces in which they plan to operate locally.

    A third issue that must be addressed is the equitable distribution of and cost-sharing for capital space. The SoH plan essentially provides squatters rights to recognized charter operators and then pushes the costs onto local districts. My previous writings have asserted that it may be reasonable to provide access to publicly owned and maintained capital for charter operators, rather than have them use tax dollars to acquire land and buildings for private ownership.[3] Publicly owned and operated schools are governed under the constitutional authority (in Florida) of local boards of education. The state may develop guidance for local boards of education to collaborate with charter operators for access to under-used district capital. Local boards can/should submit plans for such collaboration. This approach is favorable over selling those assets to affiliates of charter operators via 3rd party transactions wherein tax dollars are used to buy – via revenue bond debt, a facility that the public owns – and after buying that facility a second time, the public no longer owns it.[4]

    A fourth issue is the equitable financing of district and charter schools according to reasonable estimates of the costs associated with differences in student populations served, and with separate consideration of equitable cost sharing for capital space. On the first, point, a study conducted for the State of Maryland provides insights on the complexities of “commensurate” funding (e.g. “uniform” in a Florida context) for district and charter schools. [5]

    A final issue that must be addressed is transparency and thoroughness of financial reporting including reporting on and regulation of related party transactions of contractual services and for capital acquisition.[6] The latter can be mitigated by public oversight of access to publicly owned capital. Recent reporting by CBS News exposed the complex web of financial relationships between charter management companies and contracted service providers, most of which under current law, remain permissible, however suspect and opaque.[7] These issues can be fixed.[8]

    • Equal Opportunity for High Quality Schooling Commission

    The tacit acknowledgment in the SoH proposal that schools in Florida need more money – a lot more money – if we expect them to succeed, at high levels, while serving the state’s most disadvantaged communities – is a good starting point. As I noted in my report, funding matters for the quality of student outcomes that can be achieved. [9] Funding matters more in higher poverty, previously lower spending settings. Further, well designed state school finance policies are guided by outcome goals, wherein funding levels are calibrated with respect to the costs to achieve the desired outcome goals. Those costs vary across children and settings, to achieve comparable outcome goals.[10]

    The legislature should establish commission and engage the public in setting those goals and then working with qualified experts in determining the costs to achieve those goals across children and educational settings in Florida. Those analyses may guide a comprehensive reform of school funding for Year 2 of this plan.

    The back of the napkin spending increases proposed for Schools of Hope may be a useful guidepost for year 1 increases for the state’s highest poverty schools and districts, where those increases are just under $5,000 per pupil. Figure 26 of my report shows that if the state were to recapture even 70% of the budgeted school voucher funds for the current year, per pupil funding could be increased by just under $5,000 per pupil for the highest poverty quintile of school districts and $2,000 per pupil in the second highest poverty quintile. Per the relevant research on return on investment of education spending, this would be a far more productive and efficient allocation of those same dollars. District and charter schools would equally/uniformly benefit.

    • Resist any and all reductions or limitations on major tax revenue sources

    On average, tax and expenditure limits have long run detrimental effects on public service quality including the quality of public schooling measured by students’ outcomes or by the quality of inputs to schooling including class sizes and teacher compensation.[11] Florida district and charter schools are already suffering a lack of sufficient funding to produce high outcomes. As illustrated in my report, Florida’s local public school districts are highly efficient at producing outcomes with the resources available.

    At the same time, Florida school districts have become more dependent on local property tax revenues to maintain current levels of service. While the share of revenue from property taxes has increased over the past 30 years, current spending per pupil has remained stagnant. Eliminating, cutting or capping property taxes either inclusive of school property taxes or not will place undue strain on local county and municipal budgets that will either directly or indirectly squeeze public and charter school resources for both operations and capital. The appropriate approach would be for the state to identify new tax revenue sources and use those sources to increase state aid to municipalities and school districts, taking pressure off local property taxes. State aid is the best form of property tax relief, permitting the services to be provided at the level of quality desired with less burden on local taxation to cover the costs of those services.[12]

    Year 2 (2027 Session, fy2028) – Overhaul School Funding Formula & related Governance

    • Overhaul (replace) the School Finance Formula

    Adopt a comprehensive school finance formula designed to cover all annual operating costs of schools, with the exception of transportation and capital. That school finance formula, unlike the present formula, should be calibrated to ensure that every district and school statewide has the resources necessary for all children to have equal opportunity to achieve the desired outcomes (as vetted through the public engagement process in year 1).

    • That formula must include appropriate adjustments for the costs of serving children from different backgrounds and attending school across different settings. This includes but may not be limited to a) children from economically disadvantaged backgrounds, b) English learners, c) children with disabilities. Geographic and location factors should include but may not be limited to a) very small schools in remote, sparsely populated locations, b) differences in labor costs (associated with recruiting/retaining teachers of comparable qualifications across locations).
    • That formula should be inclusive of uniform funding for charter schooling, with potential exclusions (or charges applied) for services provided to charter students through the host district.
    • Separate, equitable formulas must be developed for a) the financing and allocation of capital (educational spaces) for district and charter enrolled students, and b) the financing centralized planning of transportation services.
    • Phase down (and out) funding of any new cohorts of voucher students

    This should free up substantial resources to support the first recommendation above, but additional revenues will likely still be needed.

    • Reorganize/reconstitute charter operators that do not contribute positively to equity or efficiency

    Florida has far too many charter operators that underserve children with disabilities, English learners and children from economically disadvantaged backgrounds, and yield poor academic outcomes for those they do serve when compared to district regular and magnet schools serving similar student populations.

    Using policy tools (legislation and regulations) developed in year 1, the state should begin the process of reconstituting these schools. Decisions should be based both on whether a school (or operator of many schools) contributes to or erodes equity with respect to students served versus those served in surrounding schools and residing in surrounding neighborhoods, in addition to performance metrics based on the population served. Any changes to or closures of schools should consider the least disruptive option for those currently enrolled. 

    NOTES


    [1]Baker, B.D. (2025) Financing a High-Quality System of Free Public Schools for Florida’s Children https://schoolfinance101.com/wp-content/uploads/2025/11/florida_school_finance_12.02.25.pdf

    [2] Green III, P. C., & Eckes, S. E. (2024). All Aboard!: Making Charter School Boards All-Purpose State Actors under the Supreme Court’s Amtrak Case. Drake L. Rev., 71, 562.

    [3] Baker, B. D. (2016). Exploring the Consequences of Charter School Expansion in US Cities. Economic Policy Institute. https://files.eric.ed.gov/fulltext/ED588750.pdf

    Baker, B., & Miron, G. (2015). The Business of Charter Schooling: Understanding the Policies That Charter Operators Use for Financial Benefit. National Education Policy Center. https://files.eric.ed.gov/fulltext/ED574733.pdf

    [4] Baker, B.D. (2015) We bought it twice but we nolonger own it. School Finance 101. https://schoolfinance101.com/2015/07/21/we-bought-it-twice-but-we-no-longer-own-it-is-co-location-the-better-option/

    [5] Levin, J., Baker, B., Atchison, D., Brodziak, I., Boyle, A., Hall, A., & Becker, J. (2016). Study of funding provided to public schools and public charter schools in Maryland. American Institutes for Research. https://marylandpublicschools.org/stateboard/Documents/01242017/TabG-CharterPublicSchoolFundingStudy.pdf

    [6] Green III, P. C., Baker, B. D., & Oluwole, J. O. (2018). Are charter schools the second coming of Enron: An examination of the gatekeepers that protect against dangerous related-party transactions in the charter school sector. Ind. LJ, 93, 1121.

    [7] https://www.cbsnews.com/video/florida-charter-school-company-gop-figure-parents-frustrated/

    [8] https://theconversation.com/charter-schools-exploit-lucrative-loophole-that-would-be-easy-to-close-111792

    [9] Baker, B. D., & Knight, D. (2025). Does money matter in education? Albert Shanker Institute. https://files.eric.ed.gov/fulltext/ED671888.pdf

    [10]Atchison, D., Levin, S., Levin, J., Kolar, A., Blair, D., Srikanth, A., & Salvato, B. (2024). Equity and Adequacy of Colorado School Funding: A Cost-Modeling Approach. https://www.cde.state.co.us/cdedepcom/schoolfinancecostmodelingadequacystudyreport

    D. Atchison, B.D. Baker, J. Levin, S. Fatima, A. Trauth, A. Srikanth, C. Herberle, N. Gannon-Slater, L. Junk, K., Wallace, L., & Baker, B. (2023) Assessment of Delaware Public School Funding. https://education.delaware.gov/wp-content/uploads/2023/12/23-22933_1_Delaware_Full_Report-FMT-ed103023-Version-2.pdf

    Atchison, D., Baker, B.D., Levin, J., Kearns, C. (2020) New Hampshire Commission to Study School Funding, Final Report. https://carsey.unh.edu/sites/default/files/media/2020/09/20-12685_nh_final_report_v10.pdf

    Brooks, C., Levin, J., Baker, B., & Salvato, B. (2025). Understanding the Cost of Providing Adequate Educational Opportunity in Oregon. https://olis.oregonlegislature.gov/liz/2025R1/Downloads/CommitteeMeetingDocument/291280

    [11] Downes, T. A., & Figlio, D. N. (2012). Tax and expenditure limits, school finance and school quality. In Handbook of research in education finance and policy (pp. 395-410). Routledge.

    [12] Baker, B. D., Di Carlo, M., & Oberfield, Z. W. (2023). The Source Code: Revenue Composition and the Adequacy, Equity, and Stability of K-12 School Spending. Albert Shanker Institute.