Abbott Elementary plays it for laughs. Janine Teagues hunts for a working rug, a functioning copier, a single extra aide. Barbara Howard has seen every reform come and go. Gregory Eddie inherits a classroom with no curriculum. Melissa Schemmenti knows a guy who can get the supplies the district can’t.
The show is entertaining. The damage is real. Behind every running gag is a funding gap that has been measurable, year after year, for at least fifteen years, and that has landed on real children in real Philadelphia classrooms.
Philadelphia’s district schools have spent between a third and a half less than what it would cost to get their students to national-average outcomes in every year from 2009 to 2023. Over the same years, the 61 suburban districts in Bucks, Chester, Delaware and Montgomery counties spent between half again and twice what their own students needed. We laugh at the broken boilers, missing counselors and teachers buying their own supplies. The kids living it don’t get a laugh track.
What follows walks from the money to the classroom: first the adequacy gap, then the simple “screwed city” picture, then teachers per child, teacher pay, and finally who is actually standing in front of the kids.
Fifteen years below the line
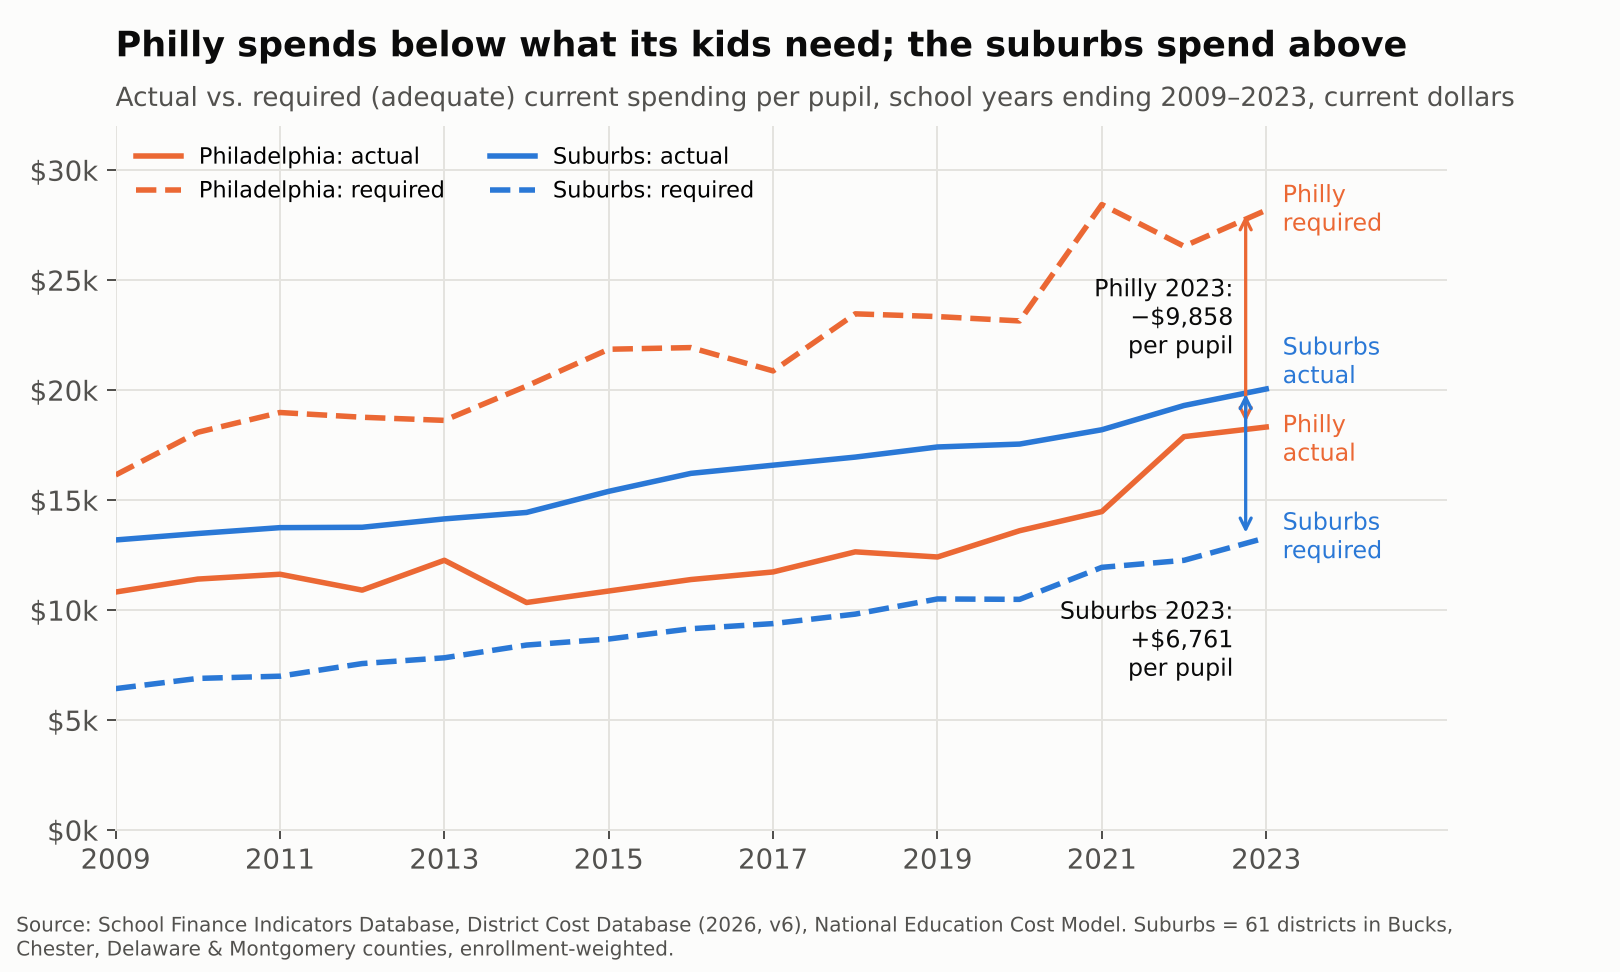
In 2022-23, the School District of Philadelphia spent $18,329 per pupil. Our National Education Cost Model estimates it would have needed $28,187 to give its students a shot at national-average test scores. That is a gap of $9,858 per child, or roughly $1.2 billion across 118,000 students, in a single year.
The suburbs face the mirror image. Their enrollment-weighted average spending was $20,059 against a required $13,298, a surplus of $6,761 per child. Same metro, same labor market, same state constitution.
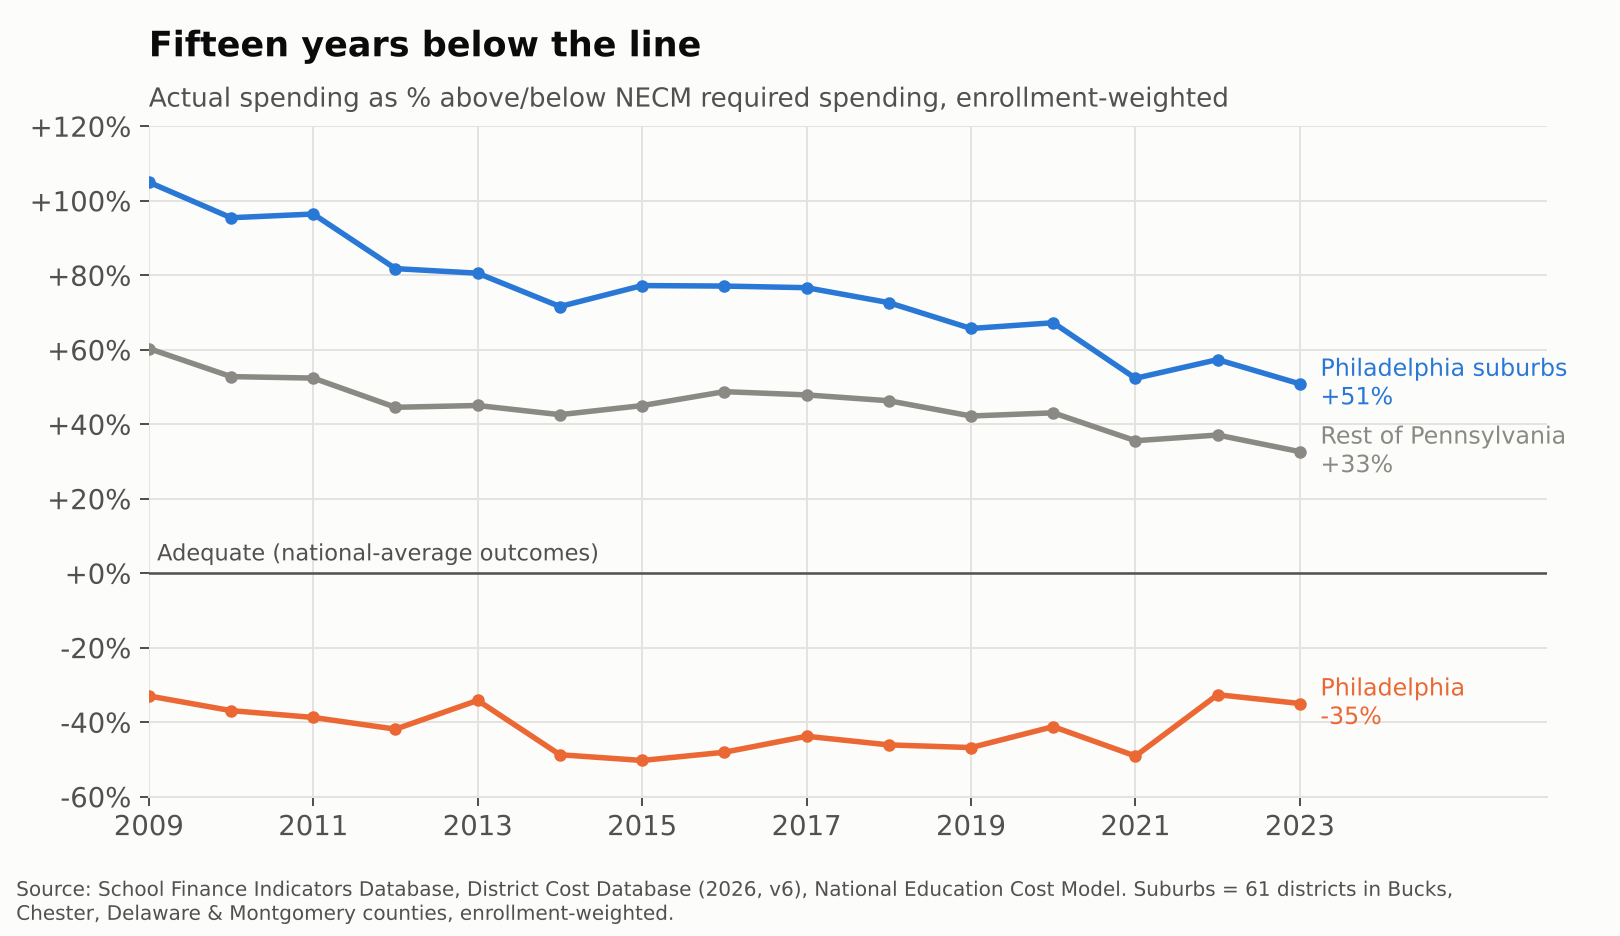
This is not a recent dip. Philadelphia sat 33% below its adequacy target in 2009, sank to 50% below in 2015 in the wake of the “doomsday” budgets, and was still 35% short in 2023, even with federal pandemic aid in the mix. The suburbs started out spending more than double their target and have drifted down to about 51% above it. The rest of Pennsylvania sits in between, about a third above.
The outcome side tells the same story. Philadelphia’s students scored roughly 0.8 standard deviations below the national average in 2022-23, while suburban students scored about 0.2 above. Abbott’s students are not falling short because nobody cares. They are falling short where the money falls short.
The simple version: a “screwed city”
You don’t need a cost model to see the problem. Divide Philadelphia by its suburbs. In 2022-23, the city had 3.2 times the suburban child poverty rate. Under the NECM, that translates into 2.1 times the cost of reaching national-average outcomes. And the city spent 0.91 times what the suburbs spent.
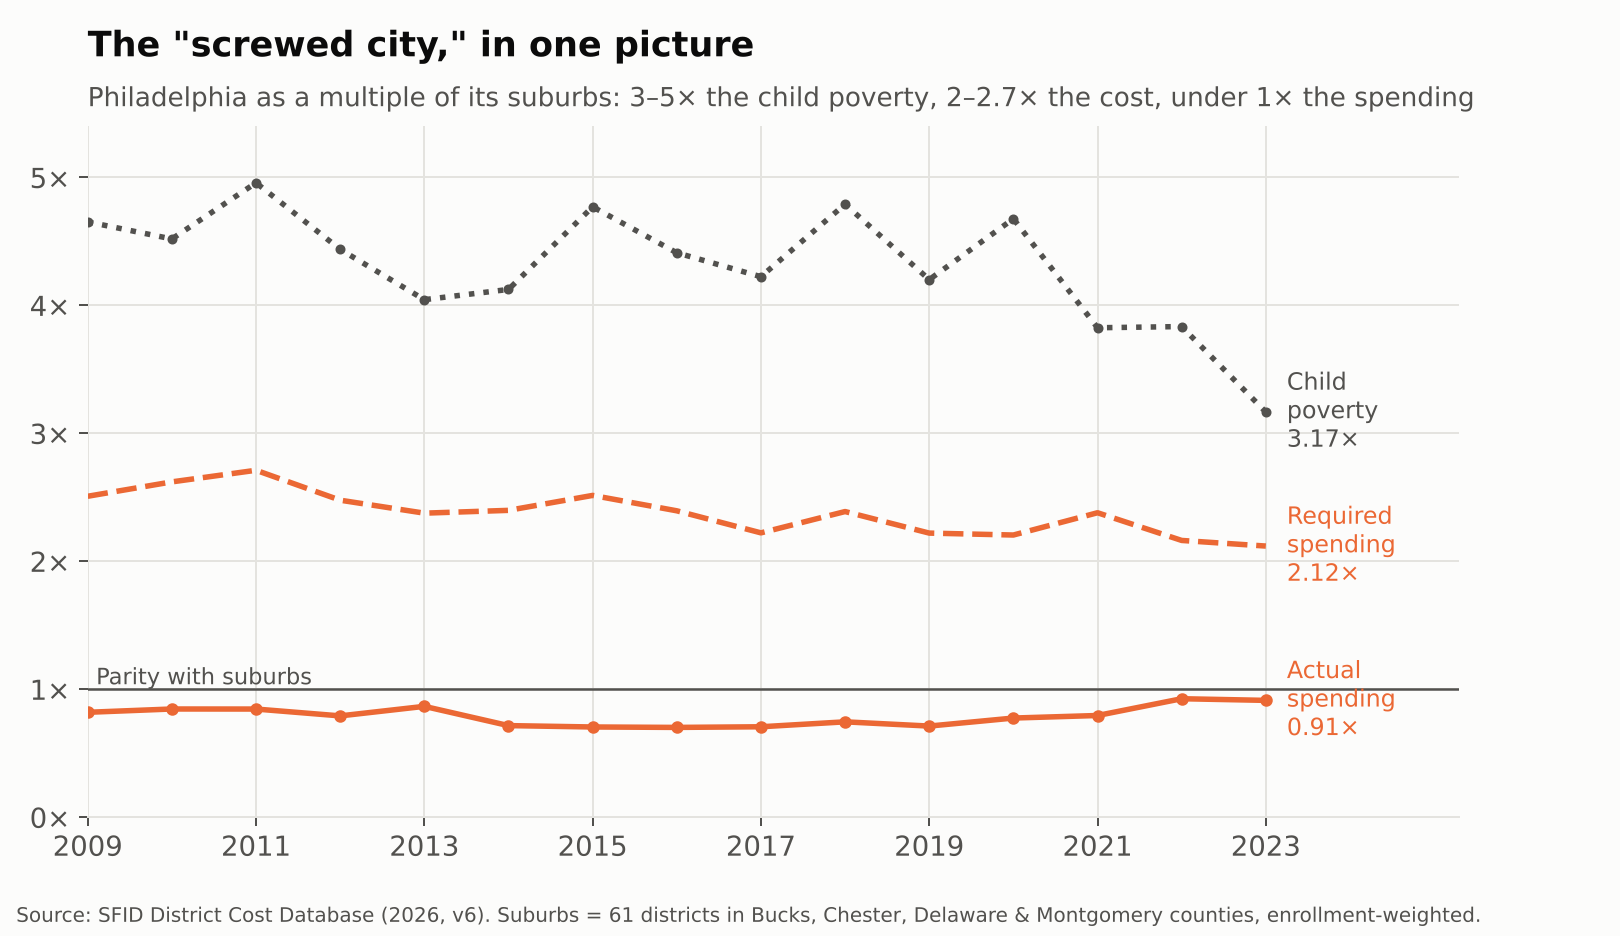
That pattern has held every year since 2009. Philly’s poverty rate has run 3 to 5 times the suburban rate, its costs 2 to 2.7 times, and its spending has never once caught up to the suburbs, let alone exceeded them.
That is what it means to be a screwed city. Not just underfunded relative to need, but outspent outright by the comfortable districts a short SEPTA ride away.
Even in Pennsylvania, Philadelphia is not alone
Philadelphia is the biggest case, not the only one. Reading spent 46% below its adequacy target in 2022-23, while the rest of the Reading metro spent 53% above. Allentown was 17% short while its Lehigh Valley neighbors were 47% over. Harrisburg, York, Lebanon, Erie, Wilkes-Barre and Chester Upland tell the same story.
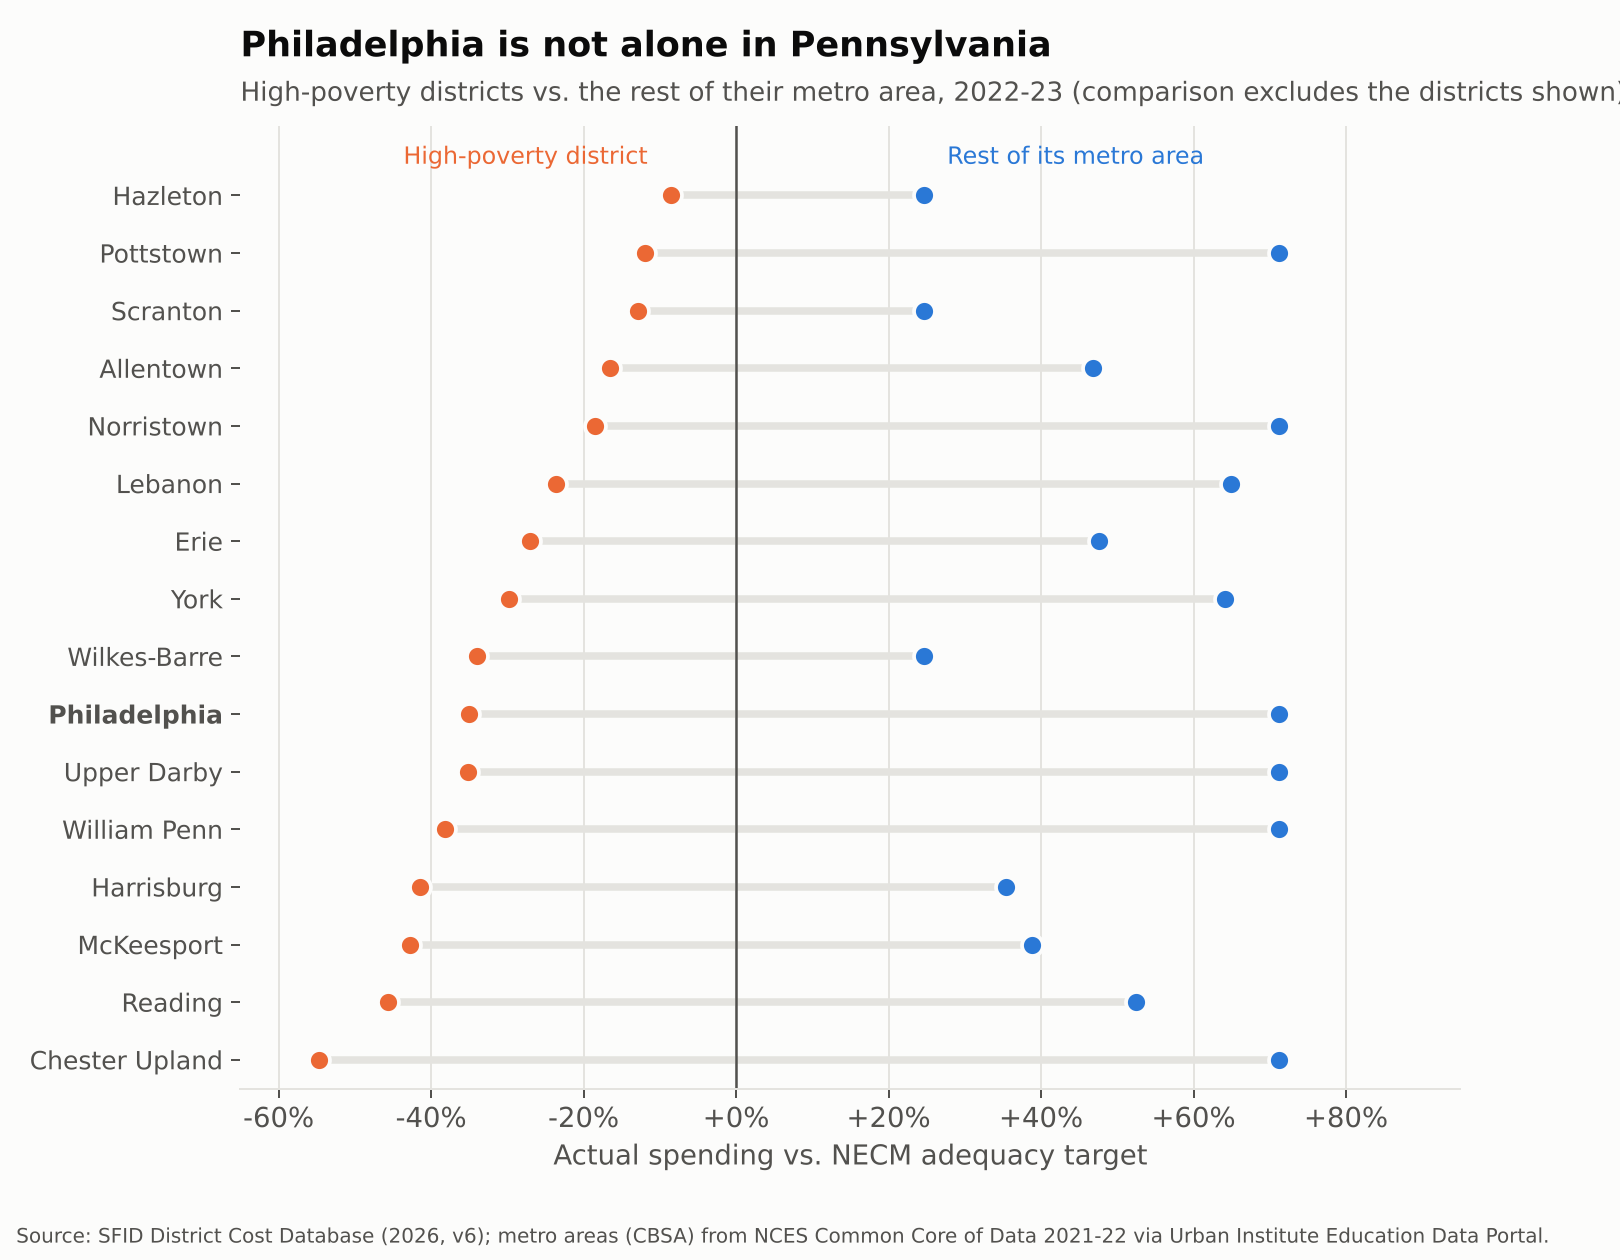
The pattern reaches into Philly’s own suburbs. Chester Upland, Upper Darby, William Penn, Norristown and Pottstown are all below adequacy, surrounded by districts in the same four counties that spend about 71% above theirs.
Across the state, 56 of 497 districts spent below their adequacy targets in 2022-23. They enroll 23% of Pennsylvania’s students, but 67% of its Black students and 49% of its Hispanic students, compared to 8% of its white students. Philadelphia accounts for about a third of the students in those districts. Fixing Philly alone would not fix Pennsylvania.
This is the system the Commonwealth Court found unconstitutional in William Penn School District v. Pennsylvania Department of Education in February 2023. The state has since begun phasing in adequacy aid, including $565 million statewide in the 2025-26 budget (WHYY). The gaps above are what that aid is chasing.
From dollars to classrooms: fewer adults per child
School money is mostly people. When a district is short a third of what it needs, the shortfall shows up as fewer teachers, larger classes and missing specialists.
Philadelphia reported 11,103 teachers in 2009-10. By 2013-14 it had 7,645, a 31% cut, while enrollment fell only 17%. From 2012 through 2020, the district ran between 12% and 29% fewer teachers per 100 pupils than its suburbs. That is Gregory Eddie’s world: a full roster of kids, and not enough colleagues to share them with.
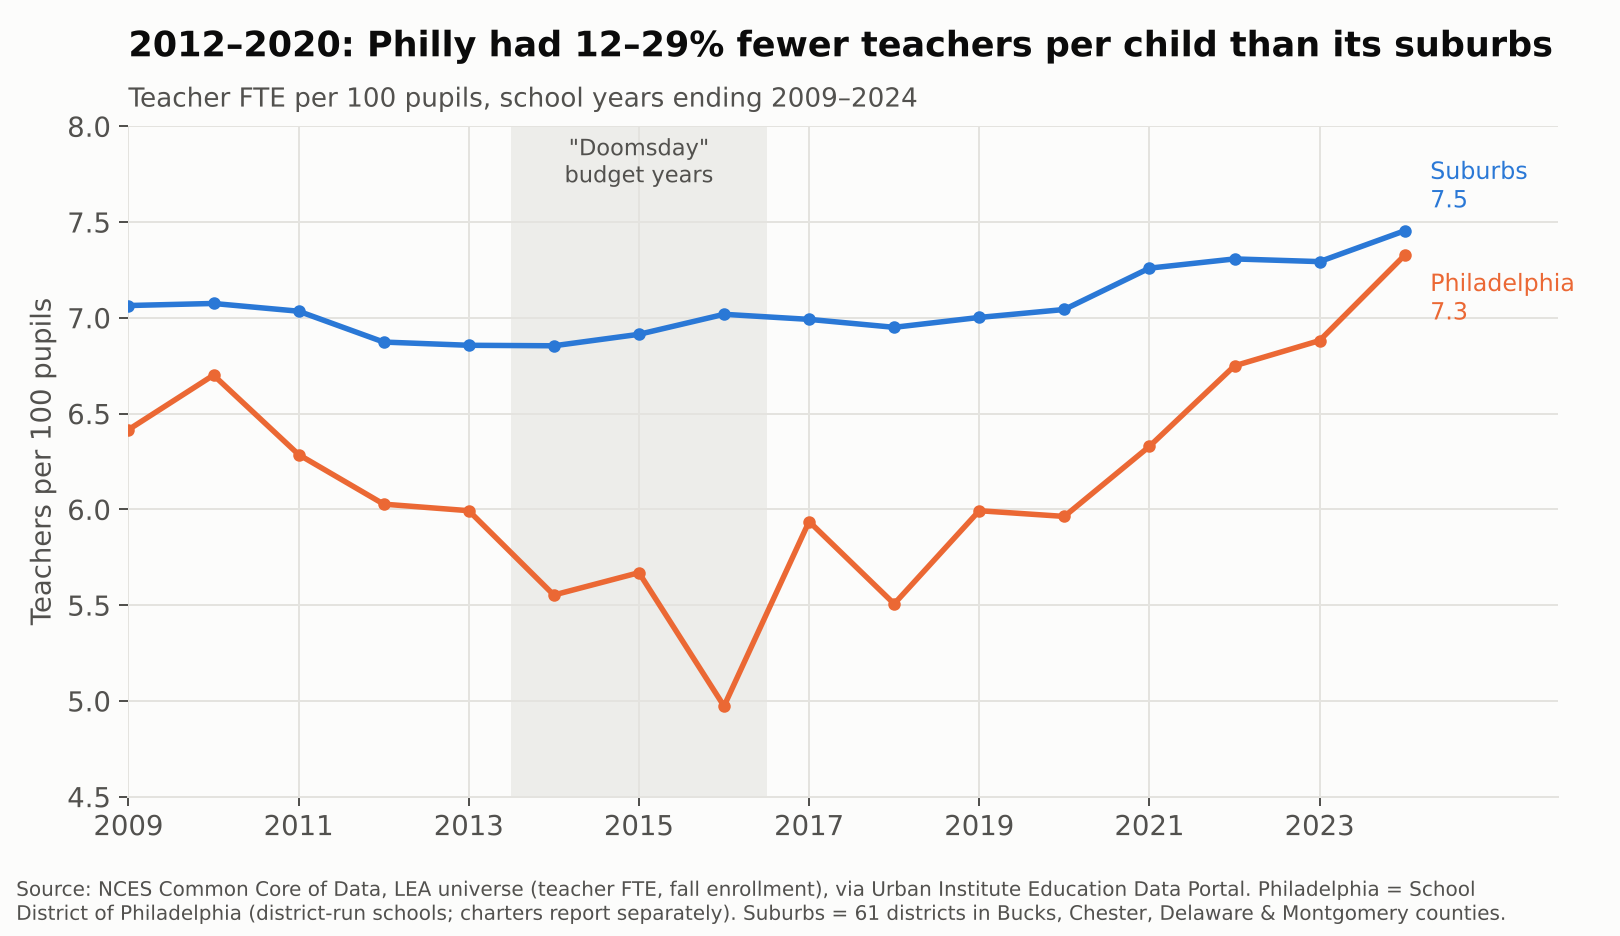
The gap has nearly closed since 2021, to 7.3 teachers per 100 pupils in Philadelphia vs. 7.5 in the suburbs in 2023-24, helped by federal pandemic aid and new state money. But parity is not adequacy. A district whose students cost twice as much to serve, by the NECM’s estimate, does not get there with the same staffing ratio as Lower Merion.
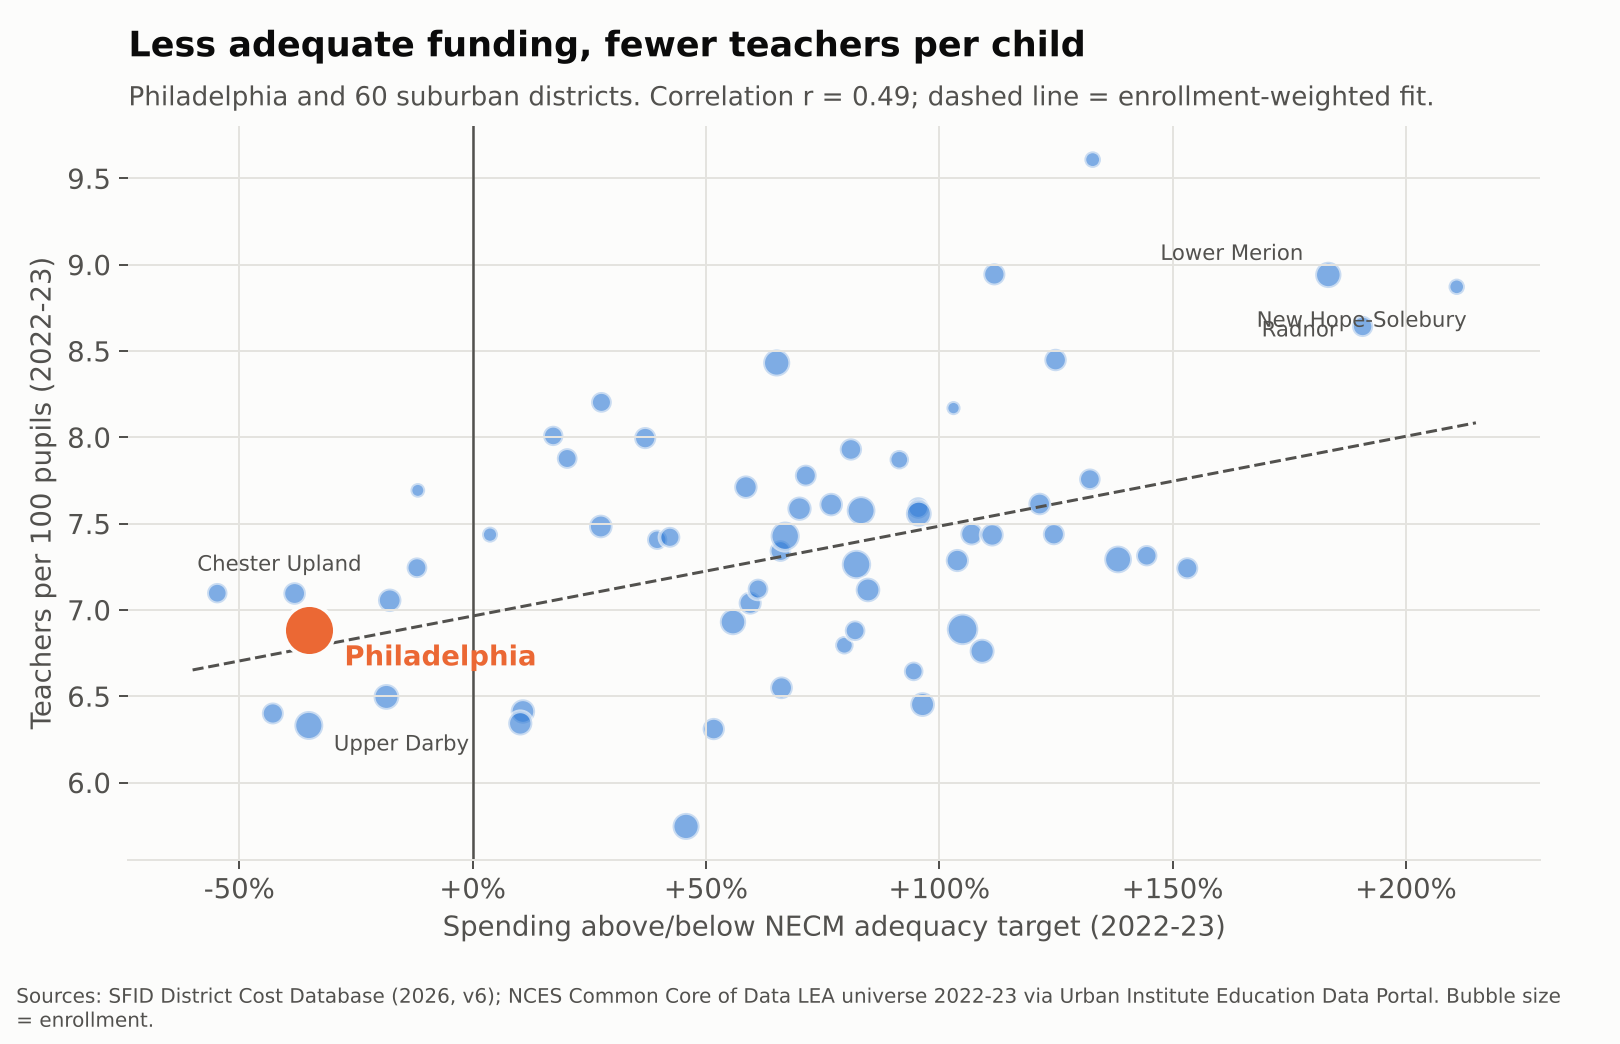
Across Philadelphia and its suburbs, adequacy and staffing move together. Districts further above their adequacy targets employ more teachers per child (r = 0.49 in 2022-23). The fitted line implies that if Philadelphia were funded like the average suburb, it would have roughly 0.45 more teachers per 100 pupils, or about 500 more teachers, before accounting for its higher needs at all.
Teacher pay: same labor market, different paychecks
Philadelphia and its suburbs hire from the same pool of teachers, often the same graduating classes. So pay comparisons here need no regional cost adjustment. They are apples to apples.
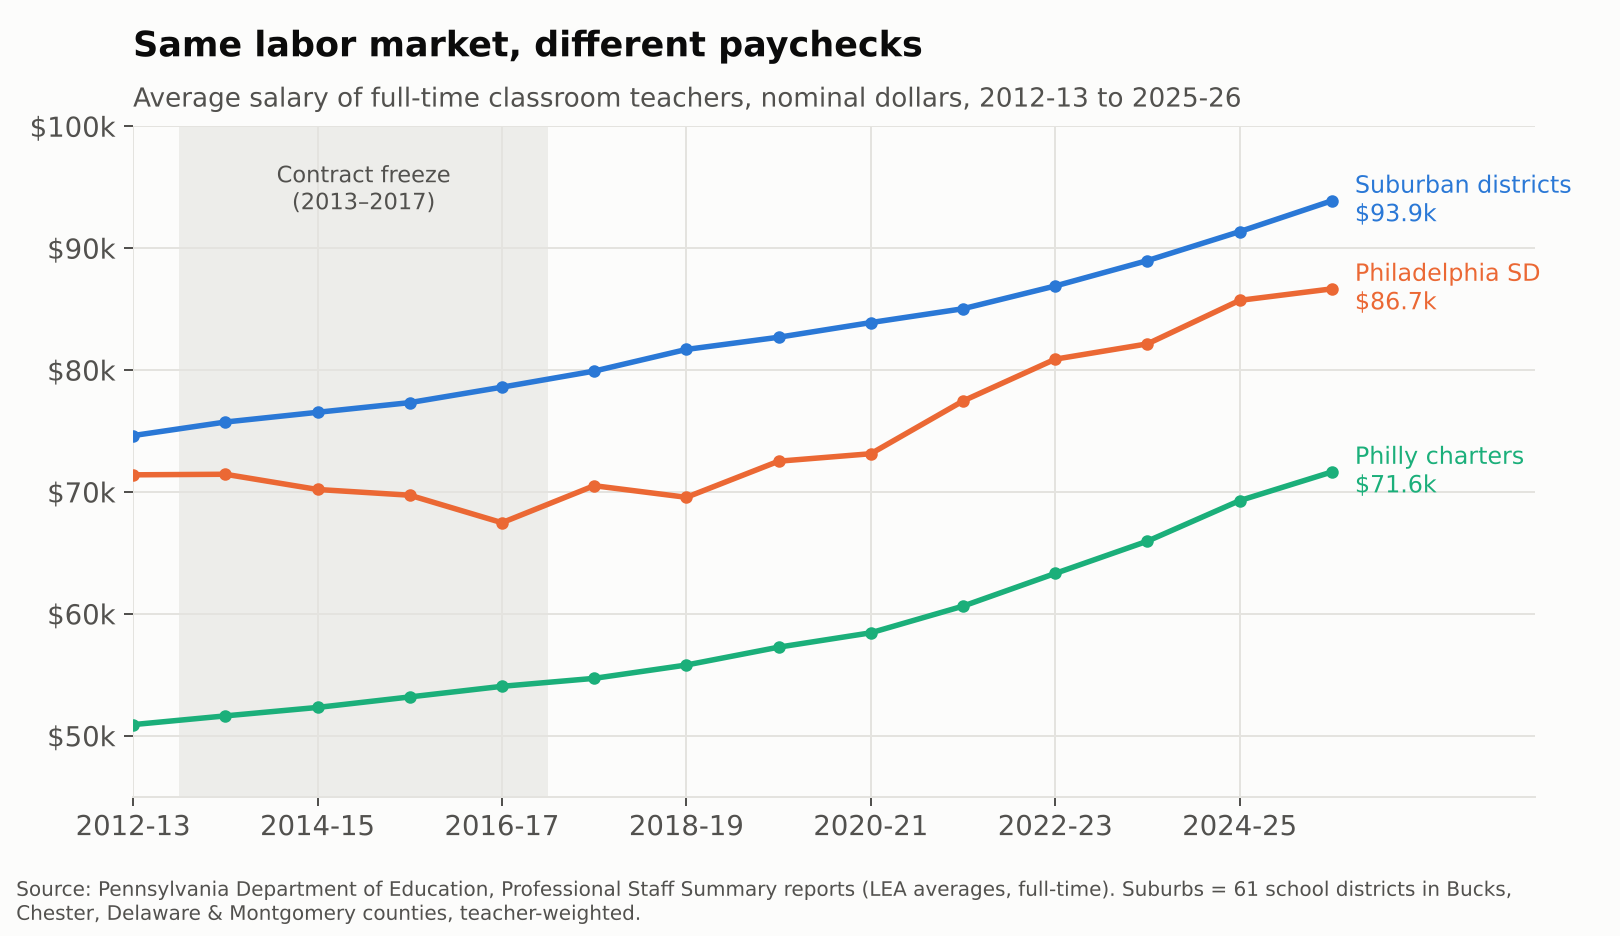
In 2012-13, the average full-time Philadelphia district teacher earned $71,407, about 96% of the suburban average. Then came four years without a contract. By 2016-17, Philly’s average had actually fallen to $67,479 while the suburbs rose to $78,598, a gap of more than $11,000. The district has climbed back since, to $86,664 in 2025-26, but that is still about $7,200 behind the suburbs. Teachers in the city’s charter schools averaged $71,644, roughly three quarters of the suburban figure.
The averages hide where the gap bites. Philadelphia’s current salary scale is competitive in the middle years. Teachers with 5 to 14 years of experience actually earn more than their suburban peers. But the scale flattens at $99,534 after about 15 years. Suburban veterans keep climbing, to a median of about $112,000. A 25-year Philly veteran makes roughly $12,500 less than one in the suburbs.
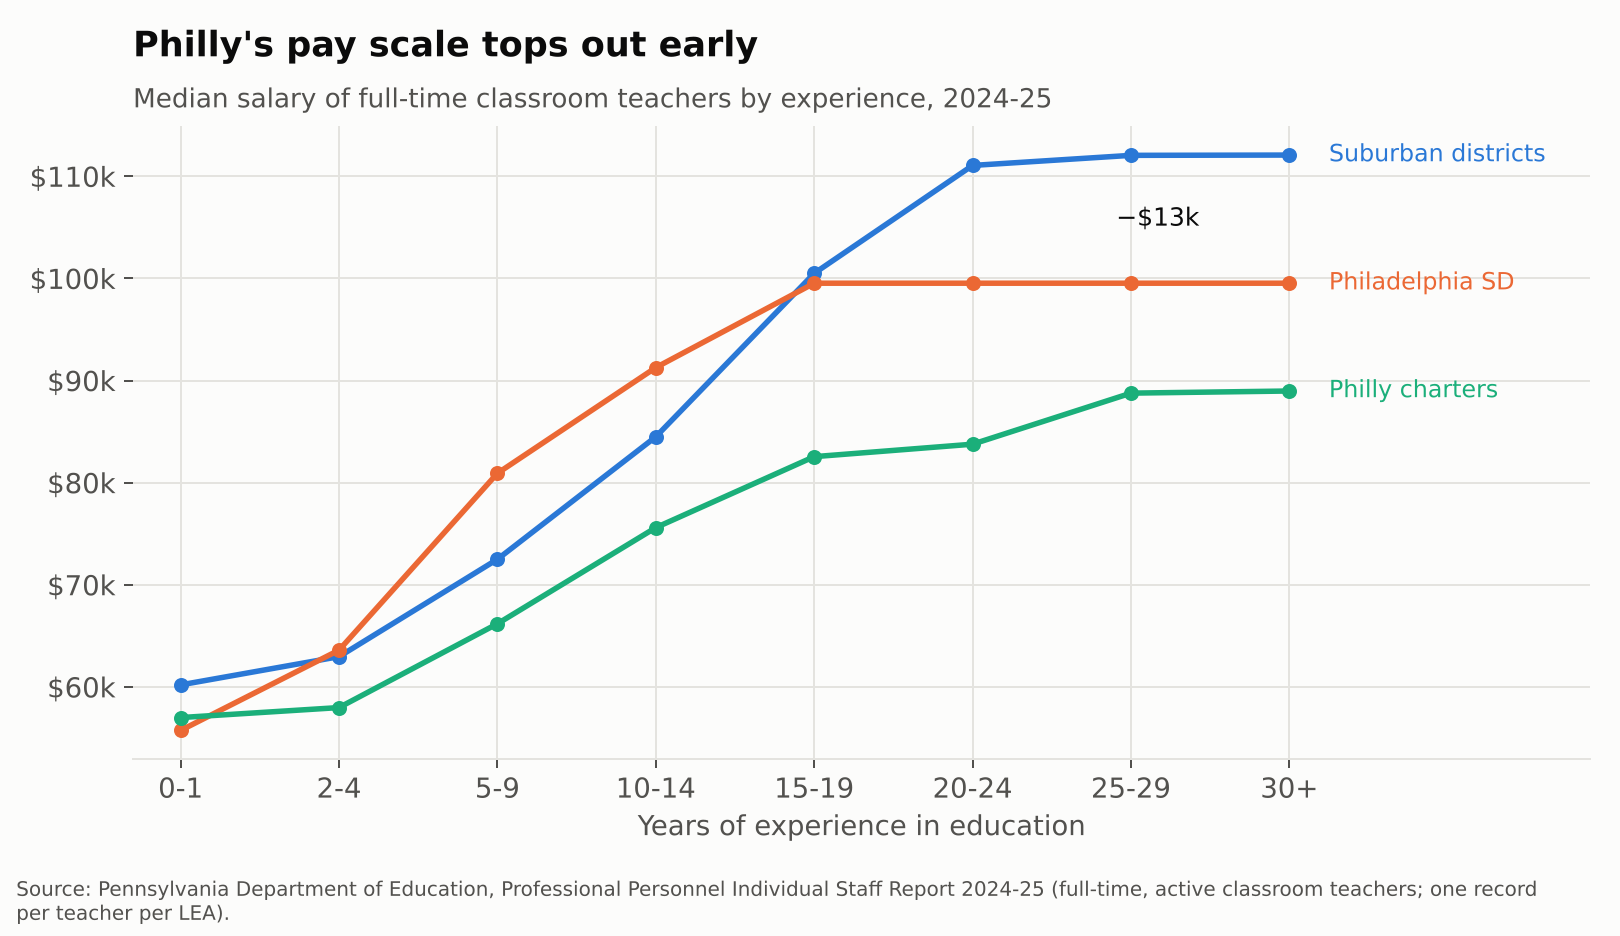
That matters for who stays. Philadelphia district teachers average 13.7 years of experience, vs. 15.6 in the suburbs. Charter teachers average 8.9. Every school needs its Barbara Howards. An underfunded system has the hardest time keeping them.
Inside the building: who is actually in front of the kids
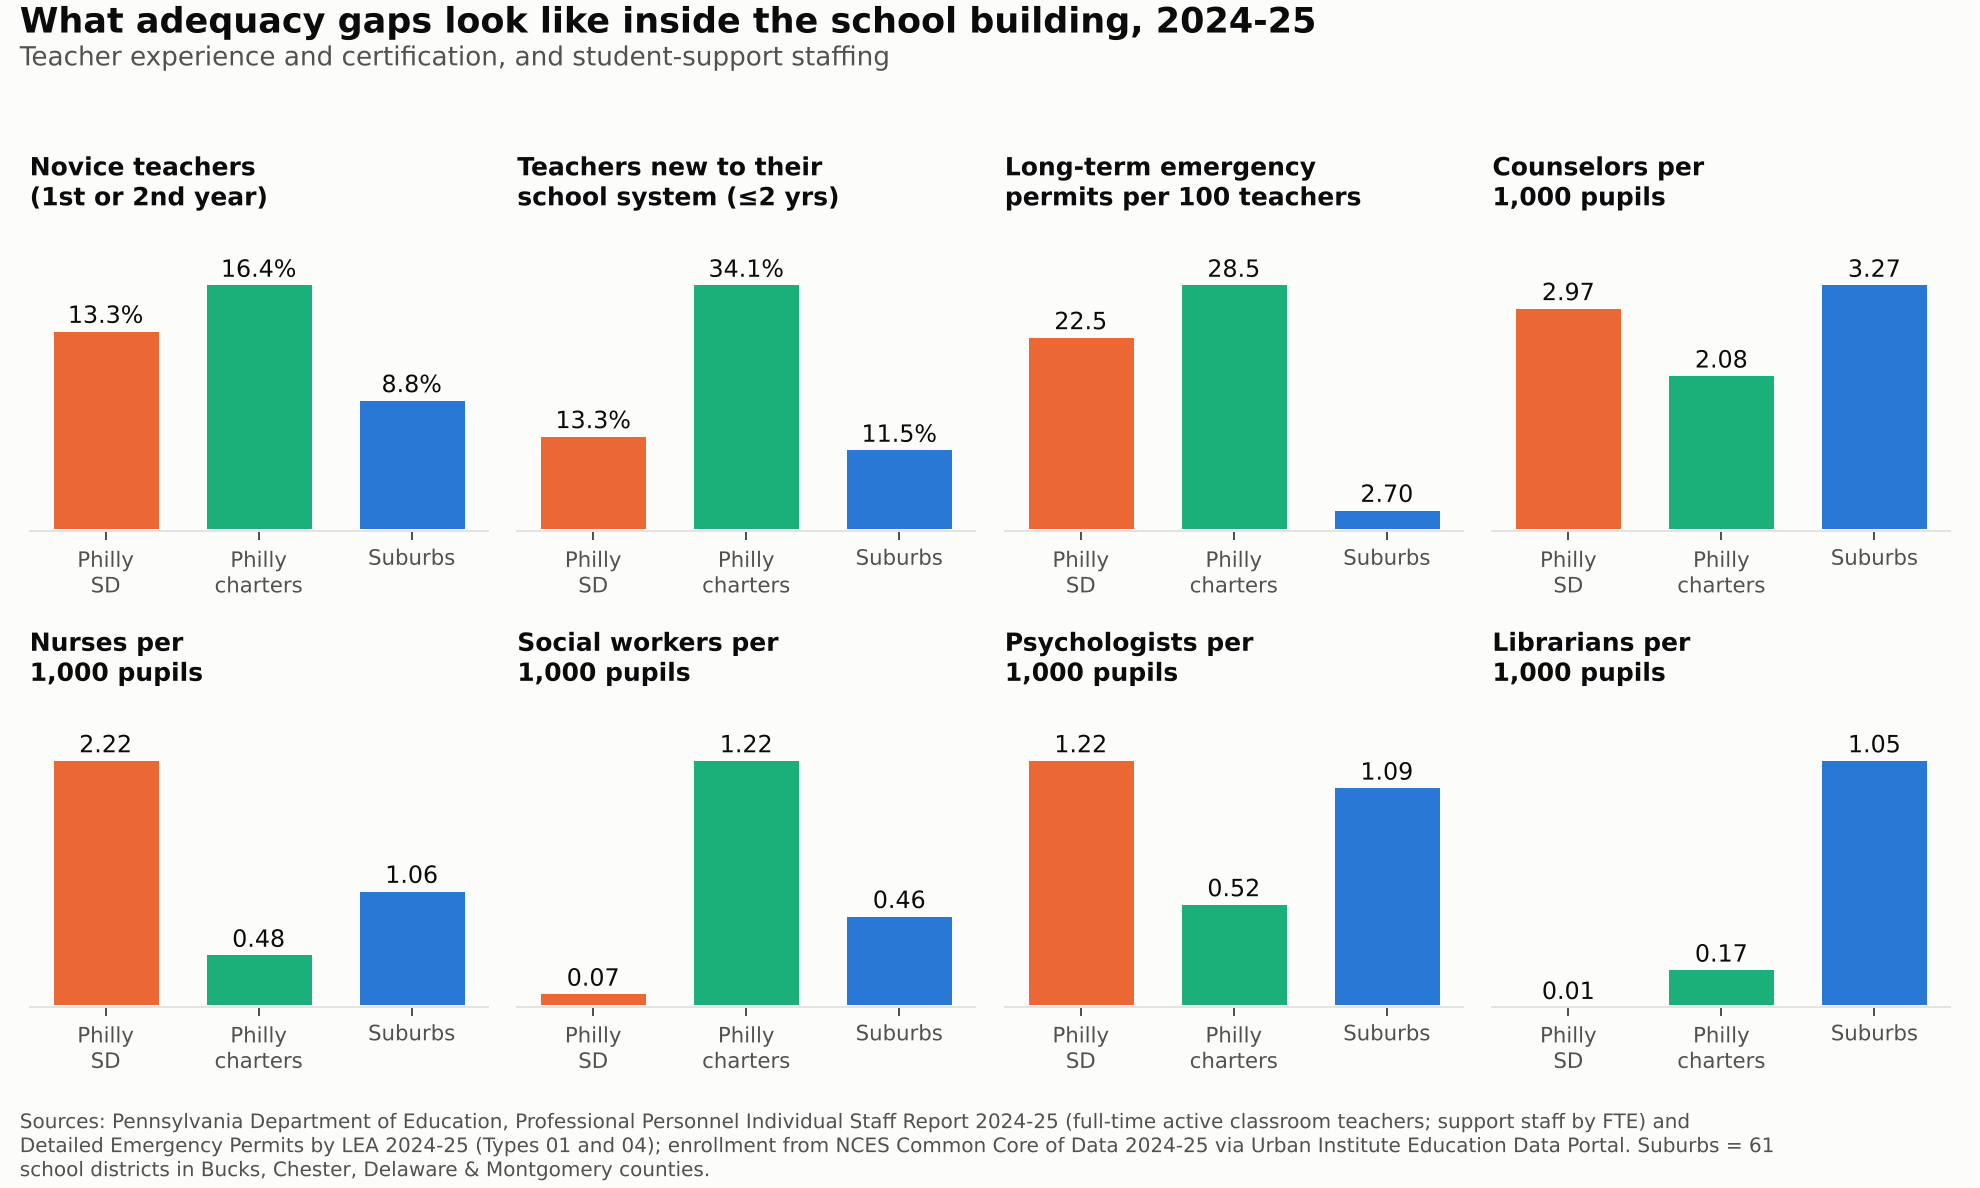
Pennsylvania’s own staff records let us look at who is actually in the classroom, through 2024-25. Janine is not the exception at Abbott. In 2024-25, 13.3% of district teachers were in their first or second year in education, vs. 8.8% in the suburbs. In the city’s charters it was 16.4%, and more than a third of charter teachers had been with their school system for two years or less.
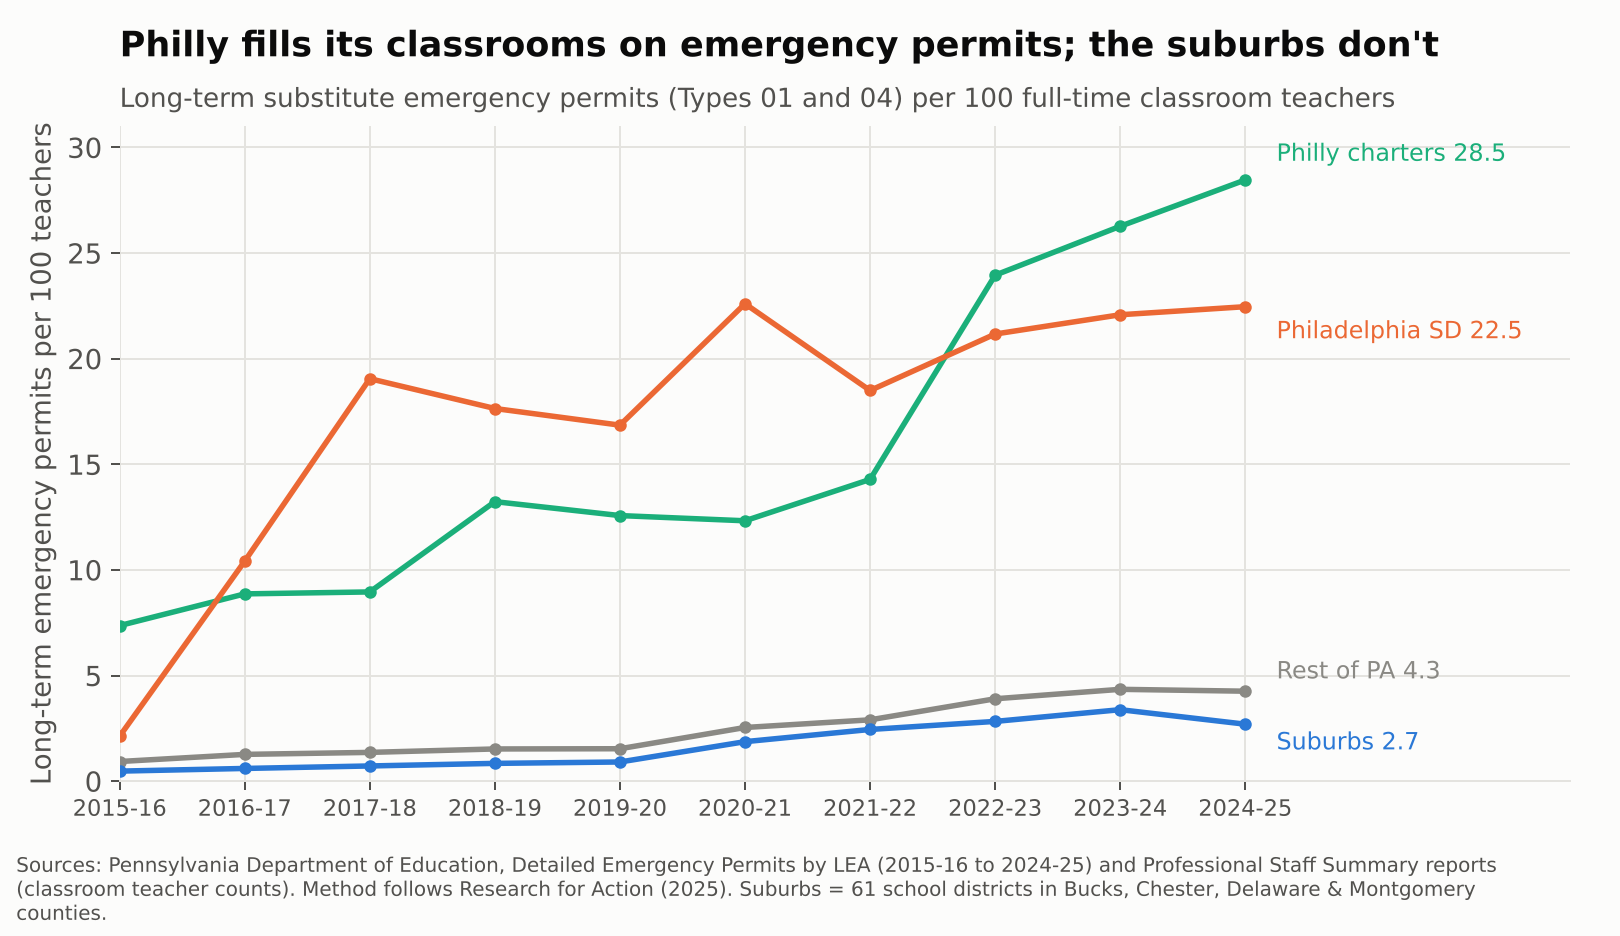
The starkest gap is certification. Pennsylvania lets districts fill vacancies with long-term substitutes on emergency permits when they can’t hire a certified teacher. In 2024-25 the School District of Philadelphia held 22.5 of those permits for every 100 classroom teachers. Philly charters held 28.5. The suburbs held 2.7, and the rest of the state 4.3. Philadelphia’s rate jumped from about 2 to 19 per 100 between 2015-16 and 2017-18, during and right after the contract freeze, and has never come back down.
Support staff tell a more complicated story. After the 2013 layoffs left many schools without counselors or nurses, the district rebuilt. In 2024-25 it reported more nurses and psychologists per 1,000 pupils than the suburbs, and nearly as many counselors (3.0 vs. 3.3). That is what recent money bought. But it is rough parity for students with three times the poverty, and some positions never came back. The district reported 9 social worker FTE and 1 librarian for about 120,000 students. The suburbs had about 148 social workers and 342 librarians for 325,000.
Teachers are also absent more. In the most recent federal data with that measure, 2017-18, 46% of district teachers missed 10 or more days, vs. 38% in the suburbs.
The show is entertaining. The damage is real.
Abbott Elementary works because its teachers are heroic and funny and stubborn. Real Philadelphia teachers are too. But heroism is not a funding formula. Year after year, the data show the same chain: Pennsylvania’s system leaves Philadelphia, Reading, Allentown, Harrisburg and their peers far below what their students need. That shortfall becomes fewer teachers per child, a pay scale that stops rewarding veterans, more novices and uncertified teachers, and libraries with no librarians.
The Commonwealth Court said in 2023 that this system violates the state constitution. The new adequacy aid is a start, and the recent staffing gains show money does show up in classrooms when it arrives. But a district still roughly $10,000 per child short of adequacy in 2022-23 will not close that gap with a few hundred million dollars spread across the state.
Janine shouldn’t have to fix the copier herself. And the kids in her class shouldn’t have to be in a sitcom for anyone to notice.
Data notes and sources
- Adequacy: School Finance Indicators Database, District Cost Database 2026 (v6), National Education Cost Model estimates of required spending to reach national-average outcomes. Spending is current spending per pupil, direct to elementary and secondary education, in current dollars. Years are school years (2023 = 2022-23).
- Suburbs: the 61 regular school districts in Bucks, Chester, Delaware and Montgomery counties, enrollment-weighted unless noted. Metro comparisons for other Pennsylvania cities use Census CBSAs from the NCES Common Core of Data.
- Staffing: teachers per pupil from the NCES Common Core of Data LEA universe; teacher absences from the Civil Rights Data Collection; both via the Urban Institute Education Data Portal. Philadelphia SD figures cover district-run schools; charters report separately.
- Classroom staffing and certification: Pennsylvania Department of Education Professional Personnel Individual Staff Report 2024-25 (teacher experience; counselors, psychologists, nurses, social workers and librarians by FTE) and Detailed Emergency Permits by LEA, 2015-16 to 2024-25. Permit-rate method from Research for Action (2025).
- Teacher pay: Pennsylvania Department of Education, Professional Staff Summary and Professional Personnel Individual Staff reports, full-time classroom teachers.
- Caveats: NECM estimates are model-based and benchmarked to grade 3–8 math and reading outcomes. Emergency permit rates count long-term substitute permits (Types 01 and 04) per full-time classroom teacher, following Research for Action (2025); a permit is not an FTE, so read them as rates of reliance, not exact shares of classrooms. Teacher absences come from the 2017-18 Civil Rights Data Collection, the latest year with that item.
- Related: Rachel Wessler’s earlier Shanker Institute reflection on the show, Heartwarming or Heartbreaking; state budget coverage from WHYY.


