Letter to the New Congress: Project 2027 steps toward Project 2029 – Ending the Era of Stupid and Mean

Dear Members of the 120th Congress,

Start with the premise you’ll hear cited against public education all year: that the United States ranks low in international comparisons. On average, it does — but that average hides a country split in two. In the 2011 NAEP-TIMSS linking study, Massachusetts’s eighth graders scored behind only five of 47 education systems worldwide, trailing just Japan among them, while Alabama’s, the same year, were statistically indistinguishable from Turkey and Armenia. Run the comparison state by state and the picture varies enormously: Massachusetts, New Jersey, New Hampshire, Wyoming, and Connecticut — America’s best states for education — perform like some of the strongest systems on earth, while the states that won’t invest perform like the weakest ones, and it’s their scores dragging the national average down. The problem was never the country; it’s a particular set of states, and the gap between them is widening: cost-adjusted K-12 investment predicts the chain from funding adequacy to NAEP scores to adult degree attainment to state income growth, and the best- and worst-educated states have been pulling apart for decades (Human Capital Pays, If You Count the Cost; the underlying analysis is in Investing in Human Capital: Does Long-Run K-12 Investment Fuel State Economic Growth?). Our future depends on raising the bottom, not averaging it away — and raising the bottom means forcing the states that won’t try to raise themselves, economically as well as educationally, out of the federal dependence the rest of this letter is about undoing.

You are arriving in Washington, I hope, with majorities in both chambers and a mandate to undo a particular kind of damage. For a term and a half of Trump leadership, with Republican control of Congress compounded by Republican control in too many statehouses facing no federal check, federal education policy has run on two settings: stupid and mean. Stupid, because dismantling the Department of Education, gutting NCES and IES, and threatening to claw back aid from states that pursue equity doesn’t actually improve a single classroom — it just leaves the country unable to measure its own failures. Mean, because the one new federal investment of this era, an uncapped tax credit that bankrolls private school tuition with no strings attached, takes effect on January 1, 2027, the same month you’re sworn in, while the children in the states that need the most help keep getting the least. And it hasn’t just been neglect: in Trump 2.0, the Office for Civil Rights has been weaponized against the very students it exists to protect, turned toward fighting equity and fairness rather than enforcing them.

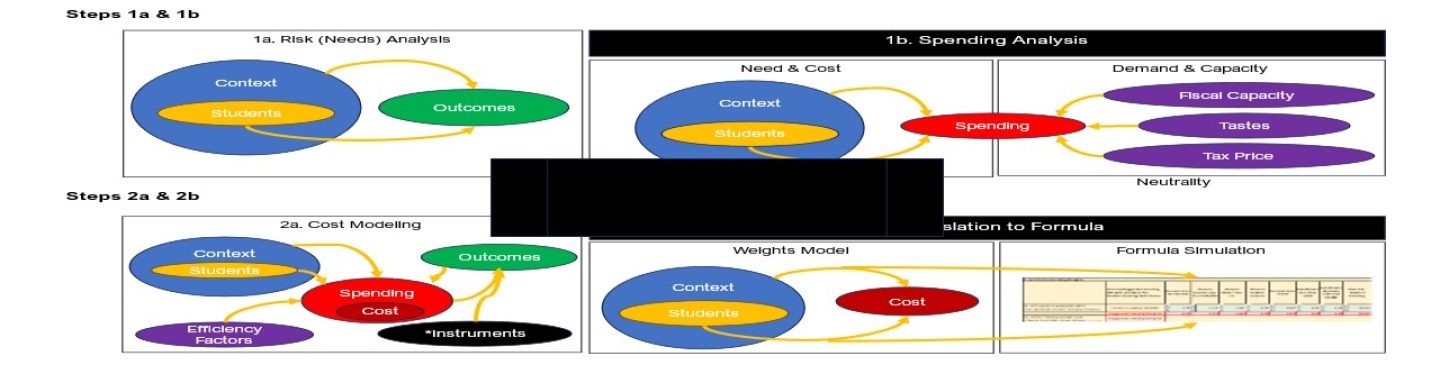
This letter isn’t Project 2029. Project 2029 is the national school finance formula this country needs — a formula that guarantees every child an adequately funded education regardless of which state she happens to live in. I’ve laid out that plan elsewhere, in the working paper this letter is meant to accompany: Equal Educational Opportunity for All: From Short-Term Resistance to Project 2029. Project 2029 cannot be written in a weekend, and it shouldn’t be. It needs a cost model, an effort floor, a legal theory, and data infrastructure that currently doesn’t exist because this administration is actively destroying it. What you can do in 2027 and 2028 — what you must do — is build that foundation. Call it Project 2027. Five tracks, running at the same time.

Track A: Write the adequacy formula into law, even if you phase in the money

With Matthew Di Carlo and Mark Weber, I’ve already specified a federal foundation aid formula that works the way a good state formula works: a national cost model estimates what each district needs to reach common outcome goals; a minimum state-and-local effort requirement, roughly the national average, determines what each state must raise on its own; federal aid fills whatever adequacy gap remains, but only after a state has done its part. In full-compliance simulation, this requires about $52 billion in new federal aid and about $80 billion in new state and local investment, targeted to districts in 34 states. It would take the share of students in inadequately funded districts from about 55 percent to zero, cut the gap between the highest- and lowest-poverty districts by more than 60 percent, and close 59 percent of the Black-white and 49 percent of the Latinx-white funding gap.

You do not have to appropriate all of that in one bill. You do have to authorize the formula, the cost model, and the effort floor now, as a new title of the Elementary and Secondary Education Act, with a multi-year phase-in for states below the floor. Three structural fixes make this real rather than cosmetic:

  • Replace maintenance-of-effort with an effort floor. Current law only requires a state to spend 90 percent of what it spent the year before. A state can sit at the bottom forever and remain compliant. The test should be effort relative to capacity — state and local revenue against gross state product or personal income — not effort against your own prior low bar.
  • Fix Title I’s spending factor. The current formula sends more aid per poor child to states that already spend more, regardless of need. Allocations should track adequacy gaps and effort, not reward states for already having money.
  • Fully fund IDEA. You authorized federal funding of up to 40 percent of the excess cost of educating students with disabilities in 1975. You have never come close. Closing that gap is one of the most direct ways to relieve pressure on low-capacity states without waiting for the broader formula.

Track B: Stop treating “can’t” and “won’t” the same way

Some states can’t fund their schools adequately without help. Others won’t, and currently get backfilled by Washington anyway. I’ve written about both groups at length — in The Dependent States of America and in America’s Worst States for Education — and the formula you authorize in Track A should write the distinction between them directly into statute, not leave it to agency discretion.

GroupExamplesWhat they need
High-effort, low-capacity (“can’t”)Mississippi, New Mexico, West Virginia, AlaskaPrioritized gap-closing aid immediately, no effort hurdle — they’re already taxing near or above the national average and still can’t reach adequacy on their own.
Low-effort, high-capacity (“won’t”)Nevada, Texas, North Carolina, Florida, Arizona, TennesseeRequired to raise their own effort to the national floor before drawing a dollar of gap-closing federal aid.
The same underfunding, two different causes, two different statutory responses.
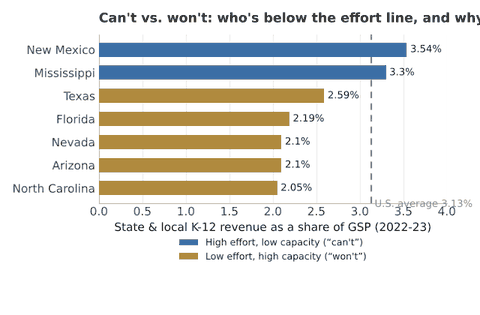
Horizontal bar chart comparing state and local K-12 revenue as a share of gross state product for seven states, colored by whether low funding reflects low capacity ("can't") or low effort ("won't"), against the U.S. average of 3.13 percent.
Figure 1. New Mexico and Mississippi tax themselves near or above the national average and still can’t reach adequacy — that’s capacity. Texas, Florida, Nevada, Arizona, and North Carolina tax themselves well below it — that’s a choice.

North Carolina has the lowest fiscal effort in the nation, 2.05 percent of gross state product, in a large and growing economy. Florida and Arizona would each have roughly 29 and 35 percent more state and local school revenue today had they simply held their 2006 effort levels. These are not capacity problems. Four of the five states on my 2026 worst-states list — North Carolina, Arizona, Nevada, Florida — are literally the four lowest-effort states in the country. And this same logic should apply to the roughly $115 billion in federal aid states already receive, not just new money. Write the effort-floor test into the statute itself, with a bright line rather than a waiver process, so it survives the next administration’s discretion as well as this one’s.
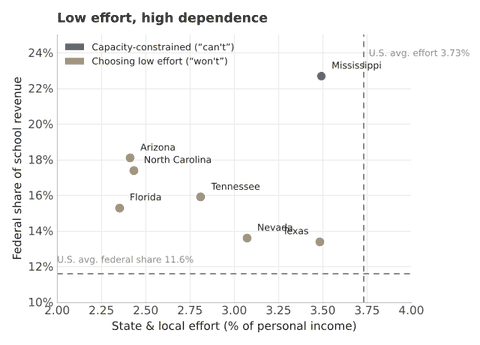
Scatter plot of state and local K-12 funding effort as a percent of personal income against federal share of school revenue for seven states, showing most low-effort states cluster at higher federal dependence than the U.S. average.
Figure 2. Mississippi depends on federal aid because its capacity is low despite near-average effort. Arizona, North Carolina, Tennessee, Florida, Nevada, and Texas combine below-average effort with above-average reliance on Washington — precisely the states an effort floor is meant to reach.

Track C: Give children, not just states, a seat at the table

Several of the states most dependent on federal aid — Arizona and Florida among them — are also where public money now follows parental preference with the fewest strings attached. Arizona’s Empowerment Scholarship Account statute treats a parent’s signature on a funding agreement as compulsory school attendance — no test, no curriculum requirement, no measure of whether the child is learning anything at all. I’ve argued, in Not the Mere Creature of Anyone, that the child in that arrangement is the only party with no rights of her own: she can’t sue her parents for academic neglect, she has no federal constitutional claim, and state courts reviewing these programs increasingly ask whether the public system is harmed, not whether she is being educated.

Congress and ED/OCR don’t need to wait for the full formula to act here. Using existing Title VI, Title IX, IDEA, and Section 504 authority, ED and OCR should put states on notice now that any provider serving a student whose education is subsidized with federal dollars — charter, voucher, or ESA — is bound by the same nondiscrimination and disability obligations as a public school, and that a state’s own voucher statute doesn’t override that. On the legislative side, I’d ask you to:

  • Restore a private right of action under Title VI, closed off by Alexander v. Sandoval (2001), and codify Plyler v. Doe‘s guarantee that every child is entitled to a public education regardless of immigration status.
  • Write “Children’s Recourse” into the conditions on federal aid: register every school-age child in every setting; assess learning rather than attendance or receipts, paired with remediation and, after repeated failure, a required change of setting; keep every child in periodic contact with a mandated reporter; apply neutral accountability conditions, including nondiscrimination and audits, to every provider alike; give older students a voice in decisions about their own schooling; and repeal provisions, like Arizona’s, that deem a signed funding contract to be school attendance.

Draft these as neutral, generally applicable conditions rather than anything targeted at religious providers specifically. That’s not just good policy design — it’s what gives them a chance of surviving whatever the Supreme Court does with St. Mary Catholic Parish v. Roy, Carson v. Makin, and Fulton v. City of Philadelphia. Pierce v. Society of Sisters told us a century ago that the child “is not the mere creature of the State.” She is also not the mere creature of her parents, or of a scholarship-granting organization. Someone has to be answerable to her.

Track D: Rebuild what’s being torn down

None of the above works without data, and the data infrastructure is actively being dismantled. Reauthorize the Education Sciences Reform Act with statutory independence and protected funding for NCES and IES. Codify the Census Bureau’s school finance survey and school-level per-pupil spending reporting, which current law already calls for but which has been unevenly enforced. Fund the cost-modeling capacity the formula in Track A depends on. Project 2029 cannot be built on data that no longer exists by 2029, and right now, that’s the trajectory.

Track E: Shut down the federal voucher tax credit before it starts

The One Big Beautiful Bill Act created the Education Freedom Tax Credit: a nonrefundable, dollar-for-dollar federal tax credit of up to $1,700 per taxpayer for donations to scholarship-granting organizations, with no cap on the total amount of credits the federal government will honor nationally. States have to opt in, and at least 29 already have, several after Democratic governors vetoed the opt-in bill only to be overridden by their own legislatures. The program takes effect January 1, 2027. It carries no learning-assessment requirement, no nondiscrimination requirement, no transparency requirement — none of the accountability conditions that would make it defensible even on its own terms.

There is already a bill sitting in the Senate Finance Committee: S. 4297, the Keep Public Funds in Public Schools Act, introduced by Senator Mark Kelly with 29 Democratic and two independent cosponsors. Pass it, or fold its repeal into the first must-pass vehicle you move. Every other track in this letter is about building better-targeted federal investment in public education. None of it makes sense while an uncapped federal subsidy for private tuition runs in the opposite direction, unmeasured and unaccountable, the same month you take your seats. Stop the bleeding before it starts.

Why this has to be done this way

Spending Clause conditions have to be clearly stated, related to the purpose of the funds, and not so coercive that states have no real choice — that’s South Dakota v. Dole, and it’s not optional. That’s the argument for attaching every new condition in this letter to new adequacy aid, phased in, rather than threatening to claw back money states already depend on. It’s also the sharpest possible contrast with the era you’re inheriting, in which federal aid has been wielded as a political weapon against the states trying to do right by their kids, while states doing the least get the most cover. Project 2027 is not Project 2029. It’s the authorizing statute, the cost model, the effort floor, the data, and the legal architecture that make Project 2029 possible to build in the first place — so that when the country is finally ready to guarantee every child an adequate education, it isn’t starting from nothing.

What the Education States can do in the meantime

Congress will not move on anyone’s timeline but its own, and in the meantime, children are still sitting in classrooms in states that won’t try. That work falls, for now, to what I’ve called the Education States — a group that isn’t exclusively blue or northern; Kansas qualifies. Three things they can do, starting now, to help and to put pressure on the rest: backfill threatened federal aid with their own state funds rather than letting students absorb the loss, much as southern states once used state aid to resist federal civil rights enforcement, but turned toward adequacy instead of evasion; keep building the school-finance and outcomes data infrastructure Washington is actively abandoning, so that when Project 2029 is ready to be built, the evidence base doesn’t have to be rebuilt from nothing; and use their own example, consistently and loudly, to make low effort a political liability rather than a free pass — every Education State governor and legislature who says out loud that Texas, Florida, and North Carolina could afford to fund their schools and choose not to, makes the case for Track B’s effort floor better than any formula can on its own.

Sincerely,
Bruce D. Baker

Sources

Related reading: Equal Educational Opportunity for All: From Short-Term Resistance to Project 2029, the working paper this letter sets the stage for.
The Education States that will Lead the Way

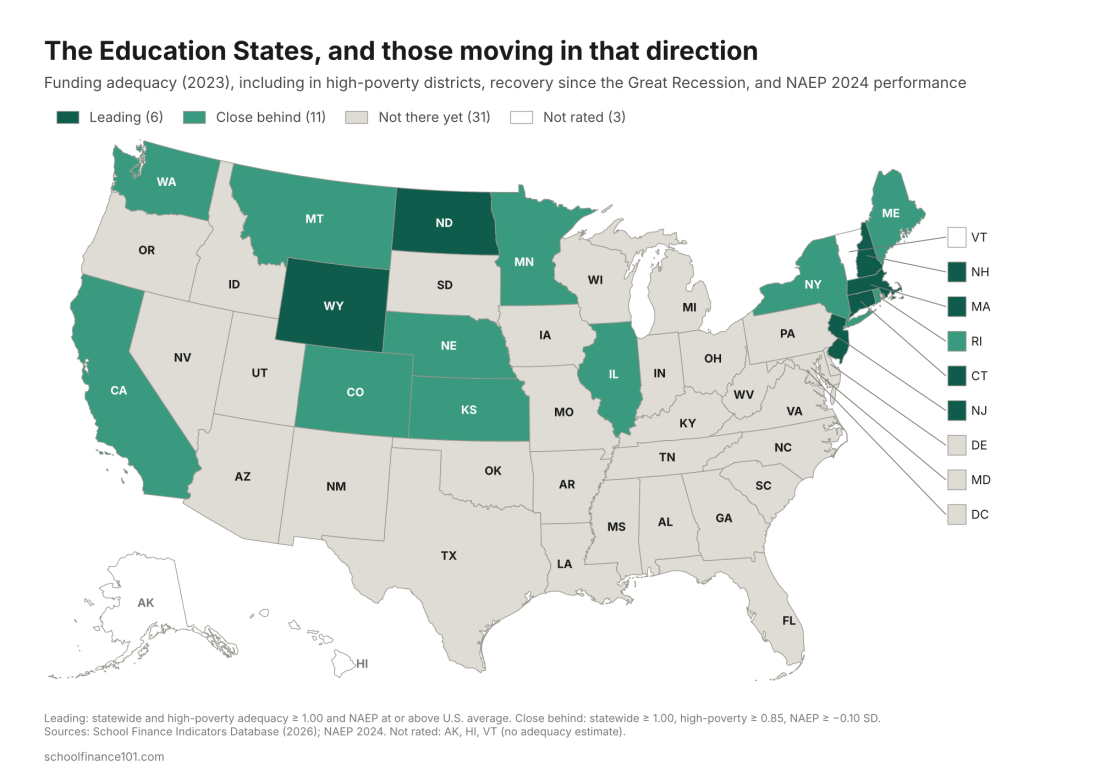
U.S. map classifying states as Leading, Close behind, or Not there yet on school funding adequacy and NAEP performance

In my last post I described the Dependent States of America: the states, mostly red, whose schools lean most heavily on federal aid, in many cases because they have chosen to underinvest in their own children. This post looks at the other end of the spectrum. These are the states that fund their schools adequately, including the schools serving the poorest children, and that perform well. And they include the states that, after letting their school funding collapse in the Great Recession, eventually chose to reinvest.

In an earlier working paper, I called these the Education States. They are states where courts have been willing to uphold and enforce education rights, where legislators and governors have funded those rights whether a court ordered them to or not, and which are now positioned to protect their own students while the federal government retreats. I noted then that the Education States are not exclusively blue or northern. The data bear that out, though not by much.

Measuring an Education State

I use three measures. The first two come from the School Finance Indicators Database (SFID), 2026 release, which covers school years through 2023. Funding adequacy compares what districts actually spend per pupil with what our National Education Cost Model estimates they would need to spend to reach national average test scores, given their students’ needs and regional costs. A ratio of 1.00 means spending is exactly adequate; 0.75 means districts spend three-quarters of what they need. I look at adequacy statewide and in each state’s highest-poverty fifth of districts, because a state can be well funded on average while its poorest districts are left behind. The third measure is performance: each state’s 2024 NAEP scores in grade 4 and grade 8 reading and math, expressed as standard deviations above or below the national public school average.

From these, I sort states into three groups:

  • Leading: adequate funding statewide and in high-poverty districts (both ratios at or above 1.00), with NAEP performance at or above the national average.
  • Close behind: adequate statewide, high-poverty districts at 85% of adequate or better, and NAEP at or above, or within 0.10 standard deviation of, the national average.
  • Not there yet: everyone else.
U.S. map classifying states as Leading, Close behind, or Not there yet on school funding adequacy and NAEP performance

Six states lead: Massachusetts, New Jersey, Connecticut, New Hampshire, Wyoming and North Dakota. Eleven more are close behind, including New York, Maine, Rhode Island, Minnesota, Washington, Colorado, California and Illinois, along with Kansas, Nebraska and Montana. The remaining 31, including nearly the entire South, are not there yet, though several of them are moving in the right direction. (Alaska, Hawaii and Vermont aren’t rated, because the cost model can’t produce reliable estimates for them.)

Funding and performance go together, though not perfectly. Across states, the correlation between statewide adequacy and NAEP performance is about 0.45. Every leading state performs above the national average, with Massachusetts (+0.27 SD) and New Jersey (+0.18) at the top.

The Great Divergence

The Great Recession hit every state’s school budget. What separates the Education States from the rest is what happened next.

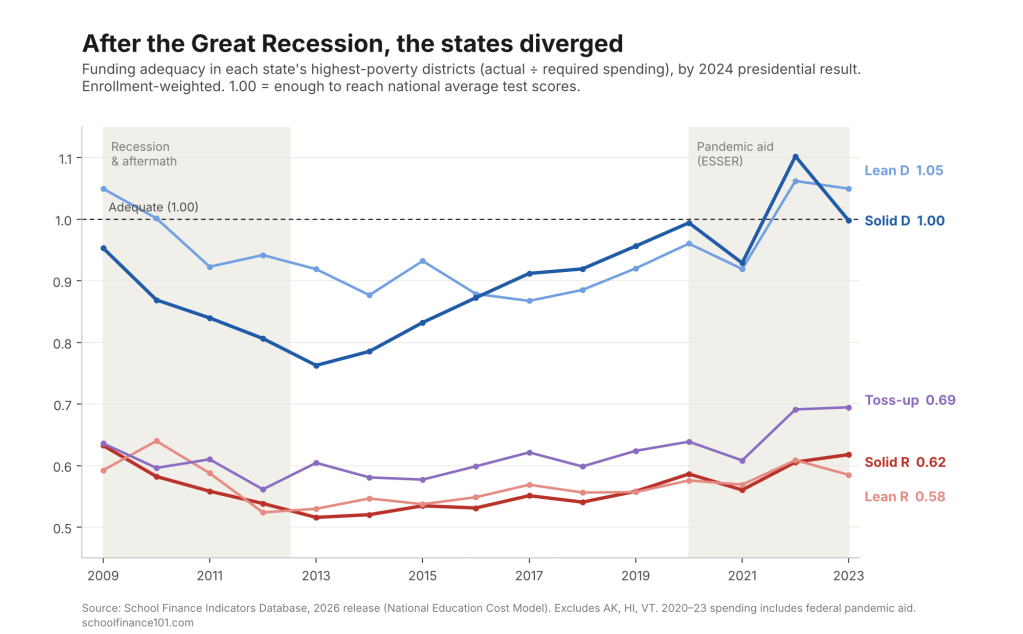
Line chart of funding adequacy in high-poverty districts, 2009 to 2023, by 2024 presidential result: Democratic-leaning states recovered to about 1.0 while Republican-leaning states stayed near 0.6

Nationally, adequacy in high-poverty districts fell from 0.79 in 2009 to 0.66 by 2013. Those districts spent, on average, about two-thirds of what they needed. In the states Harris carried by 10 points or more, high-poverty adequacy dropped from 0.95 to 0.76 at its 2013 low. Then those states climbed back steadily, reaching 0.96 by 2019, before any federal pandemic aid arrived, and about 1.00 by 2023. In the states Trump carried by 10 or more, high-poverty adequacy fell from an already low 0.63 to 0.52, crept back only to 0.56 by 2019, and stood at 0.62 in 2023, still below where it was in 2009.

In other words, the gap between blue and red states’ highest-poverty districts was wide before the recession (about 0.32) and wider after the recovery (about 0.40 in 2019). Both groups cut their effort. In 48 of the 50 states with data, state and local school revenue is a smaller share of personal income today than in 2008; only Illinois and Hawaii are exceptions. But the median solidly Democratic state’s effort fell from 4.3% to 3.8%, while the median Lean R state’s fell from 3.8% to 2.4%, a decline of more than a third.

2024 resultStatesStatewide adequacy, 2023High-poverty adequacy, 2009Post-recession lowHigh-poverty adequacy, 2023Effort, 2008 → 2023NAEP 2024Leading / Close behind
Solid R (R+10 or more)240.820.630.520.624.3% → 3.5%0.002 / 3
Lean R (R+2 to 10)40.770.590.520.583.8% → 2.4%−0.050 / 0
Toss-up (margin under 2)31.130.640.560.694.8% → 4.1%+0.030 / 0
Lean D (D+2 to 10)61.311.050.881.054.5% → 3.6%+0.012 / 2
Solid D (D+10 or more)141.240.950.761.004.3% → 3.8%0.002 / 6
United States511.010.790.660.834.3% → 3.6%0.006 / 11
Adequacy = actual current spending per pupil ÷ spending required to reach national average test scores (SFID National Education Cost Model); 1.00 = exactly adequate. Group values are enrollment-weighted (pooled); high-poverty = each state’s highest-poverty fifth of districts. Post-recession low is the lowest value between 2010 and 2016. Effort = state and local school revenue as a share of personal income, median state. NAEP 2024 = average of grade 4 and 8 reading and math, in national standard deviations from the national public average, simple mean across states. Leading / Close behind = number of states in each group. Adequacy not estimated for Alaska, Hawaii or Vermont. Sources: School Finance Indicators Database (2026 release); NAEP; FEC 2024 certified results.

The pattern by political leaning is stark. In states Harris carried, by any margin, high-poverty districts are funded at or near adequate levels on average. In states Trump carried by any margin, they are funded at about 60% of adequate, and that hasn’t changed in fifteen years. The three toss-up states, Michigan, Pennsylvania and Wisconsin, look like their politics: adequately funded on average but with their poorest districts well short, at 0.69.

Average NAEP performance by group is close to the national average across the board. That is partly because group averages blend high and low performers, and partly because performance depends on much more than funding, including child poverty, which is higher in many red states. It’s not that funding doesn’t matter. The leading states all outperform. But money is a necessary condition, not a sufficient one.

The Education States, by name

StateStatewide adequacyHigh-poverty adequacy: 2009 → low → 2023EffortNAEPRein­vested2024 margin
Leading
Wyoming1.802.10 → 1.78 → 1.933.71%+0.15R+45.8
New Hampshire2.071.45 → 1.31 → 1.543.34%+0.16YesD+2.8
New Jersey1.691.38 → 1.10 → 1.265.16%+0.18D+5.9
Massachusetts1.541.36 → 0.99 → 1.153.23%+0.27D+25.2
North Dakota1.330.90 → 0.71 → 1.123.51%+0.09YesR+36.5
Connecticut1.571.36 → 1.13 → 1.074.07%+0.11D+14.5
Close behind
New York1.461.22 → 1.00 → 1.095.02%−0.03D+12.6
Maine1.561.11 → 0.93 → 1.093.73%−0.07D+6.9
Washington1.350.74 → 0.66 → 0.963.38%+0.04YesD+18.2
Rhode Island1.321.04 → 0.82 → 0.943.82%0.00D+13.8
Colorado1.160.73 → 0.56 → 0.923.04%+0.14YesD+11.0
Minnesota1.180.78 → 0.74 → 0.923.47%+0.10D+4.2
Kansas1.140.99 → 0.76 → 0.914.16%0.00R+16.1
Montana1.070.75 → 0.71 → 0.912.76%+0.09YesR+19.9
Nebraska1.130.92 → 0.87 → 0.893.69%+0.03R+20.5
California1.090.59 → 0.46 → 0.894.03%−0.08YesD+20.1
Illinois1.140.69 → 0.66 → 0.874.68%+0.05YesD+10.9
Adequacy and effort are for 2023; NAEP is 2024, in standard deviations from the national public average. Leading: statewide and high-poverty adequacy both at or above 1.00, and NAEP at or above the national average. Close behind: statewide adequacy at or above 1.00, high-poverty adequacy at least 0.85, and NAEP within 0.10 SD of the national average or above it. Reinvested: high-poverty adequacy gained at least 0.15 from its 2010–2016 low, had already gained at least 0.08 by 2019 (before pandemic aid), and by 2023 exceeded its 2009 level. Row shading shows 2024 presidential leaning: solid red/blue = margin of 10+ points; pale red/blue = 2 to 10 points. Sources: School Finance Indicators Database (2026 release); NAEP 2024; FEC 2024 certified results.
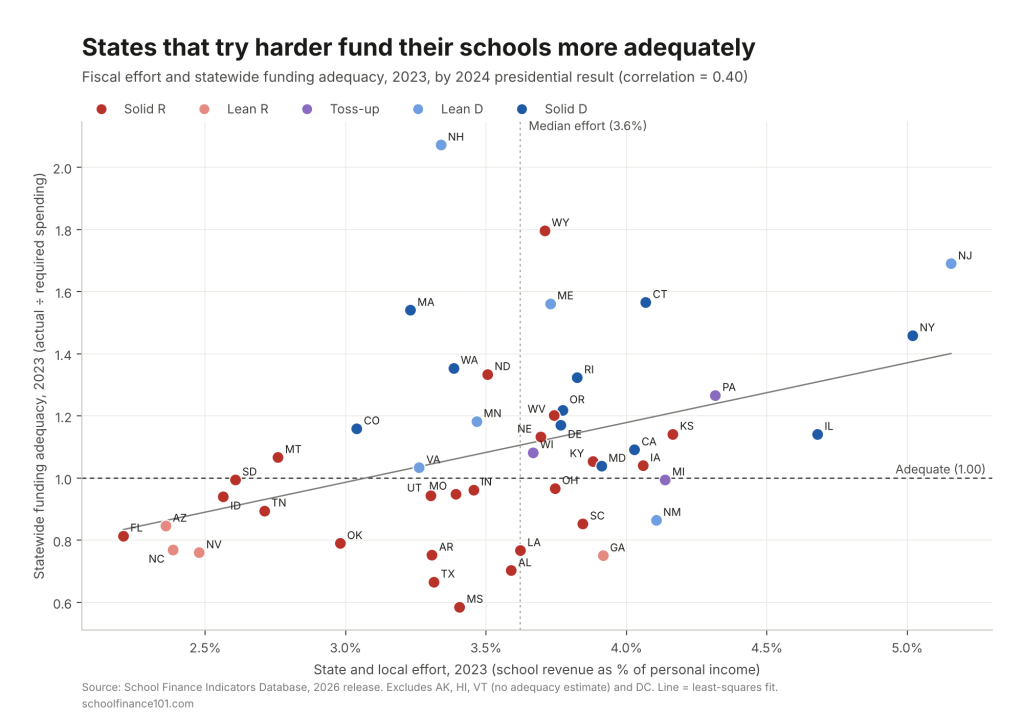
Scatterplot of state and local school funding effort against statewide funding adequacy in 2023, with states colored by 2024 presidential result; low-effort, low-adequacy states are mostly Republican-leaning

Effort explains a good share of the difference. Across the 47 states with estimates (excluding DC), state and local effort and statewide adequacy are correlated at about 0.40. Of the 23 states putting in less than the median effort (3.6% of personal income), 17 voted for Trump, and only 8 fund their schools adequately statewide. Of the 24 at or above the median, 18 do. Twenty-one states fall below adequacy statewide, and 19 of them voted for Trump. The exceptions run in both directions. New Hampshire, Massachusetts, Washington and Colorado reach adequacy with below-median effort because they are wealthy. Georgia, South Carolina and New Mexico put in above-median effort and still fall short, because their capacity is lower and their needs are higher. But the lower-left corner of the chart, low effort and inadequate funding, belongs almost entirely to Republican-leaning states: Florida, Arizona, North Carolina, Nevada, Idaho, Tennessee and Oklahoma.

Of the 17 leading and close-behind states, 12 voted for Harris and five for Trump. The red Education States fall into two types. Wyoming and North Dakota are small, energy-rich states that can fund adequate schools without exceptional effort. Wyoming’s effort has actually fallen from 5.8% of personal income in 2008 to 3.7%, but its funding is built on decades of court-enforced adequacy under the Campbell County decisions. Kansas, Nebraska and Montana are more traditional Plains states with long-standing commitments to their public schools. Kansas, in particular, was pulled back by its courts. After deep cuts under Governor Brownback, the Gannon litigation forced a multi-year reinvestment that the Kansas Supreme Court finally approved in 2019. Its high-poverty adequacy, stuck at 0.75 as late as 2019, reached 0.91 by 2023.

Nor is being blue enough. Maryland (high-poverty adequacy 0.71), Virginia (0.68), New Mexico (0.67) and Delaware (0.98, but with NAEP well below average) are all “not there yet.” And several of the leading states have slipped. Connecticut’s high-poverty districts went from 1.36 in 2009 to 1.07, and New Jersey’s from 1.38 to 1.26. Both are still adequate, but the margin is narrower than it was.

The states that eventually reinvested

The most hopeful part of the story is the states that hit bottom after the recession and then chose to rebuild, mostly through new funding formulas, often prompted by litigation, and mostly well before federal pandemic aid arrived.

  • California adopted the Local Control Funding Formula in 2013, directing additional funding to low-income students and English learners. High-poverty adequacy rose from 0.46 in 2012 to 0.74 by 2019 and 0.89 by 2023, the largest gain of any state.
  • Washington, under the state supreme court’s 2012 McCleary decision, overhauled its funding in 2017 and 2018. High-poverty adequacy rose from 0.66 to 0.96.
  • Illinois replaced one of the nation’s most regressive systems with its Evidence-Based Funding formula in 2017, and is one of only two states whose effort is higher now than in 2008. High-poverty adequacy rose from 0.66 to 0.87.
  • Oregon passed the Student Success Act in 2019. High-poverty adequacy rose from 0.63 to 0.99 by 2019 and stood at 0.94 in 2023.
  • Colorado rose from 0.56 to 0.92 even before eliminating its “budget stabilization factor” in 2024. That change isn’t yet in these data.
  • Massachusetts and New Jersey, both already adequate, recommitted through the Student Opportunity Act (2019) and New Jersey’s 2018 school funding reform (S2), respectively, reversing post-recession erosion.

A second wave of reinvestment is too recent to show fully in data that end in 2023. Kansas is one example. Maryland’s Blueprint for Maryland’s Future, enacted in 2021, has moved high-poverty adequacy from 0.53 in 2019 to 0.71. New Mexico, responding to the 2018 Yazzie/Martinez ruling, has moved from 0.48 to 0.67. Michigan’s 2023 budgets began to fund its new Opportunity Index. Pennsylvania’s Commonwealth Court declared the state’s system unconstitutional in 2023, and the legislature has begun adding adequacy funding. Whether these states become Education States depends on whether they sustain the effort.

Not every state that recovered deserves the credit. Arizona, Tennessee, South Dakota and Missouri also improved high-poverty adequacy from their post-recession lows, but their effort kept falling. Arizona’s dropped from 3.7% of personal income in 2008 to 2.4%, and Tennessee’s from 3.4% to 2.7%. Their gains came from economic growth, not renewed commitment, and several are now expanding universal vouchers that will pull money away from the public districts these figures describe. Utah is the more convincing case: its high-poverty districts are now at 0.94 of adequate and its students outperform the national average by 0.15 SD.

Then there are the states that never came back. Florida’s high-poverty adequacy is lower now (0.70) than in 2009 (0.76), and its effort has fallen from 3.8% to 2.2%, the lowest in the country. North Carolina (0.61 to 0.55; effort 3.6% to 2.4%) and Texas (0.56 to 0.52) followed the same path. Iowa, whose high-poverty districts were adequately funded in 2009 (1.01), has slid to 0.82.

Leading the way

The Great Recession was a natural experiment in political will. Every state took a hit. Some states rebuilt, usually because courts insisted or because legislatures and governors decided their poorest children deserved better. Others took the opportunity to cut taxes and never looked back. Fifteen years later, the result is two countries: one where children in high-poverty districts attend schools funded at roughly the level needed to reach national average outcomes, and one where they attend schools funded at about 60% of that level.

The Education States now carry a double burden. In the short term, they must protect their own students from a federal administration that is withholding funds, dismantling the Department of Education and targeting equity itself. That means backfilling lost federal aid, building their own data capacity as NCES and IES are hollowed out, setting aside reserves (as I’ve proposed, through federally tax-exempt education endowments), and closing the door to publicly funded religious and discriminatory schooling by tightening charter oversight before the courts force it open.

In the longer term, they are the model for Project 2029. The states that reinvested after the recession show that the decline is a choice and can be reversed. They also show what reversing it takes: a cost-based formula, a commitment of state revenue, and in most cases a court willing to hold the state to its constitution. A federal foundation aid formula of the kind we’ve proposed would ask every state to do what California, Washington, Illinois and Kansas did, with federal help for states whose capacity genuinely falls short. The Education States have already shown the rest of the country the way. The question is whether the rest of the country will follow.


Data notes

  • Adequacy, effort and spending figures are from the School Finance Indicators Database, State Indicators Database, 2026 release (school years through 2023). Adequacy is actual current spending per pupil divided by required spending per pupil, estimated by the SFID National Education Cost Model to reach national average test scores. The model doesn’t produce estimates for Alaska, Hawaii, or Vermont after 2016, and SFID advises caution in interpreting New York’s estimates.
  • 2020 to 2023 spending includes some federal pandemic relief (ESSER) funds, which raise adequacy in absolute terms in those years. For that reason, the reinvestment test requires that recovery was already under way by 2019. Effort is a strictly state and local measure and is unaffected.
  • Group adequacy figures are enrollment-weighted, pooling all states in each group. Effort and NAEP group figures are median and simple mean across states, respectively. Effort is state and local school revenue as a share of aggregate personal income.
  • NAEP performance is the average of 2024 grade 4 and grade 8 reading and math scale scores, each expressed as the difference from the national public school average divided by the national standard deviation (NAEP Data Service).
  • Political leaning is based on the statewide popular-vote margin in the 2024 presidential election (FEC certified results). Solid = 10 points or more; Lean = 2 to 10 points; Toss-up = under 2 points.
  • Baker, B. D., Di Carlo, M., & Weber, M. (2026). The Adequacy and Fairness of State School Finance Systems (8th ed.). Albert Shanker Institute, University of Miami and Rutgers Graduate School of Education.

The Dependent States of America

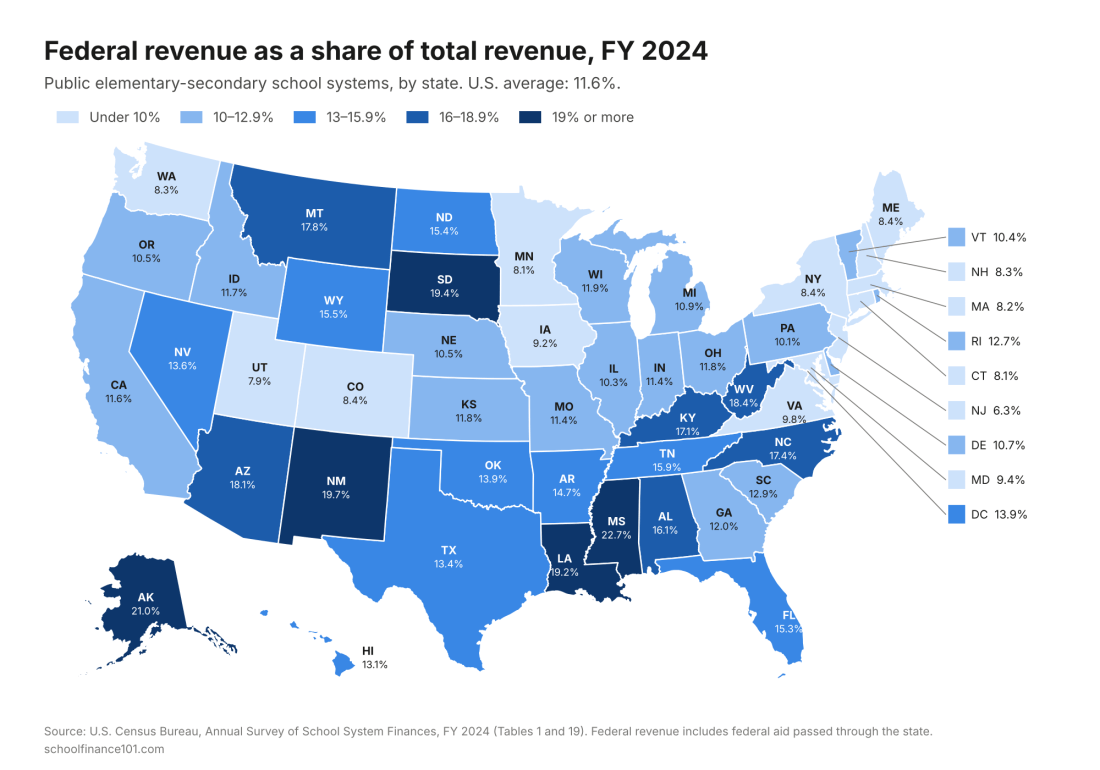
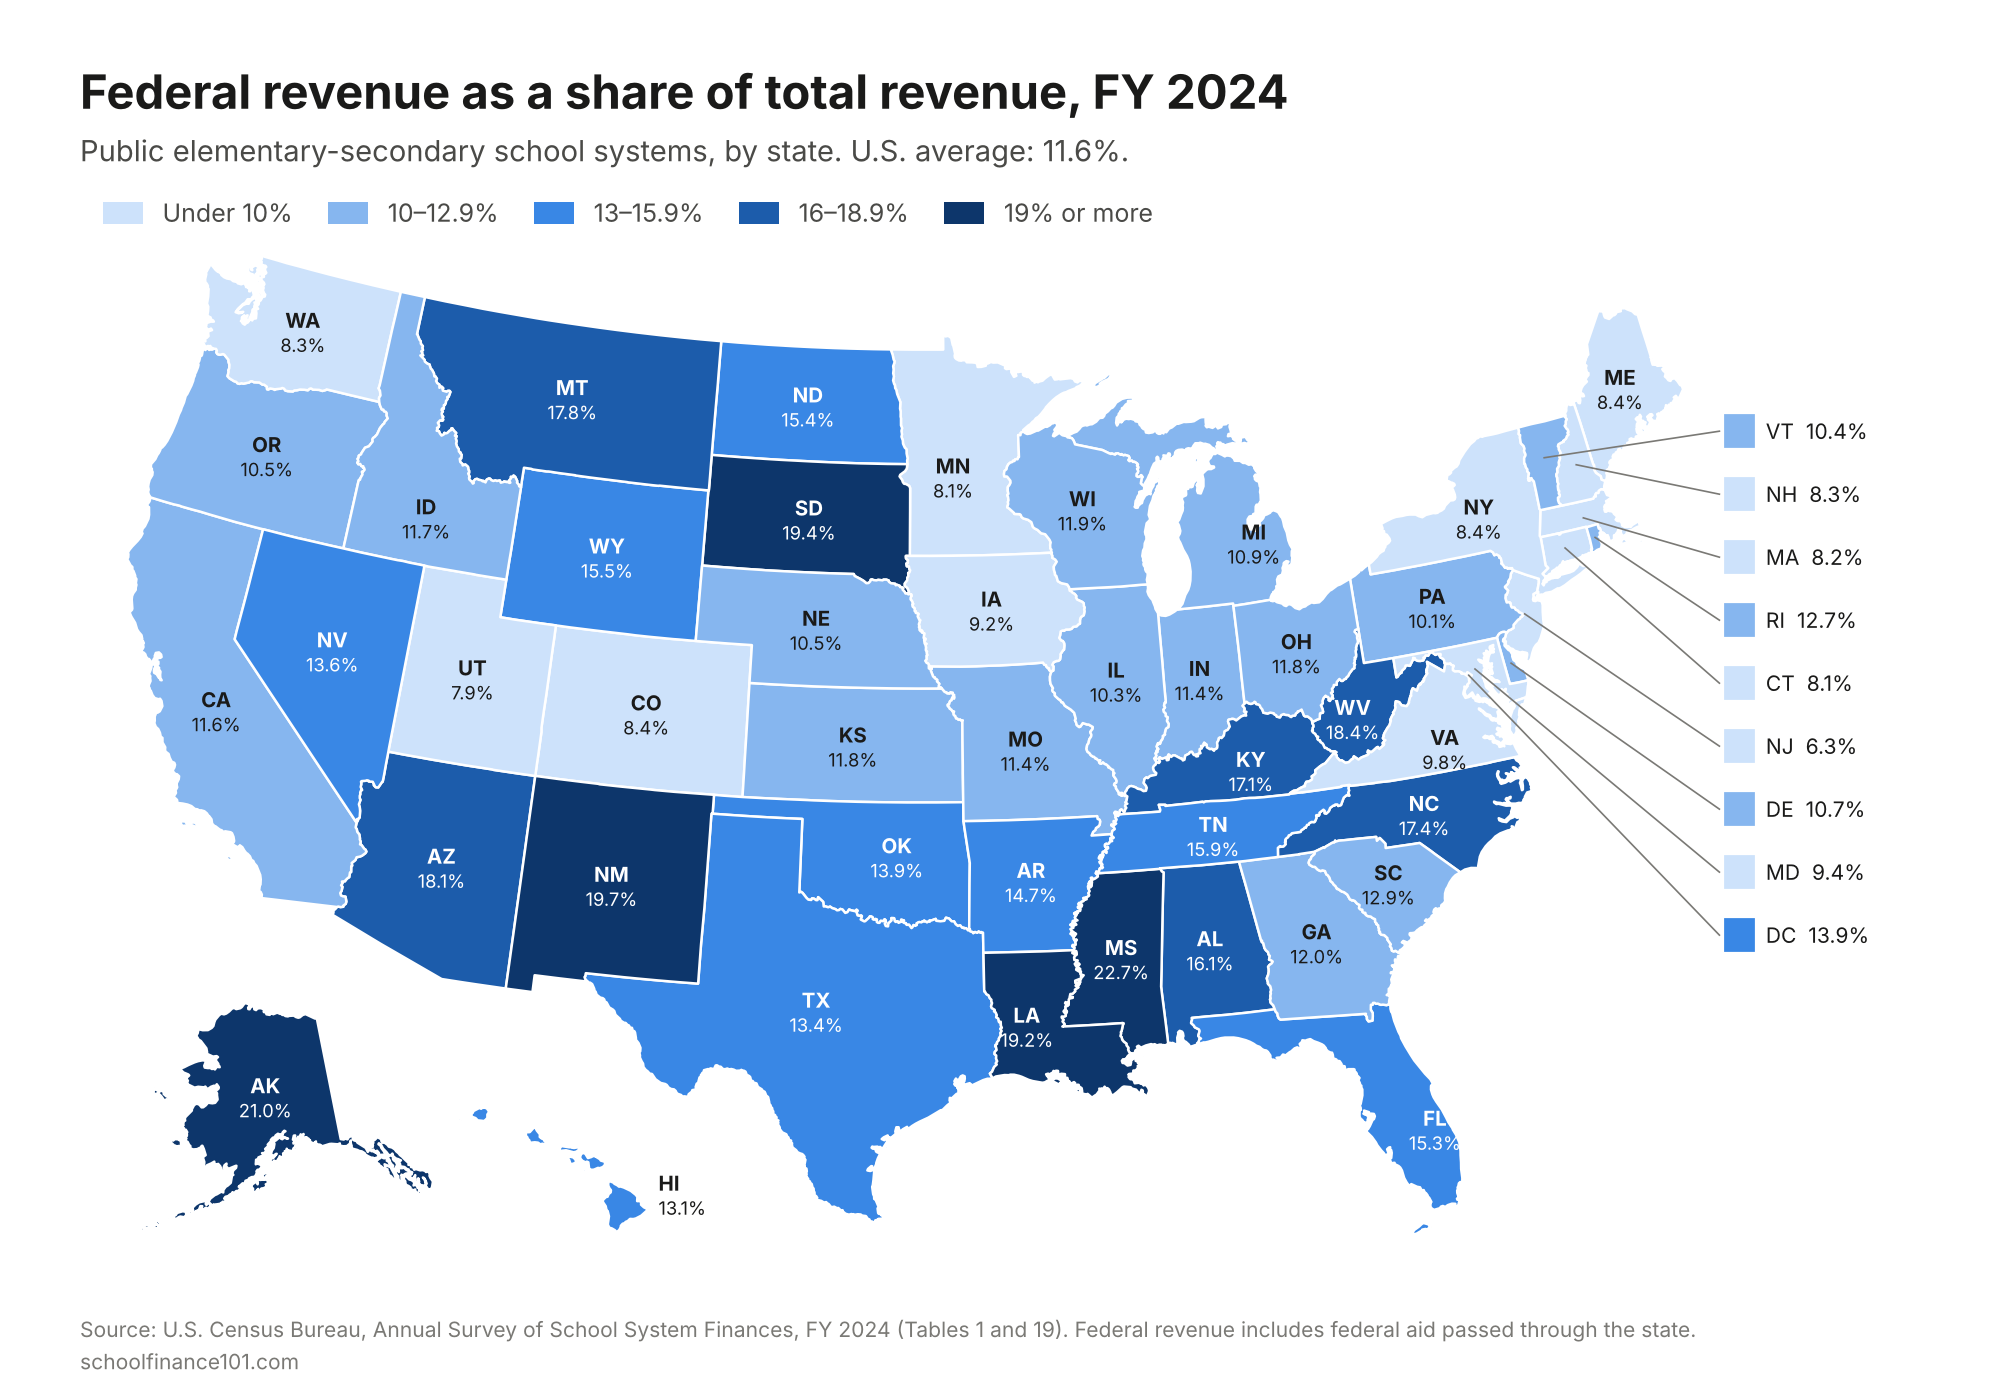
U.S. map of federal revenue as a percent of total public school revenue by state, FY 2024. Highest: Mississippi 22.7%, Alaska 21.0%, New Mexico 19.7%. Lowest: New Jersey 6.3%. U.S. average 11.6%.

We like to think of our public schools as locally controlled and state funded, with Washington playing a bit part. Nationally, that’s roughly right. In fiscal year 2024, according to the Census Bureau’s Annual Survey of School System Finances, public school systems took in about $995 billion, of which about $115 billion, or 11.6%, came from federal sources.

But that national average hides a very different country. In some states, federal aid is a rounding error in school budgets. In others, more than one of every five dollars flowing to local public schools comes from Washington. Welcome to the Dependent States of America.

Mapping dependence

The measure that matters here is dependence: federal revenue as a share of each state’s total school revenue. It tells us how much a state’s schools would be exposed if federal aid were cut, frozen, or weaponized, and how much leverage Washington has (or could have) over what happens in those schools.

U.S. map of federal revenue as a percent of total public school revenue by state, FY 2024. Highest: Mississippi 22.7%, Alaska 21.0%, New Mexico 19.7%. Lowest: New Jersey 6.3%. U.S. average 11.6%.

Mississippi tops the list, with 22.7% of school revenue coming from federal sources, followed by Alaska (21.0%), New Mexico (19.7%), South Dakota (19.4%), Louisiana (19.2%) and West Virginia (18.4%). At the other end, New Jersey’s schools draw only 6.3% of their revenue from Washington, with Utah, Minnesota, Connecticut and Massachusetts all around 8%.

The politics of dependence

It won’t surprise many readers that the Dependent States of America lean heavily red. Sorting states by the 2024 presidential result (using FEC certified state returns):

2024 presidential resultStatesFederal share of total school revenueMedian state
Trump-won3113.5%13.9%
Harris-won (incl. DC)209.7%9.6%
Solid R (R+10 or more)2413.9%15.0%
Lean R (R+2 to 10)414.8%15.5%
Toss-up (margin under 2)310.7%10.9%
Lean D (D+2 to 10)68.6%8.3%
Solid D (D+10 or more)149.9%10.3%
United States5111.6%11.8%
Group shares are pooled (group federal revenue ÷ group total revenue). Rows are shaded by 2024 presidential leaning: solid red = R+10 or more; pale red = R+2 to 10 (Arizona, Georgia, Nevada, North Carolina); pale purple = toss-up, margin under 2 points (Michigan, Pennsylvania, Wisconsin); pale blue = D+2 to 10 (Maine, Minnesota, New Hampshire, New Jersey, New Mexico, Virginia); solid blue = D+10 or more (including DC). Sources: Census Bureau, FY 2024 Annual Survey of School System Finances; FEC 2024 certified results.

Schools in states Trump carried draw 13.5 cents of every revenue dollar from Washington, compared with 9.7 cents in states Harris carried, about 40% more reliance. Dependence rises with the margin: across states, the correlation between Trump’s 2024 margin and the federal share of school revenue is about 0.55 (excluding DC). Nine of the ten most dependent states voted for Trump (New Mexico being the exception). Nine of the ten least dependent voted for Harris (Utah being the exception).

Dependent by circumstance, or by choice?

Here’s the important part. The Dependent States of America are not dependent because Washington is especially generous to them. Federal dollars per pupil are about the same in Trump-won states ($2,403) as in Harris-won states ($2,598). What differs is the denominator. State and local revenue averages about $15,400 per pupil in Trump-won states, compared with about $24,300 in Harris-won states. A similar federal contribution simply makes up a much larger slice of a much thinner budget.

And that thinner budget is not only a function of being poorer. As I lay out in a recent working paper, state wealth and income account for about half, or less, of the variation in how adequately states fund their schools. The rest is effort, or the lack of it. Forty-one states now devote a smaller share of their economies to K-12 schools than they did before the 2007-09 recession. Some states, like Mississippi, have so little capacity that even average effort would leave them well short. Others, like Florida and Arizona, could raise enough on their own simply by exerting average effort. They choose not to.

Both kinds of states show up among the Dependent States of America. New Mexico, West Virginia and Alaska exert above-average effort and remain highly dependent anyway; they are dependent largely by circumstance. Arizona (18.1% federal), North Carolina (17.4%), Tennessee (15.9%) and Florida (15.3%) are dependent substantially by choice: very low-effort states leaning on federal aid, several of them while cutting taxes and expanding private school vouchers. And there’s a bitter irony here. Many of the states most dependent on federal aid today are the same states that, during the civil rights era, adopted “antiregulation” acts, using state aid and local tax policy to shield districts that refused federal desegregation mandates.

Low effort, high dependence

To separate circumstance from choice, the table below lists every state that both puts in below-average effort (state and local school revenue as a share of personal income) and draws an above-average share of its school revenue from Washington.

StateState & local effort
(% of personal income)
EffortFederal share of revenue2024 leaning (margin)
Mississippi3.49%Below avg.22.7%Solid R (R+22.9)
South Dakota2.75%Very low19.4%Solid R (R+29.2)
Louisiana3.71%Near avg.19.2%Solid R (R+22.0)
Arizona2.41%Very low18.1%Lean R (R+5.5)
Montana2.74%Very low17.8%Solid R (R+19.9)
North Carolina2.43%Very low17.4%Lean R (R+3.2)
Kentucky3.67%Near avg.17.1%Solid R (R+30.5)
Tennessee2.81%Very low15.9%Solid R (R+29.7)
Wyoming3.69%Near avg.15.5%Solid R (R+45.8)
North Dakota3.73%Near avg.15.4%Solid R (R+36.5)
Florida2.35%Very low15.3%Solid R (R+13.1)
Arkansas3.58%Below avg.14.7%Solid R (R+30.6)
Oklahoma3.26%Below avg.13.9%Solid R (R+34.3)
Nevada3.07%Below avg.13.6%Lean R (R+3.1)
Texas3.48%Below avg.13.4%Solid R (R+13.7)
Hawaii3.69%Near avg.13.1%Solid D (D+23.1)
Rhode Island3.63%Near avg.12.7%Solid D (D+13.8)
Wisconsin3.58%Below avg.11.9%Toss-up (R+0.9)
Idaho2.86%Very low11.7%Solid R (R+36.5)
United States3.73%11.6%
States with below-average effort and above-average federal share, sorted by federal share. Rows are shaded by 2024 presidential leaning: solid red = R+10 or more; pale red = R+2 to 10; pale purple = toss-up (margin under 2 points); pale blue = D+2 to 10; solid blue = D+10 or more. Effort tiers: very low = under 3.0%; below average = 3.0 to 3.59%; near average = 3.6% to the U.S. average of 3.73%. Effort = FY 2024 state and local school revenue ÷ 2023 personal income. DC excluded (see data notes). Sources: Census Bureau FY 2024 Annual Survey of School System Finances, Tables 1 and 19; FEC 2024 certified results.

Nineteen states meet both conditions, and 17 of them voted for Trump in 2024. The two Harris-won states on the list, Hawaii and Rhode Island, sit just below the national effort average. All seven states with very low effort voted for Trump: Florida (2.35%), Arizona (2.41%), North Carolina (2.43%), Montana, South Dakota, Tennessee and Idaho. Florida, Arizona and North Carolina devote only about two-thirds of the national average share of personal income to their schools, yet each draws more than 15% of its school revenue from federal sources. Mississippi is a different case. Its effort is modestly below average, but its capacity is so low that average effort alone would not get it close to adequacy.

Every state in this table falls below the 4%-of-personal-income effort floor in our federal formula simulation (described below). Under that design, each would have to raise its own effort before receiving gap-closing federal aid.

So what should federal policy do with the Dependent States of America? Two things: allocate aid toward adequacy, and attach meaningful strings.

Allocating federal aid toward adequacy

Federal aid today is layered on top of 50 separate state systems and targeted mainly on child poverty through programs like Title I and IDEA. It helps, but it does little to close either the gaps between adequately and inadequately funded states or the gaps between high- and low-need districts within states. Even during the period of elevated pandemic aid, the highest-poverty districts in southeastern states received the most federal money and the largest federal share, yet their total revenue remained woefully inadequate.

With my colleagues Matthew Di Carlo and Mark Weber, I’ve proposed a different approach: a new federal foundation aid formula that treats the federal government as the top layer of a national school finance system. It works much the way a good state formula works:

  1. Set an adequacy target for every district, using a national education cost model to estimate the per-pupil spending needed to reach common outcome goals (in our simulation, a modest goal: national average reading and math outcomes), adjusted for student needs and regional costs.
  2. Require a minimum state and local effort, in our simulation 3.5% of gross state product or 4% of aggregate personal income, roughly the national average.
  3. Direct that state and local revenue toward the districts furthest below adequacy.
  4. Have federal aid fill whatever gap remains, but only once a state has done its part.

In our proof-of-concept simulation, universal adequacy would require roughly $52 billion in additional federal aid per year, targeted to districts in 34 states, along with about $80 billion in additional state and local fair-share investment. Full participation would reduce the share of students in inadequately funded districts from about 55% to zero and shrink the funding gap between the highest- and lowest-poverty districts by more than 60%.

The effort requirement matters most for the Dependent States of America. Low-capacity states like Mississippi would receive substantially more help once they reach the effort floor, because their gaps genuinely exceed what they can raise. Low-effort states like Florida, Arizona, North Carolina and Tennessee would have to raise their own effort before receiving gap-closing aid. Federal dependence would stop being a subsidy for choosing not to try. And there’s no reason this logic must be limited to new money. The same framework could guide the distribution of the roughly $115 billion in federal revenue already flowing to schools.

Applying pressure where dependence is greatest

When one fifth of a state’s school revenue comes from Washington, Washington has both a stake and a lever. We’ve used that lever before. Southern states were required to adopt education articles in their constitutions as a condition for readmission to the Union after the Civil War. A century later, the Elementary and Secondary Education Act of 1965 put real federal money on the table, and the threat of losing it gave teeth to desegregation enforcement. The federal government is again using that lever, but in the opposite direction, threatening to withhold aid from schools and states that pursue equity.

A future federal role should apply the lever deliberately, and most firmly where dependence is greatest. Conditions attached to federal aid should include:

  • Civil rights protections for all children. Full compliance with Title VI, Title IX, IDEA and Section 504, and with the obligation to educate every child regardless of immigration status. Any provider receiving public funds, including charter and voucher-receiving schools, must be bound by the same nondiscrimination requirements.
  • Common national goals. Shared outcome goals and measures, broader than reading and math scores and including preparation for postsecondary education, the workforce and civic life, that define what adequate funding must accomplish and drive the cost estimates behind the formula. These are national goals, not a national curriculum; achieving them would require revisiting long-standing statutory limits on federal direction of curriculum, and states would retain authority over how to meet them.
  • Minimum effort and no backsliding. States should not be able to eliminate the primary tax sources funding their schools, as Mississippi has proposed with its income tax and Florida with property taxes, or divert public funds to private schools, while drawing federal aid to backfill the hole.
  • Enforceable education rights. Every state constitution includes an education article, but enforcement by state courts has been uneven at best. Federal aid should come with pressure to make those rights real.
  • Transparent data. School-level spending and broader outcome reporting, supported by a rebuilt, not dismantled, National Center for Education Statistics and Institute of Education Sciences.

There are legal limits. Spending Clause conditions must be clearly stated, related to the purpose of the funds, and not so severe that they amount to coercion. That argues for attaching new conditions to new adequacy aid, phased in over time, rather than threatening to pull existing funds overnight. But the principle stands: the more a state’s schools depend on federal dollars, the stronger the federal interest in ensuring those schools serve every child, to common standards, under the protection of the law.

Whose rights? Children’s, not parental preferences

There’s another reason the Dependent States of America deserve federal attention. Several of them are where public money now follows parental preference with the fewest strings attached. Arizona, at 18.1% federal and among the lowest-effort states in the country, has made every school-age child eligible for an Empowerment Scholarship Account since 2022. Under its statute, a parent’s signature on the account agreement counts as compulsory school attendance. The law requires no testing and no curricular approval, and it measures no learning. Florida’s universal program requires a norm-referenced test, but funding turns on submitting the test, not on the score. Idaho’s high court has upheld that state’s private education tax credit, and Wyoming’s has cleared its education savings accounts to operate. All four states appear in the low-effort, high-dependence table above.

As I explain in Not the Mere Creature of Anyone (full working paper), for a century the Supreme Court has asked how much control parents may exercise over their children’s schooling, and almost never what the child is owed. Since 2017, the doctrine has converged on a single result: parental authority, underwritten by public money and increasingly insulated from public conditions. Carson v. Makin requires a state that funds any private option to fund religious ones. Mahmoud v. Taylor and Mirabelli v. Bonta make parental religious objection a powerful claim inside the public schools that remain. And on November 3, the Court hears St. Mary Catholic Parish v. Roy, which asks whether states may attach neutral conditions to the money at all.

Consider, as I did in Experimenting With Our Children, the student in Phoenix who turns 18 having been failed by her account-funded education. She can’t sue her parents; courts have long refused to recognize a duty of care for academic outcomes. She can’t sue the state under the federal Constitution; education is not a fundamental federal right, and the state generally owes no duty to protect a child from harm by a private actor, including a parent. And state courts reviewing universal voucher and account programs have increasingly asked whether the money harms the public system, not whether any individual child is being educated. She is the one party to the arrangement with no rights of her own.

Pierce v. Society of Sisters told us that the child “is not the mere creature of the State.” True. But neither is she the mere creature of her parents. And Pierce struck a bargain that is too often forgotten: parents could leave the public schools, but the state kept the power to reasonably regulate all schools, to inspect and examine them, and to require studies essential to good citizenship. Federal aid can and should reinforce the state’s side of that bargain. Any state that spends public money, its own or Washington’s, on private schooling or home education should, as a condition of federal aid, adopt what I call Children’s Recourse:

  • Register every school-age child, in every setting, so no child disappears from public view.
  • Assess learning, not attendance or receipts, paired with remediation and, after repeated failure, a required change of educational setting.
  • Keep every child in periodic contact with a mandated reporter, such as a teacher, nurse or counselor, and review any withdrawal from school while child-protection concerns are open.
  • Attach neutral accountability conditions to every public dollar: assessment participation, public reporting of outcomes and finances, nondiscrimination in admissions, including on the basis of disability, and audits. To survive Carson and Fulton, these must apply to all providers alike, without discretionary exemptions.
  • Give older students a voice in decisions about their own schooling, the question Justice Douglas asked in his Yoder dissent and the Court has never answered.
  • End the fiction that a funding contract is an education, repealing provisions like Arizona’s that deem a signed account agreement to be school attendance.

None of these measures requires any family to profess anything, and none prescribes a culture or a creed. They ask only that someone be answerable to the child whose public education dollars are being spent. And they rest on the strongest ground available: state constitutional education clauses, which courts in Kentucky, Wyoming, New Hampshire and Washington have read as conferring an individual, even fundamental, right on each child. A right held by the child doesn’t stay behind when the child leaves the public system. It follows her, and so should the state’s duty, and the federal government’s interest, in seeing that she is actually educated.

From the Dependent States of America to Project 2029

None of this will happen under the current federal administration, which is dismantling the Department of Education, clawing back appropriated funds and greenlighting states already eroding their own public schools. In the short term, the work falls to what I’ve called the Education States, which are not exclusively blue or northern (Kansas qualifies), to protect their own students: backfilling threatened federal aid with state funds, much as southern states once used state aid to resist civil rights, and building the data capacity Washington is abandoning.

But short-term resistance is not a plan for the Dependent States of America. Children in Florida, Arizona, North Carolina and Tennessee can’t wait for their legislatures to rediscover the value of public education, and children in Mississippi can’t wait for their state to grow its way to adequacy. That requires a longer game: Project 2029.

Project 2029 is a new reconstruction. Ideally, it would include a federal constitutional amendment requiring that every child be provided, by their state with federal assistance, equal educational opportunity. At a minimum, it must include:

  1. Common national goals and standards, and measures of them, to guide what we expect our schools to accomplish and what it costs.
  2. A national cost model to drive a federal foundation aid formula targeting dollars to where they are needed most.
  3. A required minimum state and local effort, so that federal aid complements rather than substitutes for state responsibility.
  4. Rebuilt federal data and research capacity to monitor progress toward equal educational opportunity.
  5. Children as rights-holders, with federal aid reinforcing each child’s right to an adequate education wherever public money sends her, not deferring to parental preference as a proxy for the child’s interest.

What Congress would have to change

Project 2029 can’t be accomplished by executive order, nor should it be. It requires legislation, and in several places it means rewriting rules that currently get in the way. Congress would need to enact a federal foundation aid program1; replace ESEA’s maintenance-of-effort rule with an effort floor2; fix Title I’s spending factor3; revisit the prohibitions on federal involvement in standards and curriculum4; strengthen civil rights enforcement5; write Children’s Recourse into the conditions on federal aid6; ratify the UN Convention on the Rights of the Child7; make education rights enforceable8; fully fund IDEA9; and rebuild and protect the federal education infrastructure10. The notes below spell out each change and the statutes and cases involved.

Project 2025 was years in the making, so that an administration could act on day one. Project 2029 must be just as detailed and just as ready, but with a crucial difference. It must be built on broad congressional buy-in rather than executive shows of force, and it must uphold, not subvert, our core constitutional commitments: equal protection, due process, free speech, and the balance between the free exercise of religion and the prohibition on its establishment. Over the longer run, it means revisiting the precedents that have subordinated the child to parental preference and public money, from Carson and Espinoza back toward Pierce itself, with any replacement built so it can never again be turned against minority families.

The Dependent States of America are dependent today largely because they’ve chosen to underinvest in their own children, and federal aid has quietly covered for it. Project 2029 should turn that dependence into a partnership: real federal help, toward real adequacy, in exchange for real effort and real protections for every child, protections that belong to the child, not to the adults choosing for her. If we are going to spend public money in a child’s name, someone has to be answerable to that child. Equitable and adequate funding alone won’t get us to equal educational opportunity. But we can’t get there without it.

  1. Enact a federal foundation aid program. A new title of the Elementary and Secondary Education Act (ESEA) authorizing adequacy-based aid driven by a national cost model, with a minimum state and local effort requirement (for example, 4% of personal income or 3.5% of gross state product) and a multi-year phase-in for states below the floor. Elementary and Secondary Education Act of 1965, as amended by the Every Student Succeeds Act (2015), 20 U.S.C. § 6301 et seq. The effort benchmarks follow Baker, Di Carlo & Weber (2022). ↩︎
  2. Replace the maintenance-of-effort rule with an effort floor. ESEA’s current maintenance-of-effort requirement asks only that a state spend at least 90% of what it spent the year before. A state can stay at very low effort forever and remain compliant. The test should be effort relative to capacity, and states should not be able to cut taxes or divert public funds to private schools below that floor while drawing federal foundation aid. ESEA § 8521, 20 U.S.C. § 7901 (maintenance of effort: combined fiscal effort or aggregate expenditures of at least 90 percent of the prior year). ↩︎
  3. Fix Title I’s spending factor. Title I’s formulas use a state per-pupil expenditure factor that sends more aid per poor child to states that already spend more, regardless of capacity or effort. Allocations should instead reflect adequacy gaps and effort. ESEA §§ 1124–1125A, 20 U.S.C. §§ 6333–6337. Under the Basic Grant formula, the state expenditure factor is 40 percent of the state’s average per-pupil expenditure, bounded at 80 to 120 percent of the national average. ↩︎
  4. Revisit the prohibitions on federal involvement in standards and curriculum. The General Education Provisions Act and provisions the Every Student Succeeds Act added to ESEA bar federal direction of curriculum and federal incentives for particular standards. These should be amended to permit common national outcome goals and measures, including an expanded NAEP, while leaving curriculum and instruction to states and districts. General Education Provisions Act § 103, 20 U.S.C. § 1232a; ESEA § 1111(e), 20 U.S.C. § 6311(e); ESEA § 8526A, 20 U.S.C. § 7906a. ↩︎
  5. Strengthen civil rights enforcement. Restore private enforcement of Title VI disparate-impact protections, which the Supreme Court closed off in Alexander v. Sandoval (2001). Codify the guarantee of Plyler v. Doe that every child, regardless of immigration status, is entitled to a public education. And as a condition of federal aid, require states that fund private providers, through vouchers, education savings accounts, tax-credit scholarships or charters, to hold them to the same nondiscrimination, special education and transparency requirements as public schools. Title VI of the Civil Rights Act of 1964, 42 U.S.C. § 2000d; Alexander v. Sandoval, 532 U.S. 275 (2001); Plyler v. Doe, 457 U.S. 202 (1982). ↩︎
  6. Write Children’s Recourse into the conditions on federal aid. Require any state that spends public funds on private schooling, education savings accounts or home education to register every child, assess learning rather than receipts, keep children in contact with mandated reporters, apply neutral accountability conditions uniformly to every provider, give older students a voice, and drop any rule deeming a funding agreement to be school attendance. Drafted as neutral, generally applicable conditions, these stand the best chance of surviving whatever the Court decides in St. Mary. Ariz. Rev. Stat. Ann. § 15-2402(I); Carson v. Makin, 596 U.S. 767 (2022); Fulton v. City of Philadelphia, 593 U.S. 522 (2021); St. Mary Catholic Parish v. Roy, No. 25-581 (U.S., argued Nov. 3, 2026). See Baker (2026), Part VII. ↩︎
  7. Ratify the UN Convention on the Rights of the Child. It recognizes parents’ primary responsibility for their children, exercised consistent with the child’s evolving capacities, while guaranteeing the child a voice in matters affecting her and subjecting private schools to minimum standards. The United States signed it in 1995 and is the only UN member that is not a party. Convention on the Rights of the Child, arts. 5, 12, 18, 29, Nov. 20, 1989, 1577 U.N.T.S. 3 (signed by the United States Feb. 16, 1995). Ratification requires the advice and consent of two-thirds of the Senate, U.S. Const. art. II, § 2, cl. 2. ↩︎
  8. Make education rights enforceable. Condition foundation aid on each state guaranteeing, in law, a judicially enforceable right to an adequate education. In the longer run, pursue a federal constitutional amendment so that this right no longer depends on the willingness of 50 state courts. San Antonio Independent School District v. Rodriguez, 411 U.S. 1, 35 (1973) (no federal fundamental right to education); Papasan v. Allain, 478 U.S. 265, 285 (1986) (leaving open whether a minimally adequate education is a fundamental right). ↩︎
  9. Fully fund IDEA. Congress authorized federal funding of up to 40% of the excess cost of educating students with disabilities in 1975, and it has never come close. Closing that gap is among the most direct ways to relieve pressure on low-capacity states. Individuals with Disabilities Education Act, 20 U.S.C. § 1411(a)(2) (maximum grant of 40 percent of the national average per-pupil expenditure times the number of children served). ↩︎
  10. Rebuild and protect the federal education infrastructure. Reauthorize the Education Sciences Reform Act with statutory independence and stable funding for NCES and IES. Codify the Census school finance survey and school-level spending reporting. Fund the cost modeling a national formula requires, and protect the Department of Education’s statutory functions from administrative dismantling. Education Sciences Reform Act of 2002, 20 U.S.C. § 9501 et seq.; Department of Education Organization Act, 20 U.S.C. § 3401 et seq.; ESEA § 1111(h)(1)(C)(x), 20 U.S.C. § 6311(h)(1)(C)(x) (school-level per-pupil expenditure reporting). ↩︎

Data notes

Abbott Elementary Is Entertaining. The Damage Is Real.

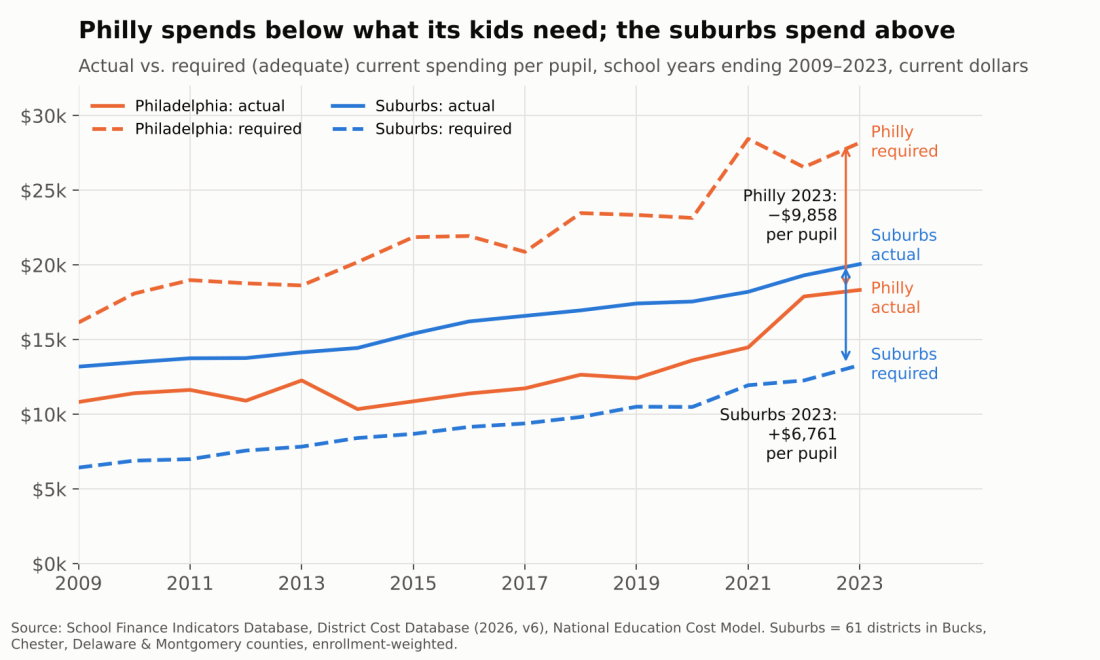
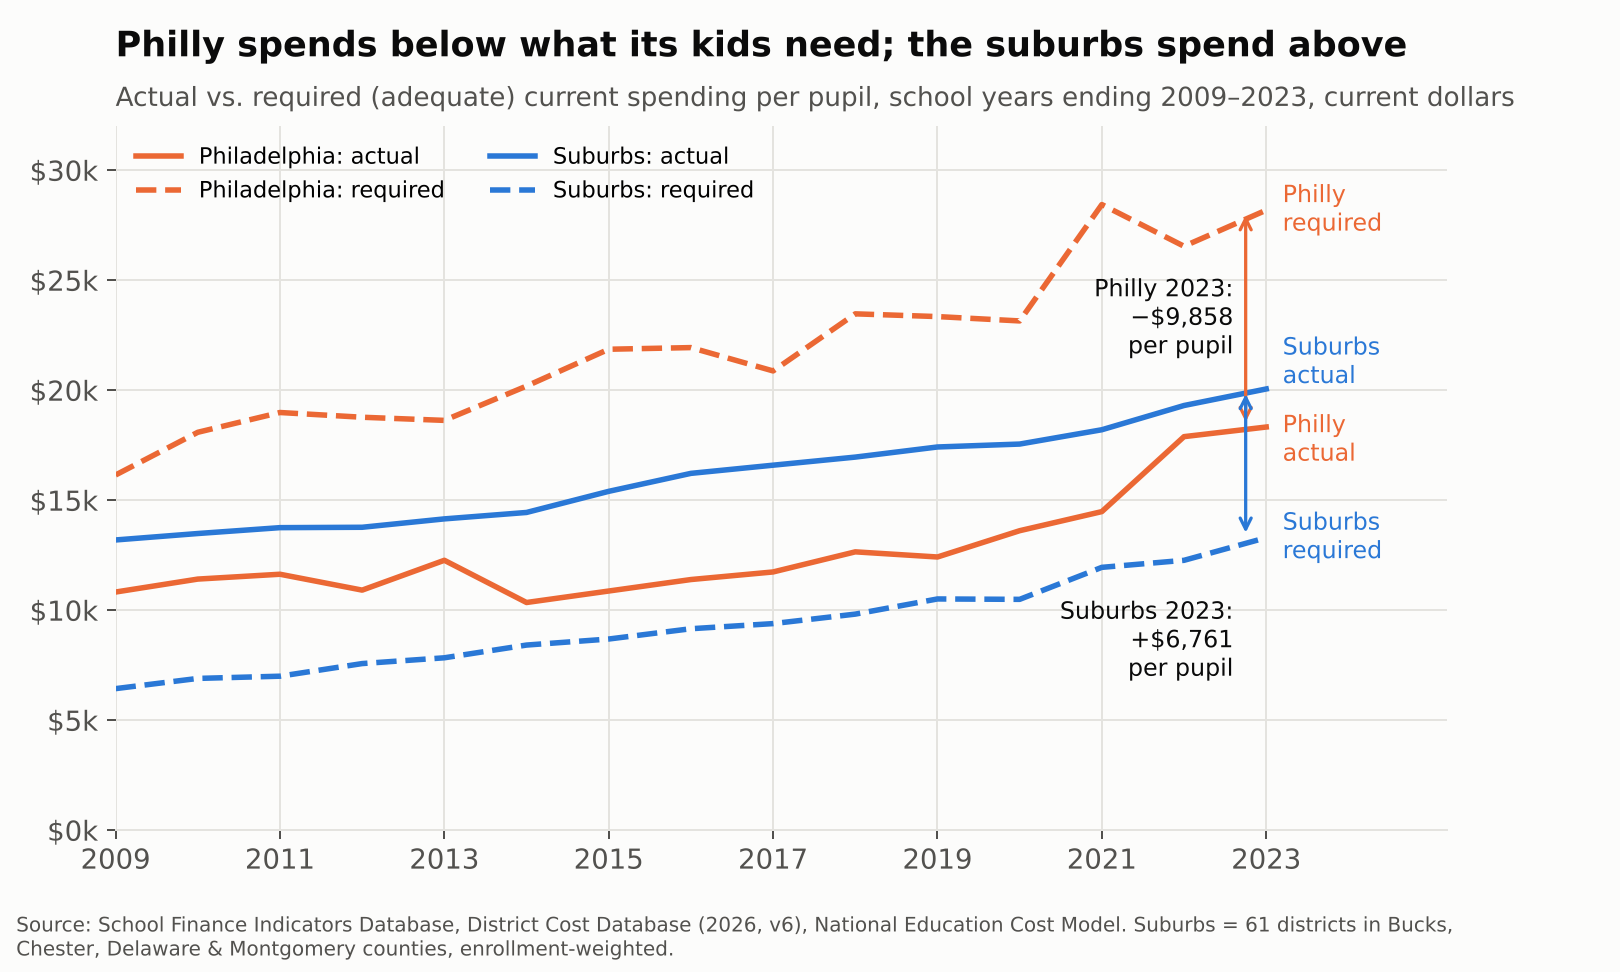
Actual vs. required spending per pupil, Philadelphia and suburbs, 2009–2023

Abbott Elementary plays it for laughs. Janine Teagues hunts for a working rug, a functioning copier, a single extra aide. Barbara Howard has seen every reform come and go. Gregory Eddie inherits a classroom with no curriculum. Melissa Schemmenti knows a guy who can get the supplies the district can’t.

The show is entertaining. The damage is real. Behind every running gag is a funding gap that has been measurable, year after year, for at least fifteen years, and that has landed on real children in real Philadelphia classrooms.

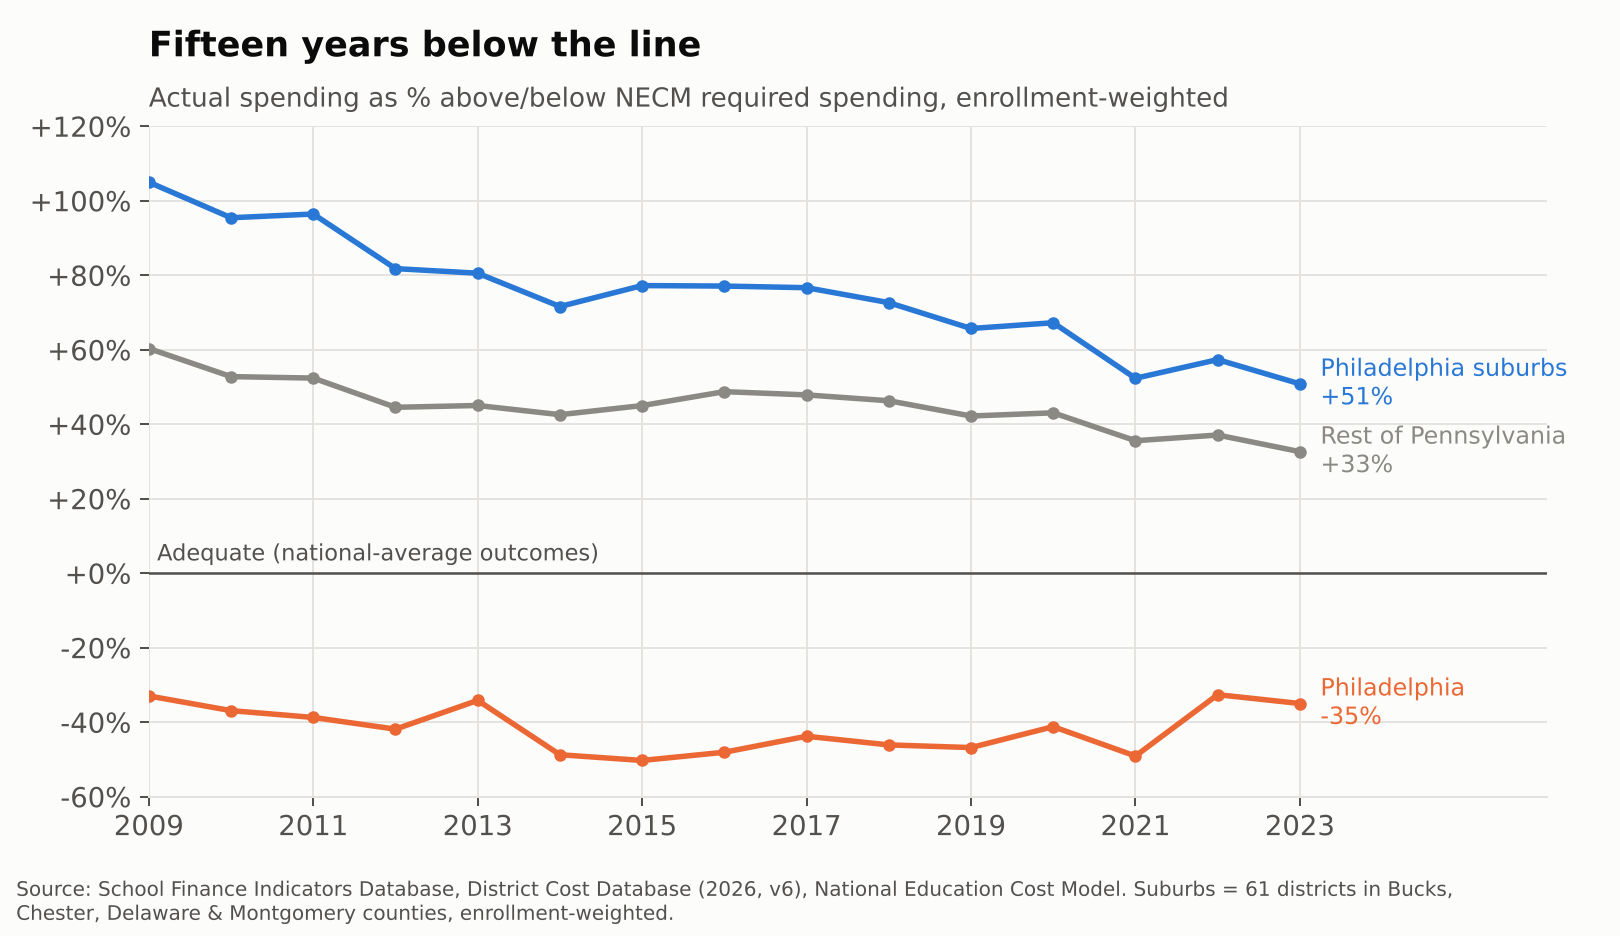
Philadelphia’s district schools have spent between a third and a half less than what it would cost to get their students to national-average outcomes in every year from 2009 to 2023. Over the same years, the 61 suburban districts in Bucks, Chester, Delaware and Montgomery counties spent between half again and twice what their own students needed. We laugh at the broken boilers, missing counselors and teachers buying their own supplies. The kids living it don’t get a laugh track.

What follows walks from the money to the classroom: first the adequacy gap, then the simple “screwed city” picture, then teachers per child, teacher pay, and finally who is actually standing in front of the kids.

Fifteen years below the line

In 2022-23, the School District of Philadelphia spent $18,329 per pupil. Our National Education Cost Model estimates it would have needed $28,187 to give its students a shot at national-average test scores. That is a gap of $9,858 per child, or roughly $1.2 billion across 118,000 students, in a single year.

The suburbs face the mirror image. Their enrollment-weighted average spending was $20,059 against a required $13,298, a surplus of $6,761 per child. Same metro, same labor market, same state constitution.

Actual vs. required spending per pupil, Philadelphia and suburbs, 2009–2023

This is not a recent dip. Philadelphia sat 33% below its adequacy target in 2009, sank to 50% below in 2015 in the wake of the “doomsday” budgets, and was still 35% short in 2023, even with federal pandemic aid in the mix. The suburbs started out spending more than double their target and have drifted down to about 51% above it. The rest of Pennsylvania sits in between, about a third above.

Percent above or below adequacy, Philadelphia, suburbs, and rest of Pennsylvania

The outcome side tells the same story. Philadelphia’s students scored roughly 0.8 standard deviations below the national average in 2022-23, while suburban students scored about 0.2 above. Abbott’s students are not falling short because nobody cares. They are falling short where the money falls short.

The simple version: a “screwed city”

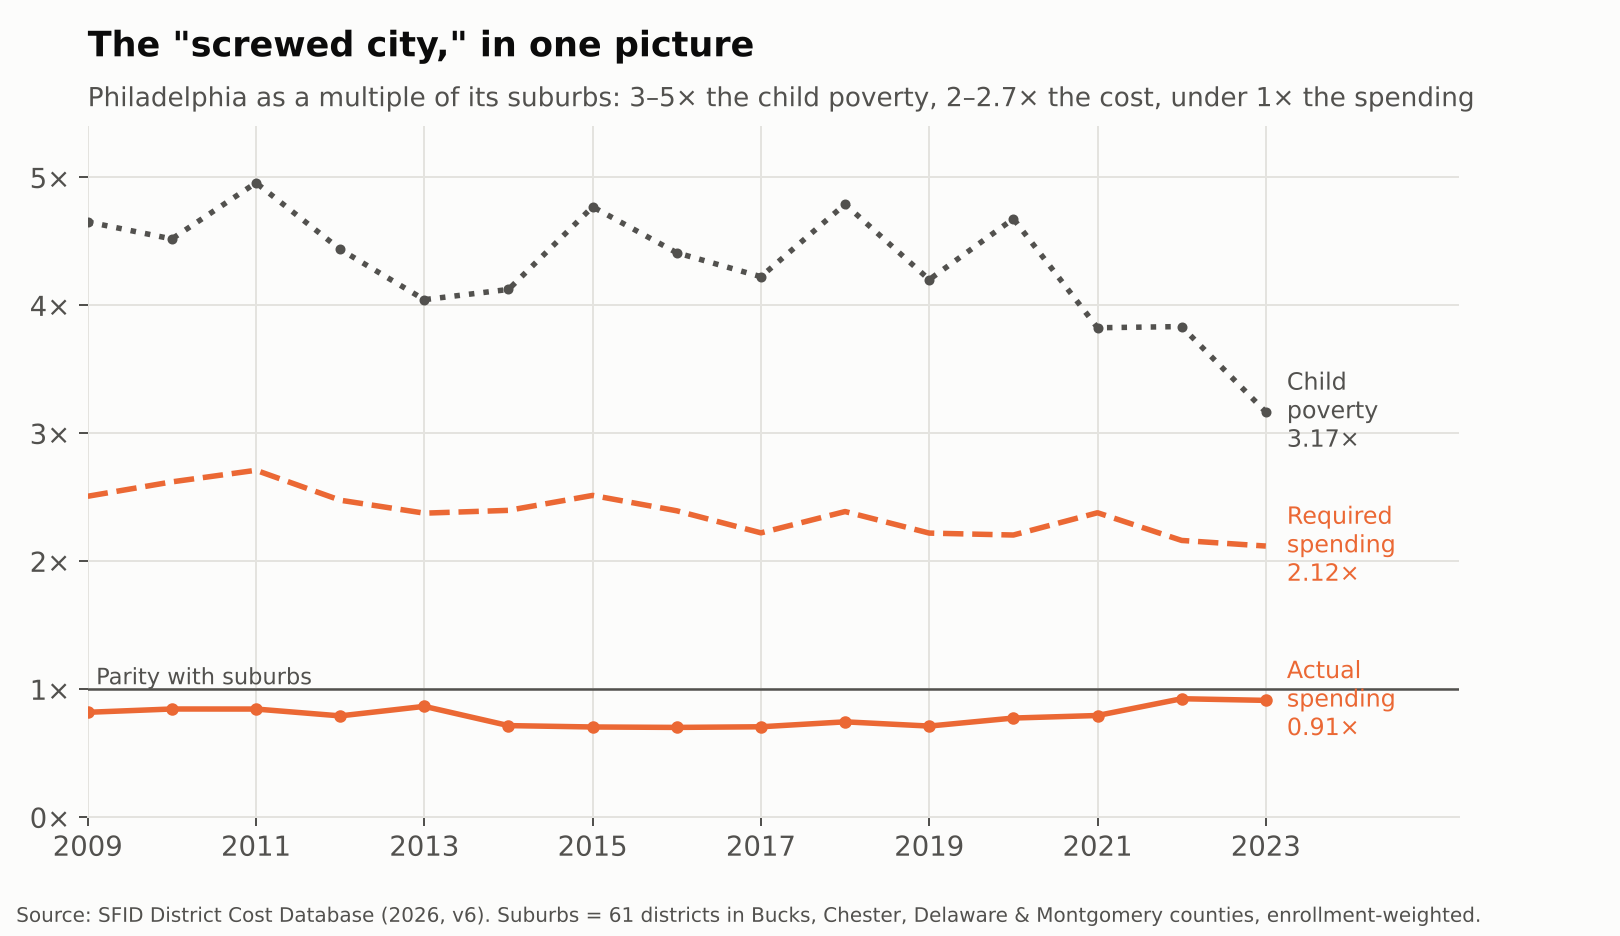
You don’t need a cost model to see the problem. Divide Philadelphia by its suburbs. In 2022-23, the city had 3.2 times the suburban child poverty rate. Under the NECM, that translates into 2.1 times the cost of reaching national-average outcomes. And the city spent 0.91 times what the suburbs spent.

Philadelphia as a multiple of its suburbs: poverty, required spending, actual spending

That pattern has held every year since 2009. Philly’s poverty rate has run 3 to 5 times the suburban rate, its costs 2 to 2.7 times, and its spending has never once caught up to the suburbs, let alone exceeded them.

That is what it means to be a screwed city. Not just underfunded relative to need, but outspent outright by the comfortable districts a short SEPTA ride away.

Even in Pennsylvania, Philadelphia is not alone

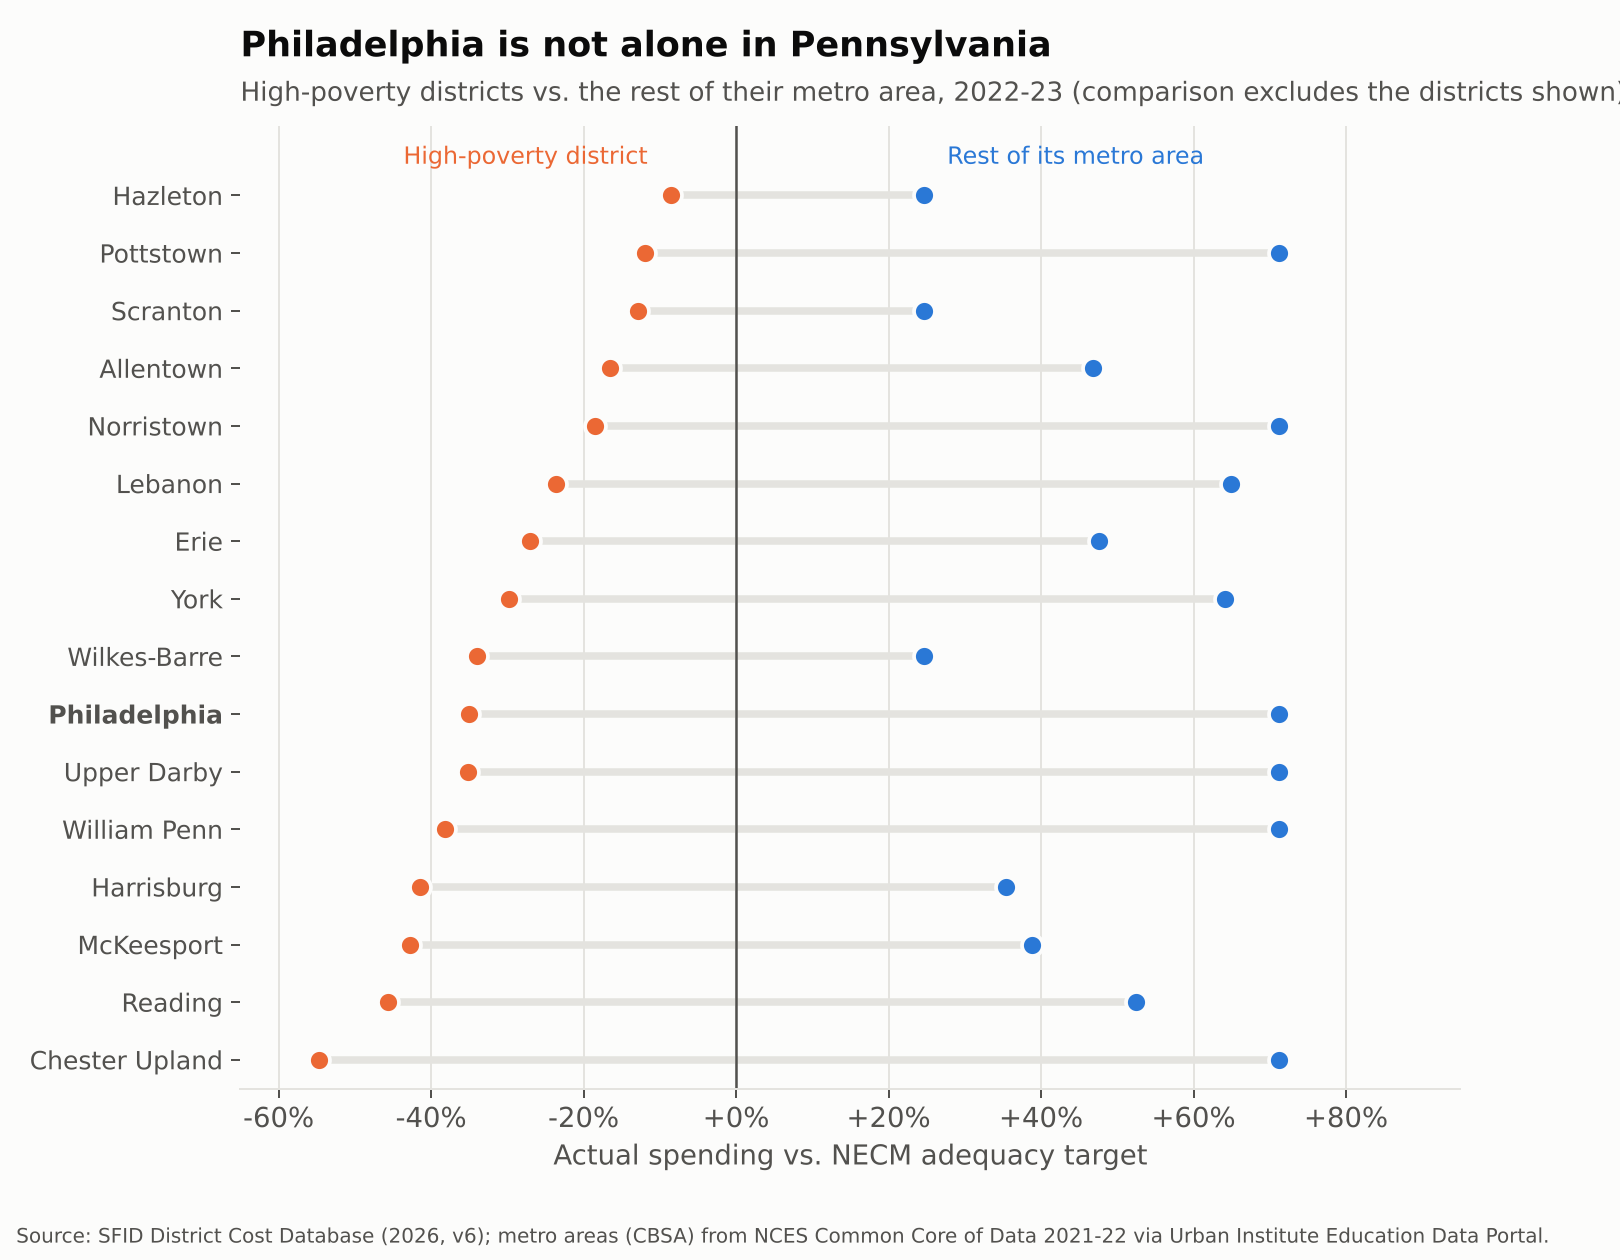
Philadelphia is the biggest case, not the only one. Reading spent 46% below its adequacy target in 2022-23, while the rest of the Reading metro spent 53% above. Allentown was 17% short while its Lehigh Valley neighbors were 47% over. Harrisburg, York, Lebanon, Erie, Wilkes-Barre and Chester Upland tell the same story.

High-poverty Pennsylvania districts vs. the rest of their metro areas, percent above or below adequacy

The pattern reaches into Philly’s own suburbs. Chester Upland, Upper Darby, William Penn, Norristown and Pottstown are all below adequacy, surrounded by districts in the same four counties that spend about 71% above theirs.

Across the state, 56 of 497 districts spent below their adequacy targets in 2022-23. They enroll 23% of Pennsylvania’s students, but 67% of its Black students and 49% of its Hispanic students, compared to 8% of its white students. Philadelphia accounts for about a third of the students in those districts. Fixing Philly alone would not fix Pennsylvania.

This is the system the Commonwealth Court found unconstitutional in William Penn School District v. Pennsylvania Department of Education in February 2023. The state has since begun phasing in adequacy aid, including $565 million statewide in the 2025-26 budget (WHYY). The gaps above are what that aid is chasing.

From dollars to classrooms: fewer adults per child

School money is mostly people. When a district is short a third of what it needs, the shortfall shows up as fewer teachers, larger classes and missing specialists.

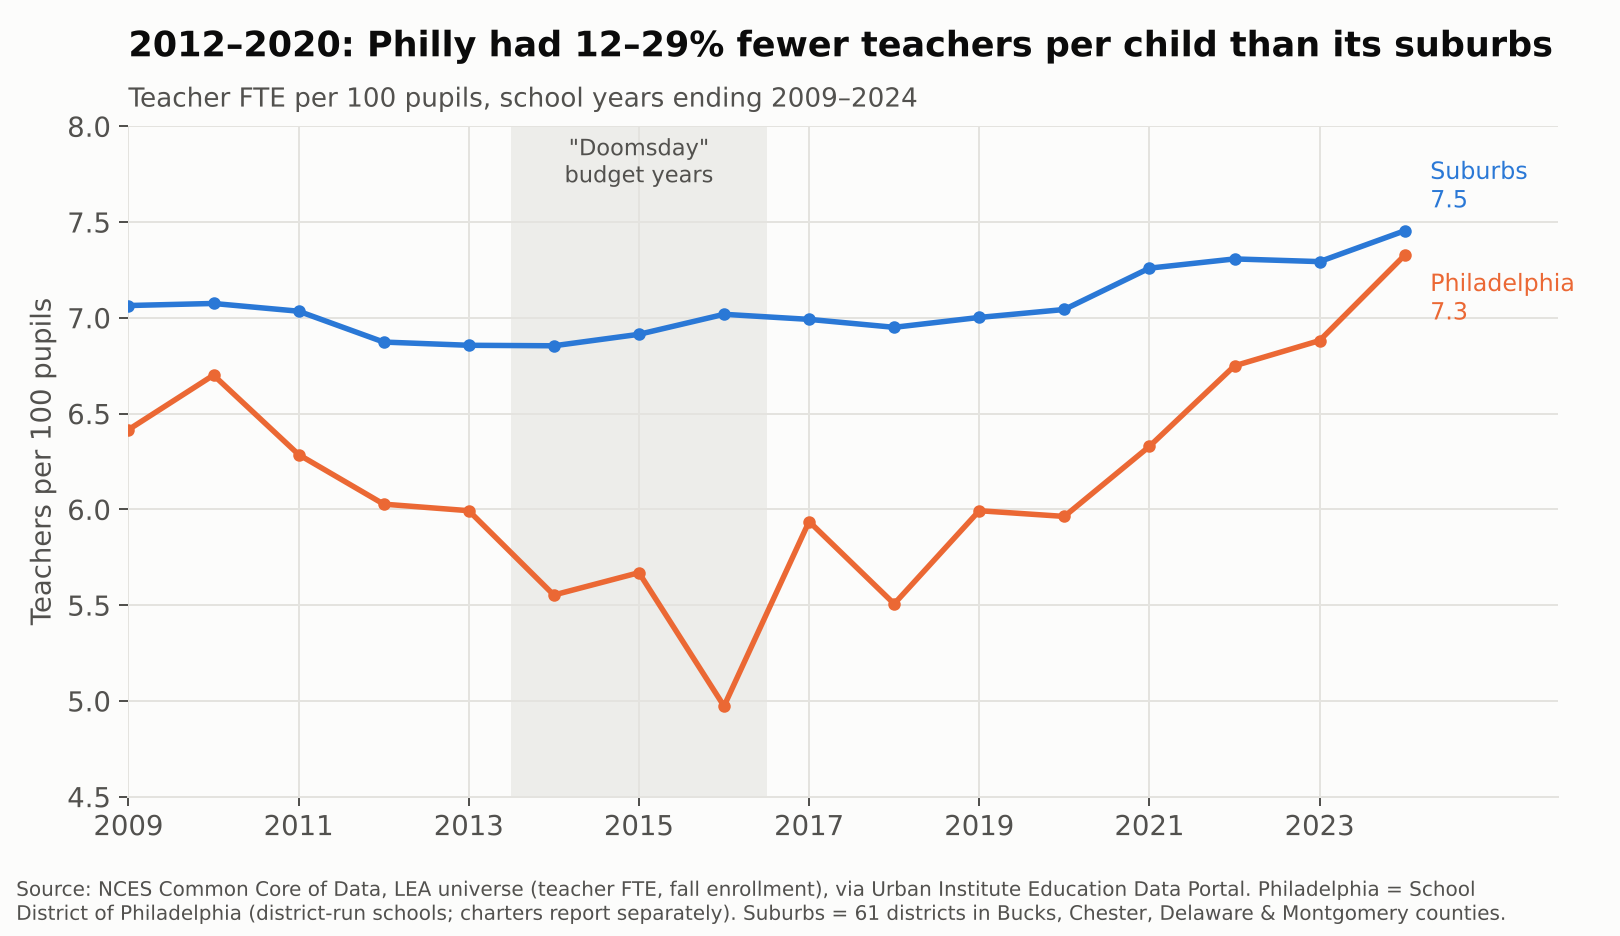
Philadelphia reported 11,103 teachers in 2009-10. By 2013-14 it had 7,645, a 31% cut, while enrollment fell only 17%. From 2012 through 2020, the district ran between 12% and 29% fewer teachers per 100 pupils than its suburbs. That is Gregory Eddie’s world: a full roster of kids, and not enough colleagues to share them with.

Teachers per 100 pupils, Philadelphia vs. suburbs, 2009–2024

The gap has nearly closed since 2021, to 7.3 teachers per 100 pupils in Philadelphia vs. 7.5 in the suburbs in 2023-24, helped by federal pandemic aid and new state money. But parity is not adequacy. A district whose students cost twice as much to serve, by the NECM’s estimate, does not get there with the same staffing ratio as Lower Merion.

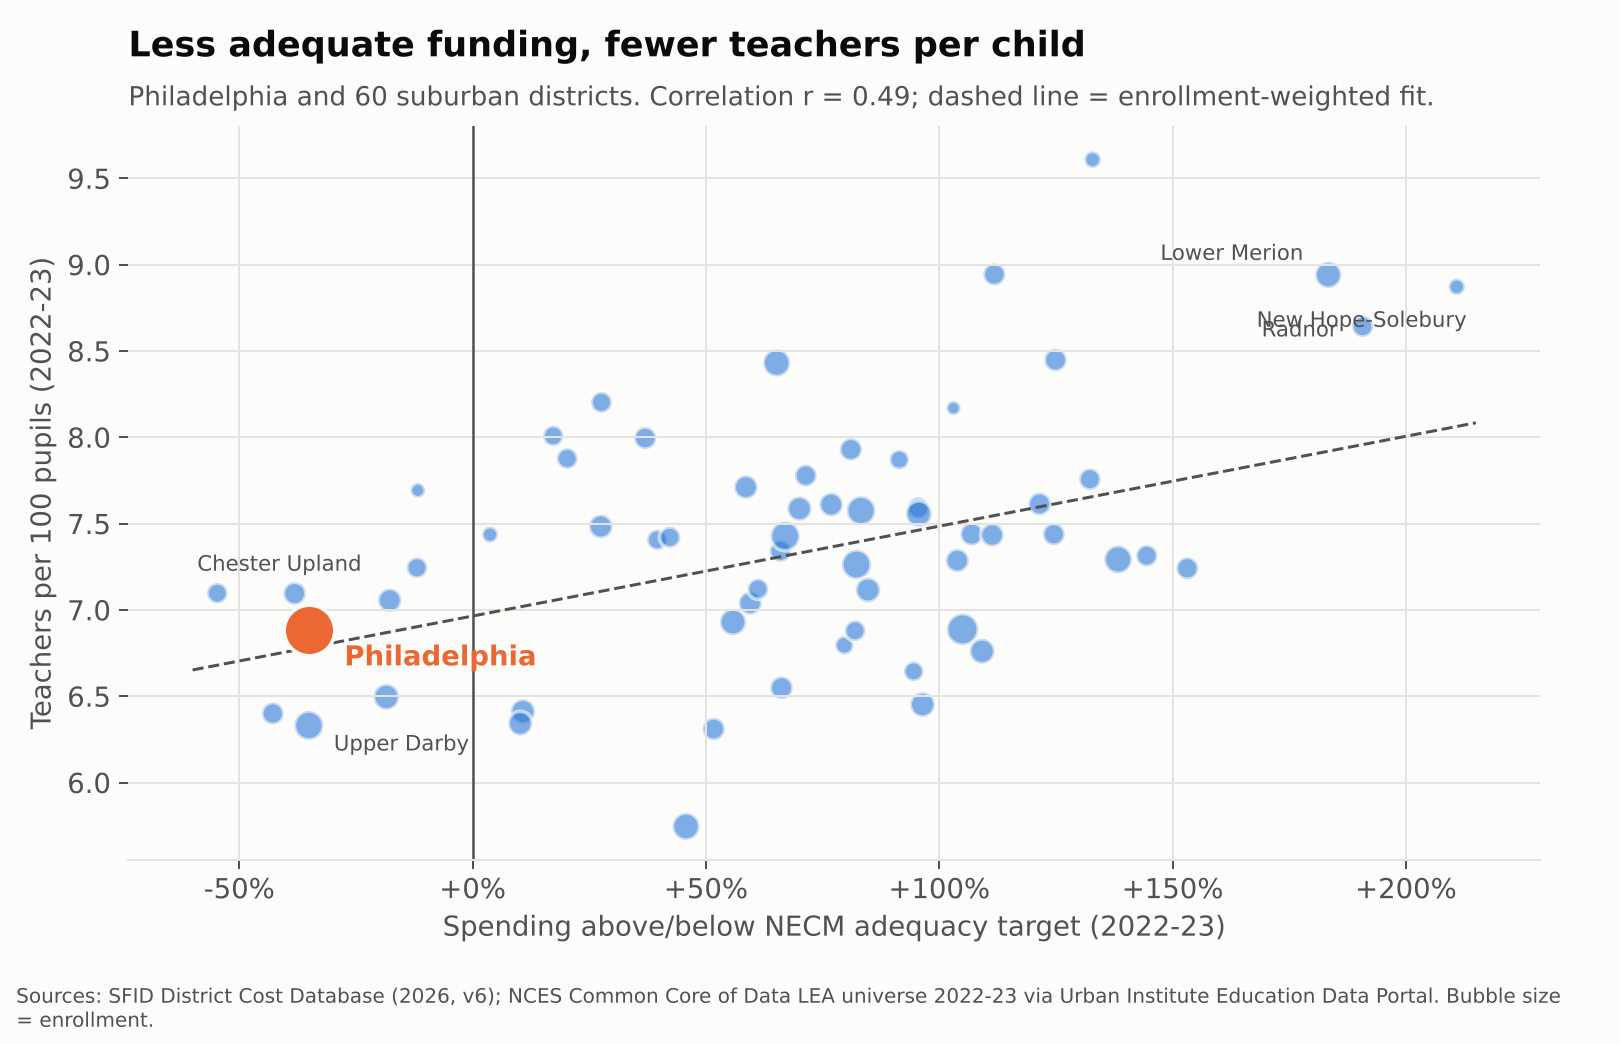
Across Philadelphia and its suburbs, adequacy and staffing move together. Districts further above their adequacy targets employ more teachers per child (r = 0.49 in 2022-23). The fitted line implies that if Philadelphia were funded like the average suburb, it would have roughly 0.45 more teachers per 100 pupils, or about 500 more teachers, before accounting for its higher needs at all.

Adequacy vs. teachers per 100 pupils, Philadelphia and suburban districts, 2022-23

Teacher pay: same labor market, different paychecks

Philadelphia and its suburbs hire from the same pool of teachers, often the same graduating classes. So pay comparisons here need no regional cost adjustment. They are apples to apples.

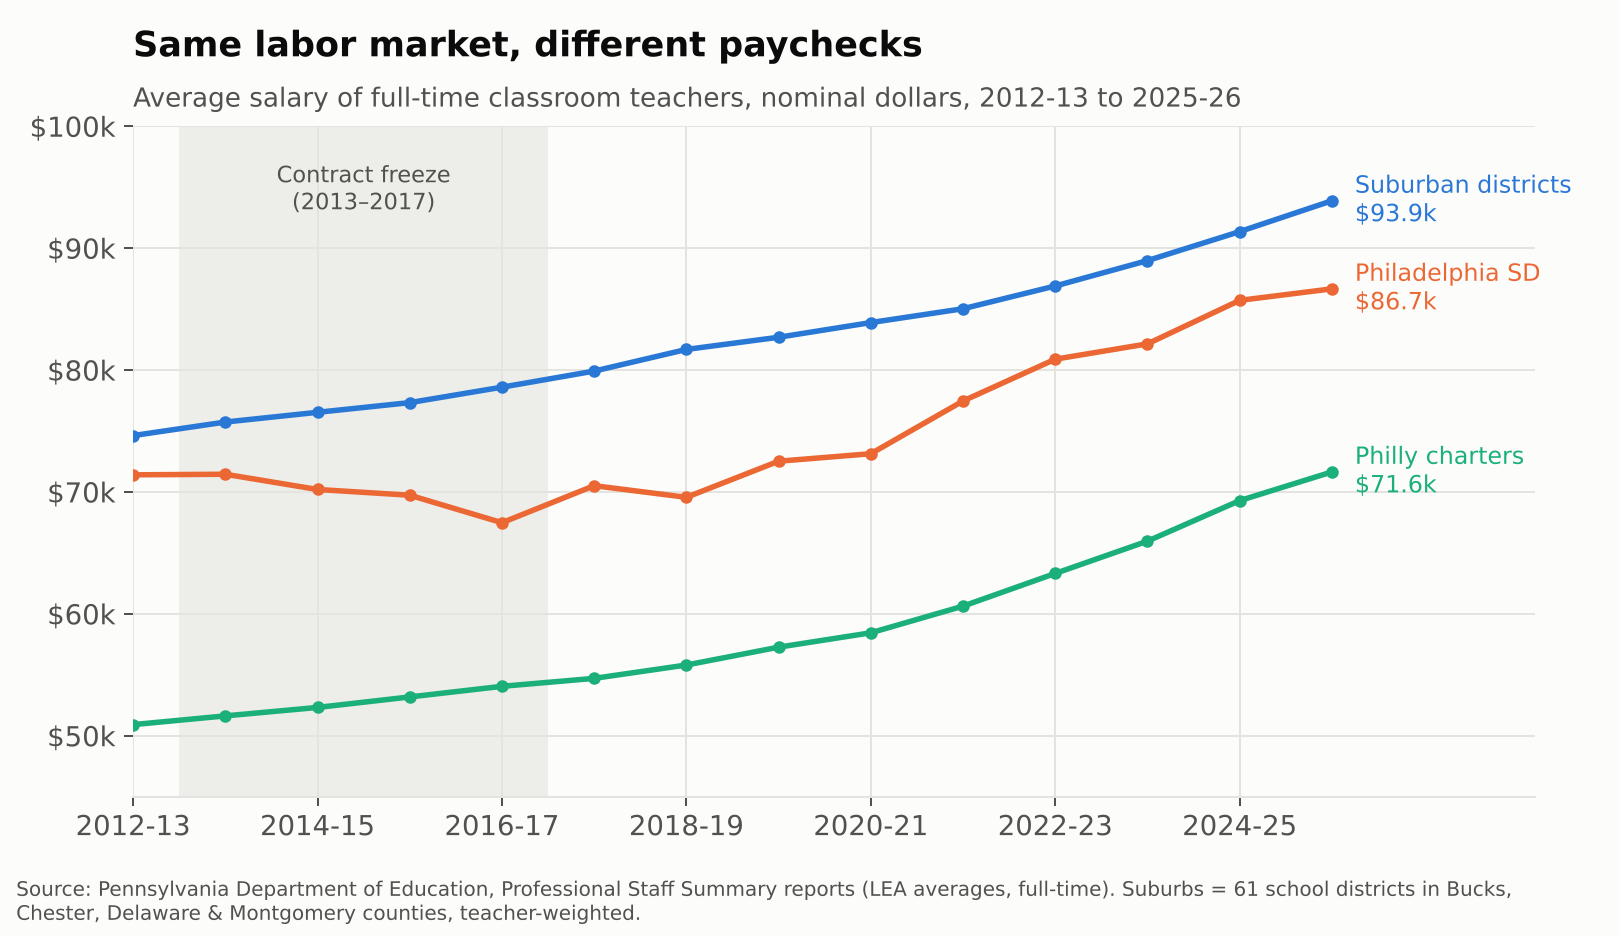
In 2012-13, the average full-time Philadelphia district teacher earned $71,407, about 96% of the suburban average. Then came four years without a contract. By 2016-17, Philly’s average had actually fallen to $67,479 while the suburbs rose to $78,598, a gap of more than $11,000. The district has climbed back since, to $86,664 in 2025-26, but that is still about $7,200 behind the suburbs. Teachers in the city’s charter schools averaged $71,644, roughly three quarters of the suburban figure.

Average teacher salary, Philadelphia SD, Philadelphia charters, and suburbs, 2012-13 to 2025-26

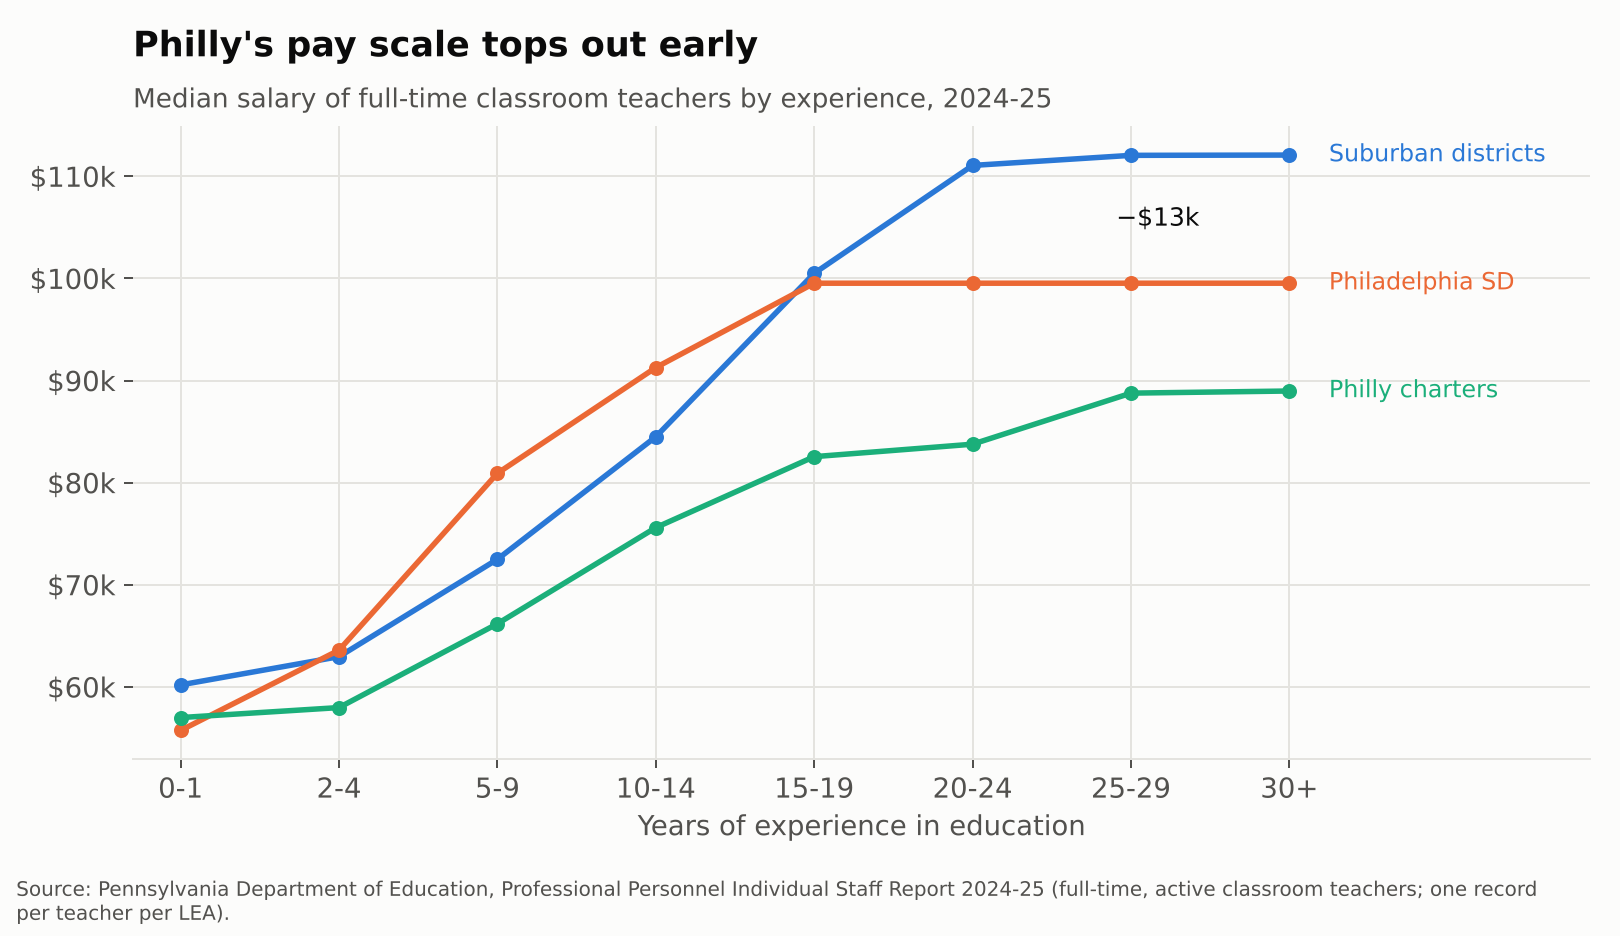
The averages hide where the gap bites. Philadelphia’s current salary scale is competitive in the middle years. Teachers with 5 to 14 years of experience actually earn more than their suburban peers. But the scale flattens at $99,534 after about 15 years. Suburban veterans keep climbing, to a median of about $112,000. A 25-year Philly veteran makes roughly $12,500 less than one in the suburbs.

Median teacher salary by years of experience, 2024-25

That matters for who stays. Philadelphia district teachers average 13.7 years of experience, vs. 15.6 in the suburbs. Charter teachers average 8.9. Every school needs its Barbara Howards. An underfunded system has the hardest time keeping them.

Inside the building: who is actually in front of the kids

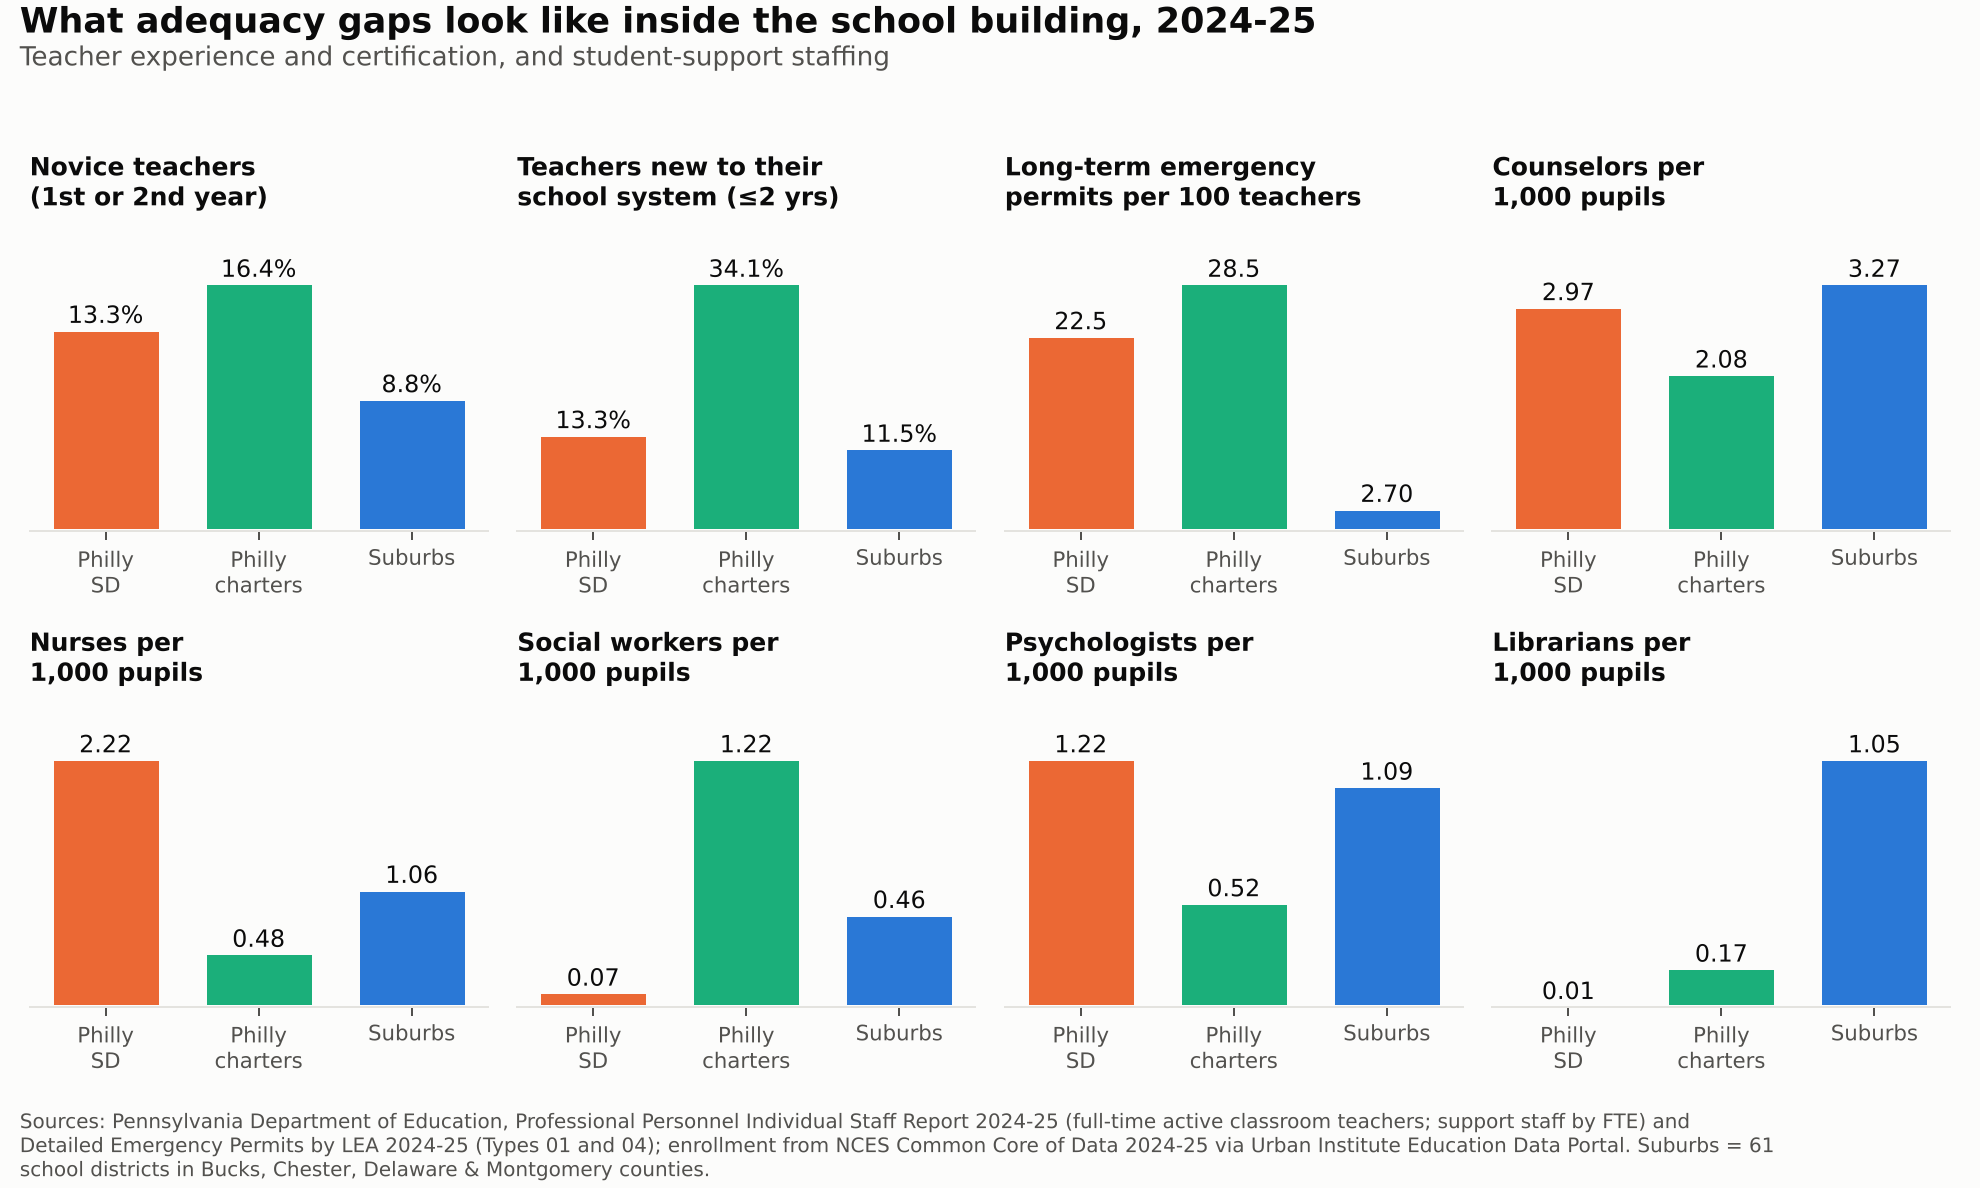
Pennsylvania’s own staff records let us look at who is actually in the classroom, through 2024-25. Janine is not the exception at Abbott. In 2024-25, 13.3% of district teachers were in their first or second year in education, vs. 8.8% in the suburbs. In the city’s charters it was 16.4%, and more than a third of charter teachers had been with their school system for two years or less.

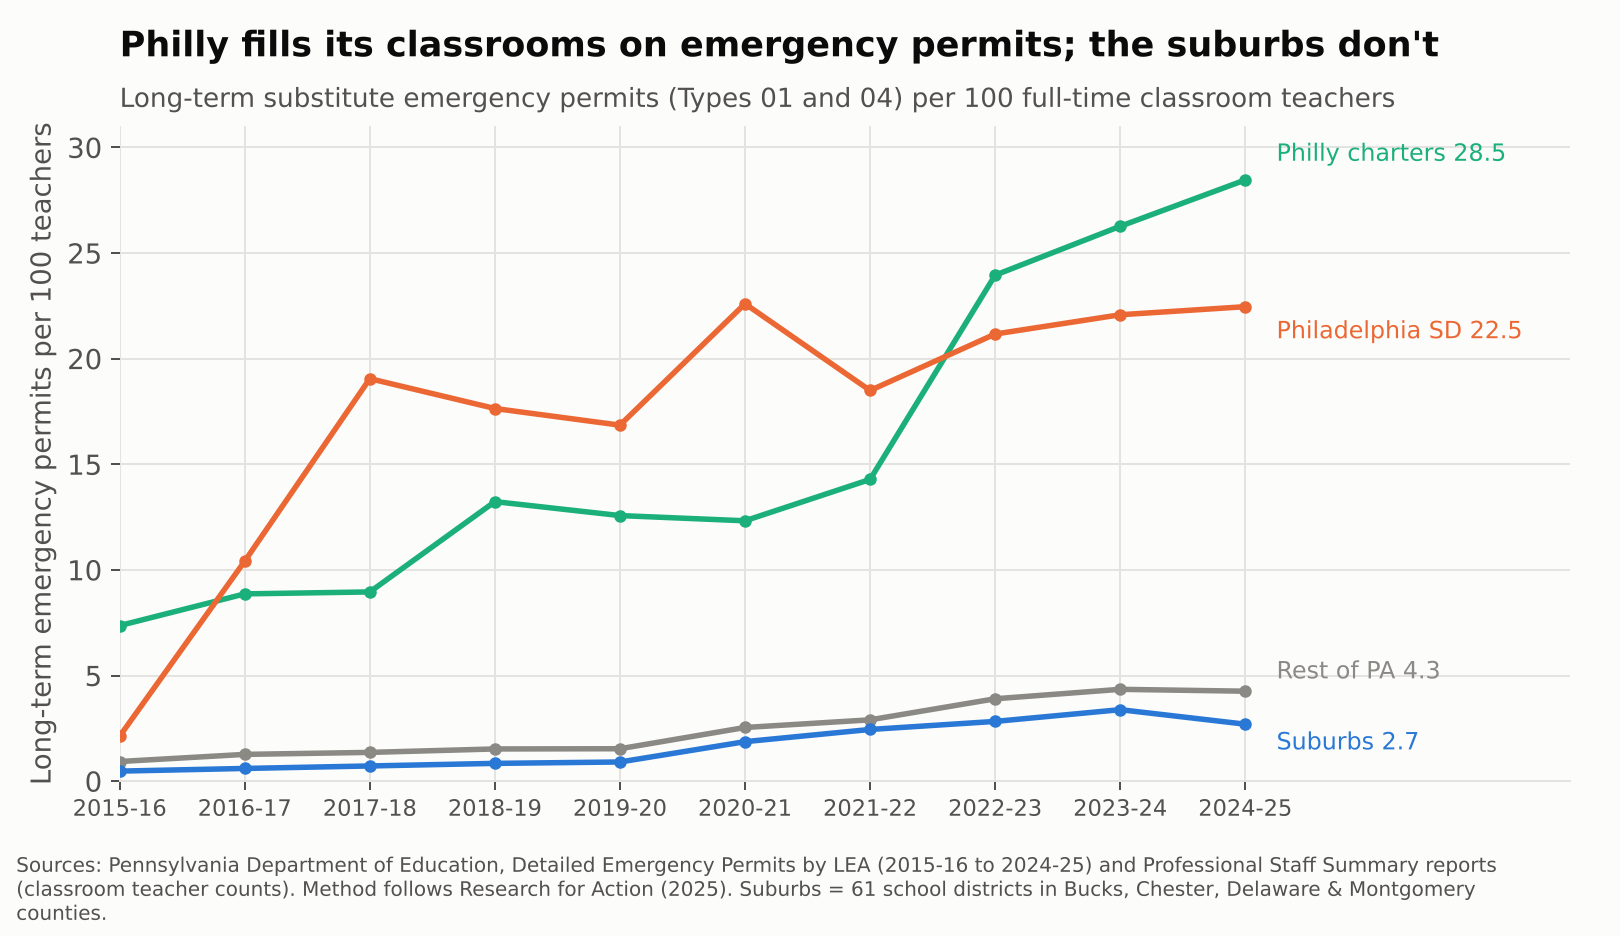
The starkest gap is certification. Pennsylvania lets districts fill vacancies with long-term substitutes on emergency permits when they can’t hire a certified teacher. In 2024-25 the School District of Philadelphia held 22.5 of those permits for every 100 classroom teachers. Philly charters held 28.5. The suburbs held 2.7, and the rest of the state 4.3. Philadelphia’s rate jumped from about 2 to 19 per 100 between 2015-16 and 2017-18, during and right after the contract freeze, and has never come back down.

Long-term emergency permits per 100 classroom teachers, 2015-16 to 2024-25

Support staff tell a more complicated story. After the 2013 layoffs left many schools without counselors or nurses, the district rebuilt. In 2024-25 it reported more nurses and psychologists per 1,000 pupils than the suburbs, and nearly as many counselors (3.0 vs. 3.3). That is what recent money bought. But it is rough parity for students with three times the poverty, and some positions never came back. The district reported 9 social worker FTE and 1 librarian for about 120,000 students. The suburbs had about 148 social workers and 342 librarians for 325,000.

Novice teachers, emergency permits, and support staffing, 2024-25: Philadelphia district, Philadelphia charters, suburbs

Teachers are also absent more. In the most recent federal data with that measure, 2017-18, 46% of district teachers missed 10 or more days, vs. 38% in the suburbs.

The show is entertaining. The damage is real.

Abbott Elementary works because its teachers are heroic and funny and stubborn. Real Philadelphia teachers are too. But heroism is not a funding formula. Year after year, the data show the same chain: Pennsylvania’s system leaves Philadelphia, Reading, Allentown, Harrisburg and their peers far below what their students need. That shortfall becomes fewer teachers per child, a pay scale that stops rewarding veterans, more novices and uncertified teachers, and libraries with no librarians.

The Commonwealth Court said in 2023 that this system violates the state constitution. The new adequacy aid is a start, and the recent staffing gains show money does show up in classrooms when it arrives. But a district still roughly $10,000 per child short of adequacy in 2022-23 will not close that gap with a few hundred million dollars spread across the state.

Janine shouldn’t have to fix the copier herself. And the kids in her class shouldn’t have to be in a sitcom for anyone to notice.

Data notes and sources

  • Adequacy: School Finance Indicators Database, District Cost Database 2026 (v6), National Education Cost Model estimates of required spending to reach national-average outcomes. Spending is current spending per pupil, direct to elementary and secondary education, in current dollars. Years are school years (2023 = 2022-23).
  • Suburbs: the 61 regular school districts in Bucks, Chester, Delaware and Montgomery counties, enrollment-weighted unless noted. Metro comparisons for other Pennsylvania cities use Census CBSAs from the NCES Common Core of Data.
  • Staffing: teachers per pupil from the NCES Common Core of Data LEA universe; teacher absences from the Civil Rights Data Collection; both via the Urban Institute Education Data Portal. Philadelphia SD figures cover district-run schools; charters report separately.
  • Classroom staffing and certification: Pennsylvania Department of Education Professional Personnel Individual Staff Report 2024-25 (teacher experience; counselors, psychologists, nurses, social workers and librarians by FTE) and Detailed Emergency Permits by LEA, 2015-16 to 2024-25. Permit-rate method from Research for Action (2025).
  • Teacher pay: Pennsylvania Department of Education, Professional Staff Summary and Professional Personnel Individual Staff reports, full-time classroom teachers.
  • Caveats: NECM estimates are model-based and benchmarked to grade 3–8 math and reading outcomes. Emergency permit rates count long-term substitute permits (Types 01 and 04) per full-time classroom teacher, following Research for Action (2025); a permit is not an FTE, so read them as rates of reliance, not exact shares of classrooms. Teacher absences come from the 2017-18 Civil Rights Data Collection, the latest year with that item.
  • Related: Rachel Wessler’s earlier Shanker Institute reflection on the show, Heartwarming or Heartbreaking; state budget coverage from WHYY.