In my last post I described the Dependent States of America: the states, mostly red, whose schools lean most heavily on federal aid, in many cases because they have chosen to underinvest in their own children. This post looks at the other end of the spectrum. These are the states that fund their schools adequately, including the schools serving the poorest children, and that perform well. And they include the states that, after letting their school funding collapse in the Great Recession, eventually chose to reinvest.
In an earlier working paper, I called these the Education States. They are states where courts have been willing to uphold and enforce education rights, where legislators and governors have funded those rights whether a court ordered them to or not, and which are now positioned to protect their own students while the federal government retreats. I noted then that the Education States are not exclusively blue or northern. The data bear that out, though not by much.
Measuring an Education State
I use three measures. The first two come from the School Finance Indicators Database (SFID), 2026 release, which covers school years through 2023. Funding adequacy compares what districts actually spend per pupil with what our National Education Cost Model estimates they would need to spend to reach national average test scores, given their students’ needs and regional costs. A ratio of 1.00 means spending is exactly adequate; 0.75 means districts spend three-quarters of what they need. I look at adequacy statewide and in each state’s highest-poverty fifth of districts, because a state can be well funded on average while its poorest districts are left behind. The third measure is performance: each state’s 2024 NAEP scores in grade 4 and grade 8 reading and math, expressed as standard deviations above or below the national public school average.
From these, I sort states into three groups:
- Leading: adequate funding statewide and in high-poverty districts (both ratios at or above 1.00), with NAEP performance at or above the national average.
- Close behind: adequate statewide, high-poverty districts at 85% of adequate or better, and NAEP at or above, or within 0.10 standard deviation of, the national average.
- Not there yet: everyone else.
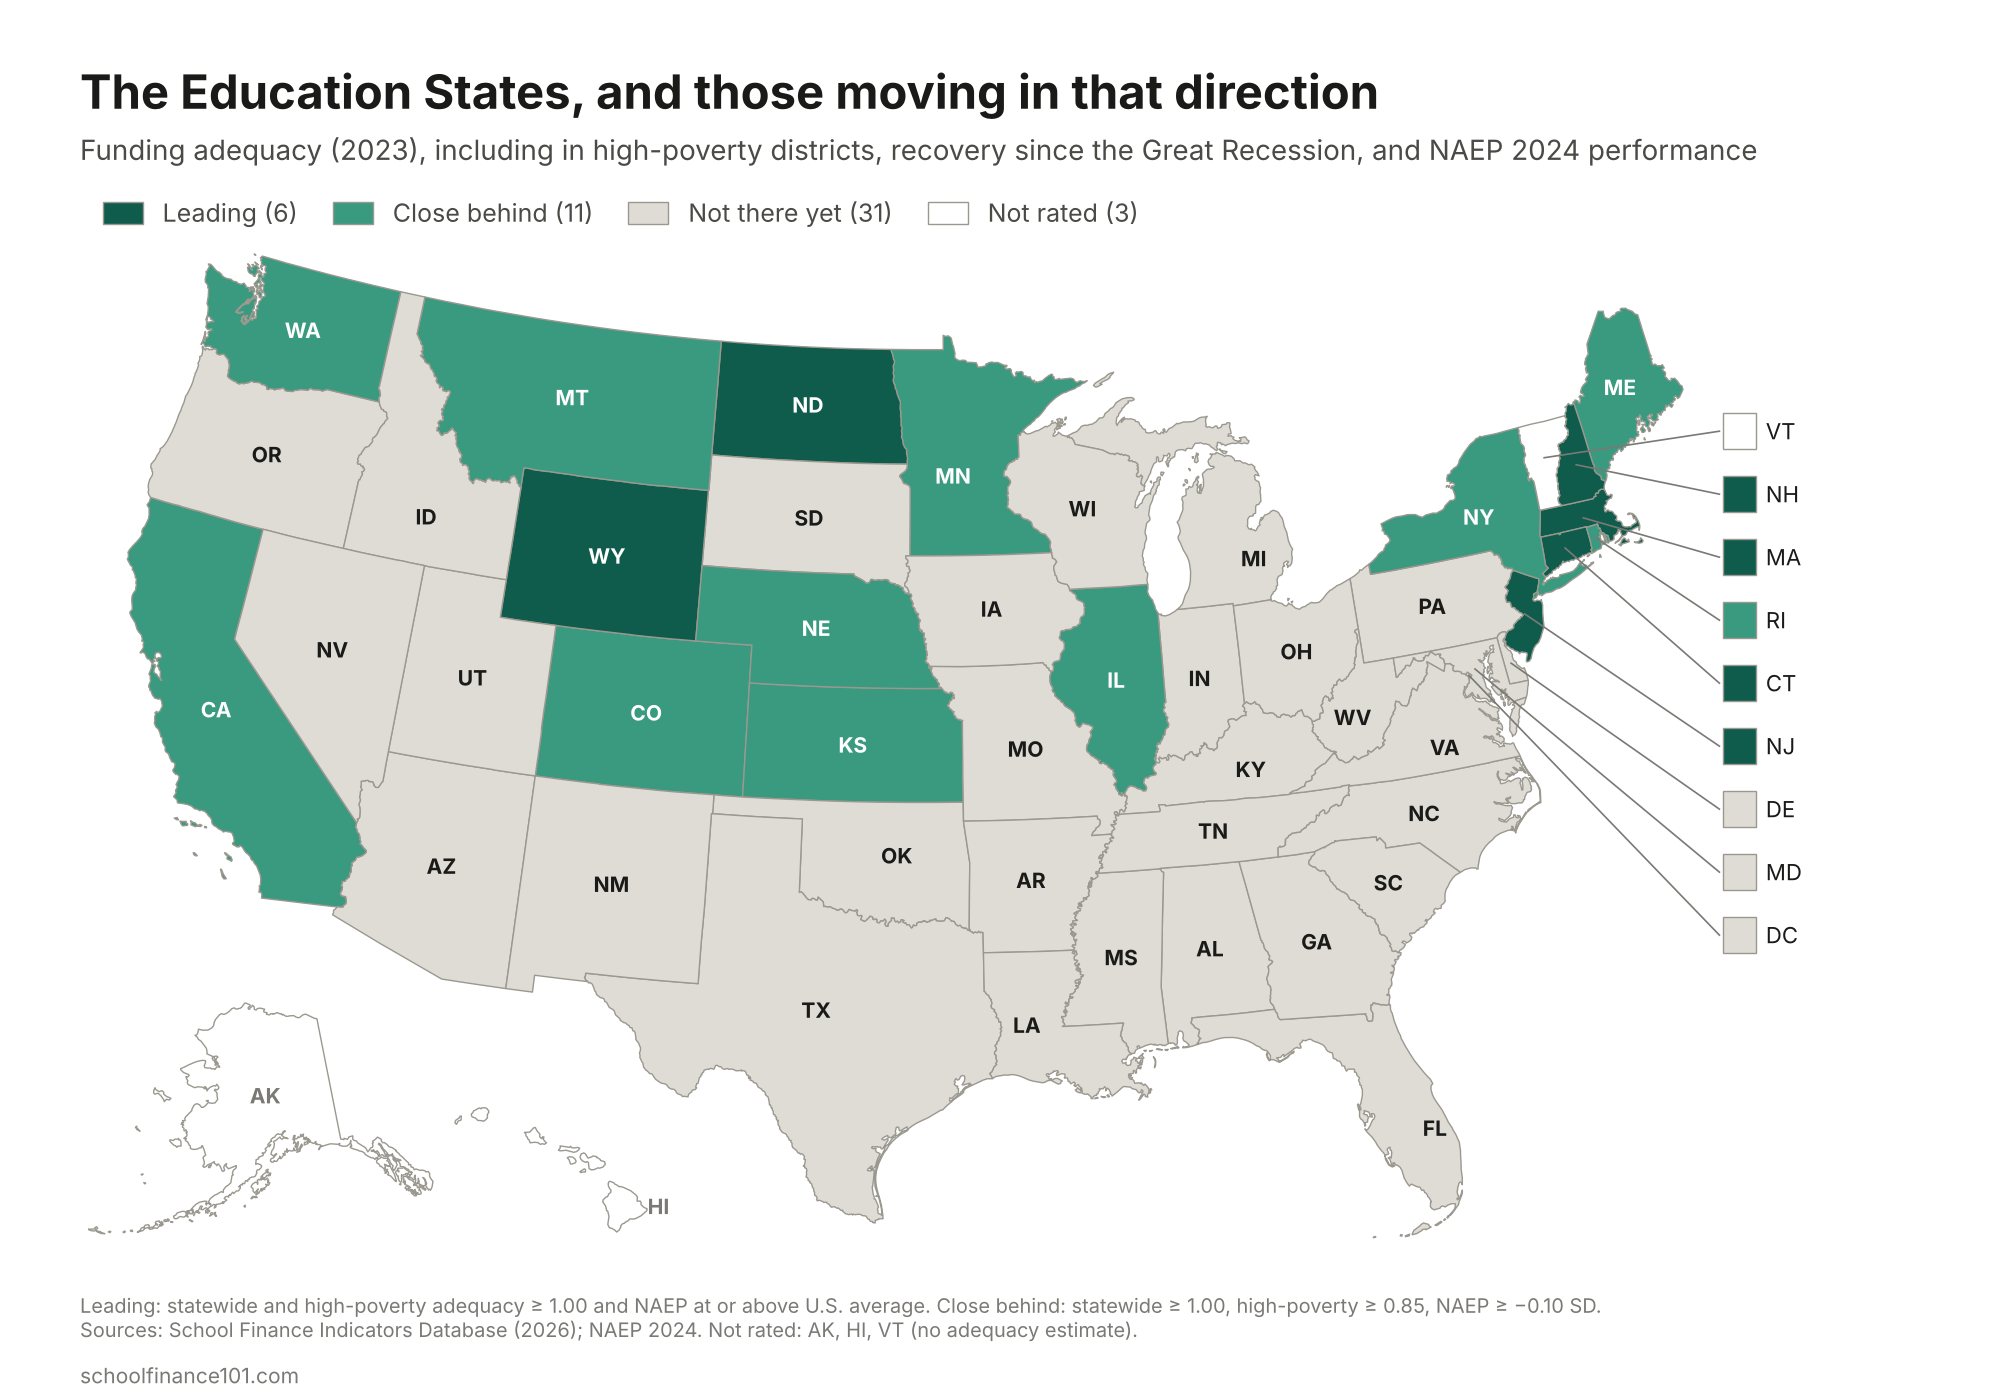
Six states lead: Massachusetts, New Jersey, Connecticut, New Hampshire, Wyoming and North Dakota. Eleven more are close behind, including New York, Maine, Rhode Island, Minnesota, Washington, Colorado, California and Illinois, along with Kansas, Nebraska and Montana. The remaining 31, including nearly the entire South, are not there yet, though several of them are moving in the right direction. (Alaska, Hawaii and Vermont aren’t rated, because the cost model can’t produce reliable estimates for them.)
Funding and performance go together, though not perfectly. Across states, the correlation between statewide adequacy and NAEP performance is about 0.45. Every leading state performs above the national average, with Massachusetts (+0.27 SD) and New Jersey (+0.18) at the top.
The Great Divergence
The Great Recession hit every state’s school budget. What separates the Education States from the rest is what happened next.
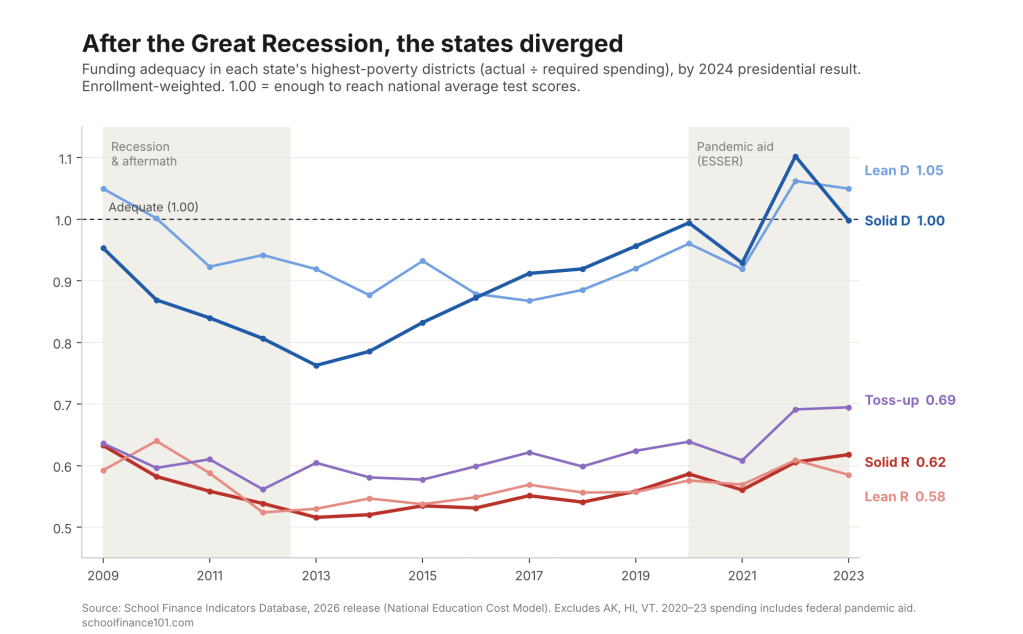
Nationally, adequacy in high-poverty districts fell from 0.79 in 2009 to 0.66 by 2013. Those districts spent, on average, about two-thirds of what they needed. In the states Harris carried by 10 points or more, high-poverty adequacy dropped from 0.95 to 0.76 at its 2013 low. Then those states climbed back steadily, reaching 0.96 by 2019, before any federal pandemic aid arrived, and about 1.00 by 2023. In the states Trump carried by 10 or more, high-poverty adequacy fell from an already low 0.63 to 0.52, crept back only to 0.56 by 2019, and stood at 0.62 in 2023, still below where it was in 2009.
In other words, the gap between blue and red states’ highest-poverty districts was wide before the recession (about 0.32) and wider after the recovery (about 0.40 in 2019). Both groups cut their effort. In 48 of the 50 states with data, state and local school revenue is a smaller share of personal income today than in 2008; only Illinois and Hawaii are exceptions. But the median solidly Democratic state’s effort fell from 4.3% to 3.8%, while the median Lean R state’s fell from 3.8% to 2.4%, a decline of more than a third.
| 2024 result | States | Statewide adequacy, 2023 | High-poverty adequacy, 2009 | Post-recession low | High-poverty adequacy, 2023 | Effort, 2008 → 2023 | NAEP 2024 | Leading / Close behind |
|---|---|---|---|---|---|---|---|---|
| Solid R (R+10 or more) | 24 | 0.82 | 0.63 | 0.52 | 0.62 | 4.3% → 3.5% | 0.00 | 2 / 3 |
| Lean R (R+2 to 10) | 4 | 0.77 | 0.59 | 0.52 | 0.58 | 3.8% → 2.4% | −0.05 | 0 / 0 |
| Toss-up (margin under 2) | 3 | 1.13 | 0.64 | 0.56 | 0.69 | 4.8% → 4.1% | +0.03 | 0 / 0 |
| Lean D (D+2 to 10) | 6 | 1.31 | 1.05 | 0.88 | 1.05 | 4.5% → 3.6% | +0.01 | 2 / 2 |
| Solid D (D+10 or more) | 14 | 1.24 | 0.95 | 0.76 | 1.00 | 4.3% → 3.8% | 0.00 | 2 / 6 |
| United States | 51 | 1.01 | 0.79 | 0.66 | 0.83 | 4.3% → 3.6% | 0.00 | 6 / 11 |
The pattern by political leaning is stark. In states Harris carried, by any margin, high-poverty districts are funded at or near adequate levels on average. In states Trump carried by any margin, they are funded at about 60% of adequate, and that hasn’t changed in fifteen years. The three toss-up states, Michigan, Pennsylvania and Wisconsin, look like their politics: adequately funded on average but with their poorest districts well short, at 0.69.
Average NAEP performance by group is close to the national average across the board. That is partly because group averages blend high and low performers, and partly because performance depends on much more than funding, including child poverty, which is higher in many red states. It’s not that funding doesn’t matter. The leading states all outperform. But money is a necessary condition, not a sufficient one.
The Education States, by name
| State | Statewide adequacy | High-poverty adequacy: 2009 → low → 2023 | Effort | NAEP | Reinvested | 2024 margin |
|---|---|---|---|---|---|---|
| Leading | ||||||
| Wyoming | 1.80 | 2.10 → 1.78 → 1.93 | 3.71% | +0.15 | R+45.8 | |
| New Hampshire | 2.07 | 1.45 → 1.31 → 1.54 | 3.34% | +0.16 | Yes | D+2.8 |
| New Jersey | 1.69 | 1.38 → 1.10 → 1.26 | 5.16% | +0.18 | D+5.9 | |
| Massachusetts | 1.54 | 1.36 → 0.99 → 1.15 | 3.23% | +0.27 | D+25.2 | |
| North Dakota | 1.33 | 0.90 → 0.71 → 1.12 | 3.51% | +0.09 | Yes | R+36.5 |
| Connecticut | 1.57 | 1.36 → 1.13 → 1.07 | 4.07% | +0.11 | D+14.5 | |
| Close behind | ||||||
| New York | 1.46 | 1.22 → 1.00 → 1.09 | 5.02% | −0.03 | D+12.6 | |
| Maine | 1.56 | 1.11 → 0.93 → 1.09 | 3.73% | −0.07 | D+6.9 | |
| Washington | 1.35 | 0.74 → 0.66 → 0.96 | 3.38% | +0.04 | Yes | D+18.2 |
| Rhode Island | 1.32 | 1.04 → 0.82 → 0.94 | 3.82% | 0.00 | D+13.8 | |
| Colorado | 1.16 | 0.73 → 0.56 → 0.92 | 3.04% | +0.14 | Yes | D+11.0 |
| Minnesota | 1.18 | 0.78 → 0.74 → 0.92 | 3.47% | +0.10 | D+4.2 | |
| Kansas | 1.14 | 0.99 → 0.76 → 0.91 | 4.16% | 0.00 | R+16.1 | |
| Montana | 1.07 | 0.75 → 0.71 → 0.91 | 2.76% | +0.09 | Yes | R+19.9 |
| Nebraska | 1.13 | 0.92 → 0.87 → 0.89 | 3.69% | +0.03 | R+20.5 | |
| California | 1.09 | 0.59 → 0.46 → 0.89 | 4.03% | −0.08 | Yes | D+20.1 |
| Illinois | 1.14 | 0.69 → 0.66 → 0.87 | 4.68% | +0.05 | Yes | D+10.9 |
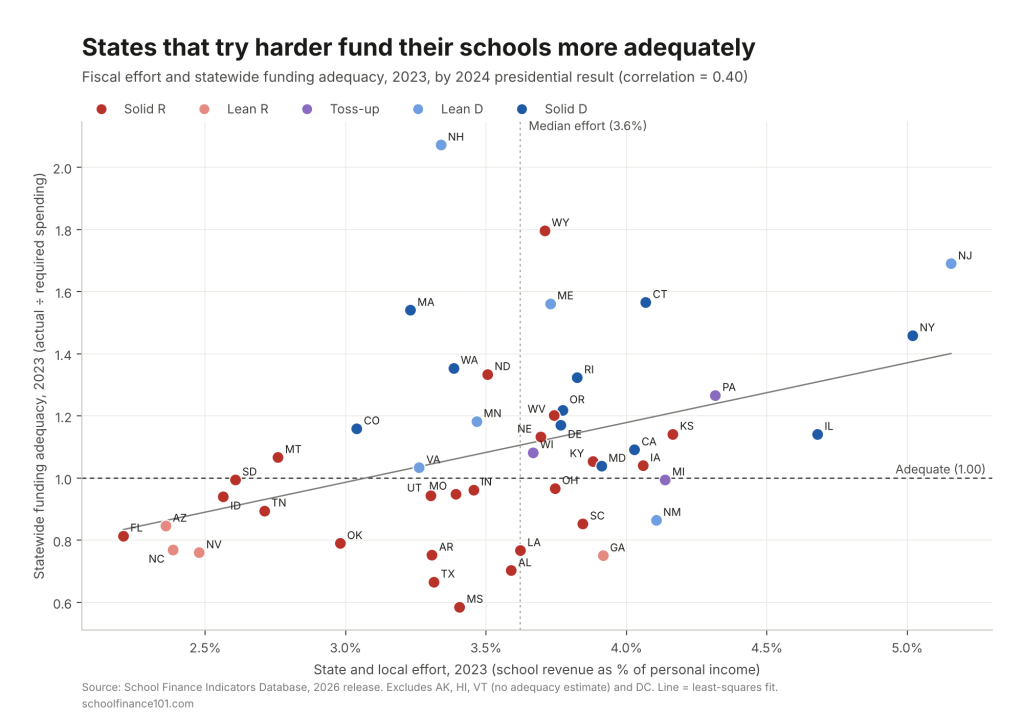
Effort explains a good share of the difference. Across the 47 states with estimates (excluding DC), state and local effort and statewide adequacy are correlated at about 0.40. Of the 23 states putting in less than the median effort (3.6% of personal income), 17 voted for Trump, and only 8 fund their schools adequately statewide. Of the 24 at or above the median, 18 do. Twenty-one states fall below adequacy statewide, and 19 of them voted for Trump. The exceptions run in both directions. New Hampshire, Massachusetts, Washington and Colorado reach adequacy with below-median effort because they are wealthy. Georgia, South Carolina and New Mexico put in above-median effort and still fall short, because their capacity is lower and their needs are higher. But the lower-left corner of the chart, low effort and inadequate funding, belongs almost entirely to Republican-leaning states: Florida, Arizona, North Carolina, Nevada, Idaho, Tennessee and Oklahoma.
Of the 17 leading and close-behind states, 12 voted for Harris and five for Trump. The red Education States fall into two types. Wyoming and North Dakota are small, energy-rich states that can fund adequate schools without exceptional effort. Wyoming’s effort has actually fallen from 5.8% of personal income in 2008 to 3.7%, but its funding is built on decades of court-enforced adequacy under the Campbell County decisions. Kansas, Nebraska and Montana are more traditional Plains states with long-standing commitments to their public schools. Kansas, in particular, was pulled back by its courts. After deep cuts under Governor Brownback, the Gannon litigation forced a multi-year reinvestment that the Kansas Supreme Court finally approved in 2019. Its high-poverty adequacy, stuck at 0.75 as late as 2019, reached 0.91 by 2023.
Nor is being blue enough. Maryland (high-poverty adequacy 0.71), Virginia (0.68), New Mexico (0.67) and Delaware (0.98, but with NAEP well below average) are all “not there yet.” And several of the leading states have slipped. Connecticut’s high-poverty districts went from 1.36 in 2009 to 1.07, and New Jersey’s from 1.38 to 1.26. Both are still adequate, but the margin is narrower than it was.
The states that eventually reinvested
The most hopeful part of the story is the states that hit bottom after the recession and then chose to rebuild, mostly through new funding formulas, often prompted by litigation, and mostly well before federal pandemic aid arrived.
- California adopted the Local Control Funding Formula in 2013, directing additional funding to low-income students and English learners. High-poverty adequacy rose from 0.46 in 2012 to 0.74 by 2019 and 0.89 by 2023, the largest gain of any state.
- Washington, under the state supreme court’s 2012 McCleary decision, overhauled its funding in 2017 and 2018. High-poverty adequacy rose from 0.66 to 0.96.
- Illinois replaced one of the nation’s most regressive systems with its Evidence-Based Funding formula in 2017, and is one of only two states whose effort is higher now than in 2008. High-poverty adequacy rose from 0.66 to 0.87.
- Oregon passed the Student Success Act in 2019. High-poverty adequacy rose from 0.63 to 0.99 by 2019 and stood at 0.94 in 2023.
- Colorado rose from 0.56 to 0.92 even before eliminating its “budget stabilization factor” in 2024. That change isn’t yet in these data.
- Massachusetts and New Jersey, both already adequate, recommitted through the Student Opportunity Act (2019) and New Jersey’s 2018 school funding reform (S2), respectively, reversing post-recession erosion.
A second wave of reinvestment is too recent to show fully in data that end in 2023. Kansas is one example. Maryland’s Blueprint for Maryland’s Future, enacted in 2021, has moved high-poverty adequacy from 0.53 in 2019 to 0.71. New Mexico, responding to the 2018 Yazzie/Martinez ruling, has moved from 0.48 to 0.67. Michigan’s 2023 budgets began to fund its new Opportunity Index. Pennsylvania’s Commonwealth Court declared the state’s system unconstitutional in 2023, and the legislature has begun adding adequacy funding. Whether these states become Education States depends on whether they sustain the effort.
Not every state that recovered deserves the credit. Arizona, Tennessee, South Dakota and Missouri also improved high-poverty adequacy from their post-recession lows, but their effort kept falling. Arizona’s dropped from 3.7% of personal income in 2008 to 2.4%, and Tennessee’s from 3.4% to 2.7%. Their gains came from economic growth, not renewed commitment, and several are now expanding universal vouchers that will pull money away from the public districts these figures describe. Utah is the more convincing case: its high-poverty districts are now at 0.94 of adequate and its students outperform the national average by 0.15 SD.
Then there are the states that never came back. Florida’s high-poverty adequacy is lower now (0.70) than in 2009 (0.76), and its effort has fallen from 3.8% to 2.2%, the lowest in the country. North Carolina (0.61 to 0.55; effort 3.6% to 2.4%) and Texas (0.56 to 0.52) followed the same path. Iowa, whose high-poverty districts were adequately funded in 2009 (1.01), has slid to 0.82.
Leading the way
The Great Recession was a natural experiment in political will. Every state took a hit. Some states rebuilt, usually because courts insisted or because legislatures and governors decided their poorest children deserved better. Others took the opportunity to cut taxes and never looked back. Fifteen years later, the result is two countries: one where children in high-poverty districts attend schools funded at roughly the level needed to reach national average outcomes, and one where they attend schools funded at about 60% of that level.
The Education States now carry a double burden. In the short term, they must protect their own students from a federal administration that is withholding funds, dismantling the Department of Education and targeting equity itself. That means backfilling lost federal aid, building their own data capacity as NCES and IES are hollowed out, setting aside reserves (as I’ve proposed, through federally tax-exempt education endowments), and closing the door to publicly funded religious and discriminatory schooling by tightening charter oversight before the courts force it open.
In the longer term, they are the model for Project 2029. The states that reinvested after the recession show that the decline is a choice and can be reversed. They also show what reversing it takes: a cost-based formula, a commitment of state revenue, and in most cases a court willing to hold the state to its constitution. A federal foundation aid formula of the kind we’ve proposed would ask every state to do what California, Washington, Illinois and Kansas did, with federal help for states whose capacity genuinely falls short. The Education States have already shown the rest of the country the way. The question is whether the rest of the country will follow.
Data notes
- Adequacy, effort and spending figures are from the School Finance Indicators Database, State Indicators Database, 2026 release (school years through 2023). Adequacy is actual current spending per pupil divided by required spending per pupil, estimated by the SFID National Education Cost Model to reach national average test scores. The model doesn’t produce estimates for Alaska, Hawaii, or Vermont after 2016, and SFID advises caution in interpreting New York’s estimates.
- 2020 to 2023 spending includes some federal pandemic relief (ESSER) funds, which raise adequacy in absolute terms in those years. For that reason, the reinvestment test requires that recovery was already under way by 2019. Effort is a strictly state and local measure and is unaffected.
- Group adequacy figures are enrollment-weighted, pooling all states in each group. Effort and NAEP group figures are median and simple mean across states, respectively. Effort is state and local school revenue as a share of aggregate personal income.
- NAEP performance is the average of 2024 grade 4 and grade 8 reading and math scale scores, each expressed as the difference from the national public school average divided by the national standard deviation (NAEP Data Service).
- Political leaning is based on the statewide popular-vote margin in the 2024 presidential election (FEC certified results). Solid = 10 points or more; Lean = 2 to 10 points; Toss-up = under 2 points.
- Baker, B. D., Di Carlo, M., & Weber, M. (2026). The Adequacy and Fairness of State School Finance Systems (8th ed.). Albert Shanker Institute, University of Miami and Rutgers Graduate School of Education.


