Yesterday I took a look at America’s bottom five states for education: Nevada, Texas, North Carolina, Florida and Arizona, states that could do far better by their children and choose not to. Fair is fair. Today, the other end of the list. It also picks up where two recent posts left off: The Dependent States of America, on the states that lean on federal aid because they underinvest in their own kids, and The Education States that Will Lead the Way.
Can, and do
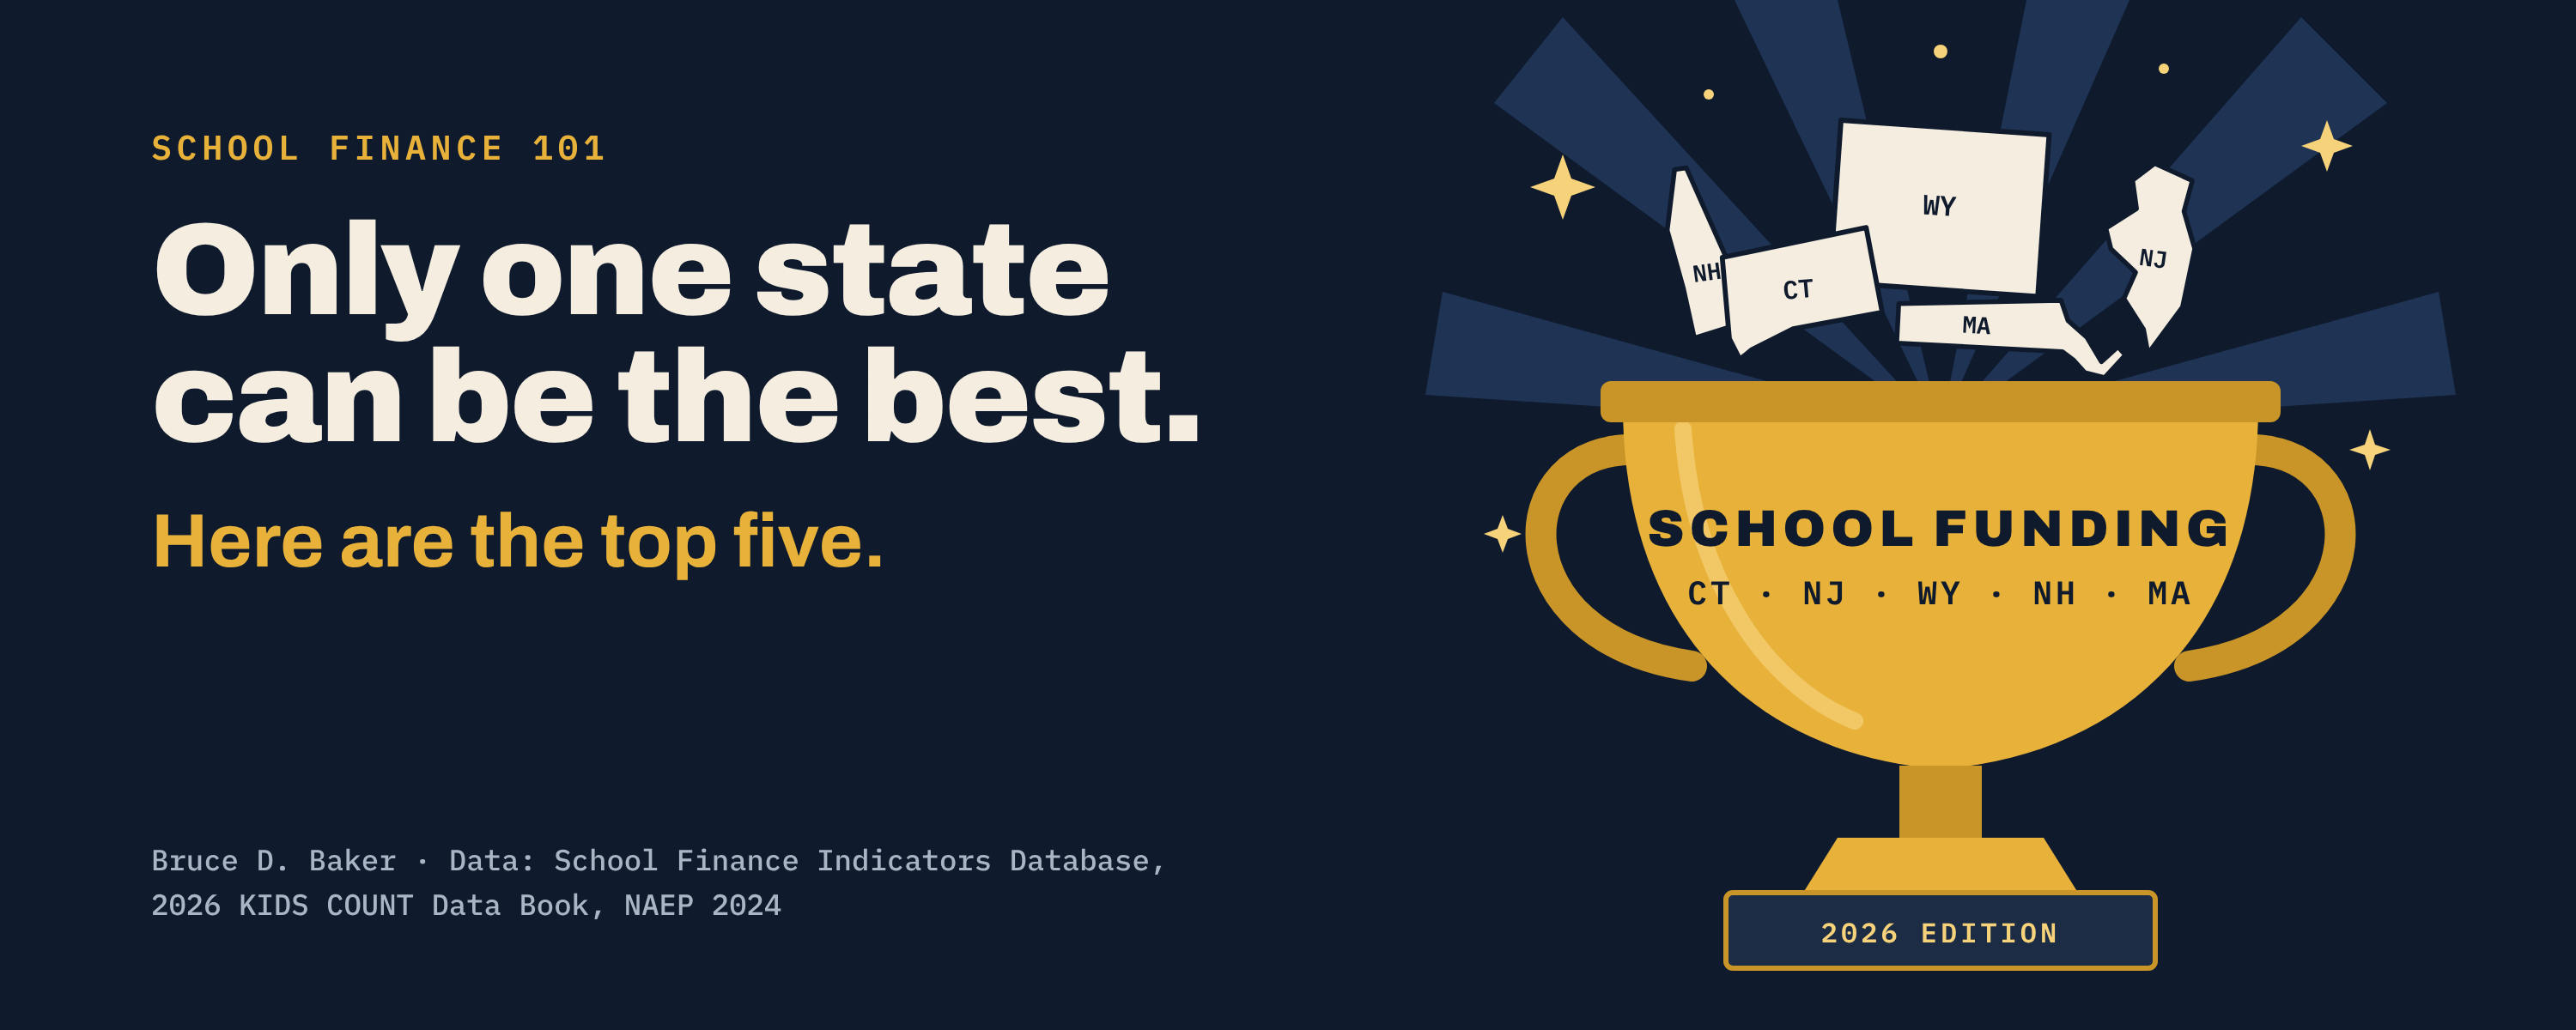
America’s best states for education are Massachusetts, New Jersey, New Hampshire, Wyoming and Connecticut. Not simply because they’re wealthy, but because they fund their schools adequately, and their students show it, on test scores and on broader measures of child well-being.
Being rich isn’t the same as being good, and good scores aren’t the same as good policy. The question here mirrors yesterday’s, flipped: which states fund their schools adequately and get strong results for kids? And it means treating effort, the share of its economy a state puts into its schools, a little differently. Yesterday, low effort was a stain because it left children in inadequately funded schools, by choice. A state that puts a smaller share of its economy into schools but still funds them well above adequate, and gets top results, isn’t making that choice. So here, low effort counts against a state only when it comes with inadequate funding.
One warning up front. None of these states provides equal educational opportunity, and only Wyoming comes close. Connecticut, New Jersey and Massachusetts have some of the largest gaps between rich and poor districts in the country. “Best” here means best available, not good enough.
How I picked them
I used the same sources as the bottom five, with the flags flipped, and added actual student outcomes and equal educational opportunity. A state earns a star for each of the first three measures below, plus or minus half a star for equal opportunity, and loses half a star for low effort that leaves its schools underfunded (finance data are for 2022-23):
- High statewide adequacy. Top ten on how far the typical student’s district spends above its National Education Cost Model target, the cost of reaching national average math and reading scores given local poverty, wages and scale. (Why cost, not raw spending, is the right yardstick: Illustrations: Why “Cost” Matters and Efficiently Mediocre.)
- Child well-being. Top ten in the 2026 KIDS COUNT Data Book.
- Student outcomes. Top ten on 2024 NAEP, averaging standardized state scores across 4th and 8th grade math and reading (state scores).
- Equal opportunity (half weight). Plus half a star for an opportunity gap smaller than the median state’s (−38 points) with high-poverty districts still funded at or above adequate, so states can’t earn it by underfunding everyone equally. Minus half a star for a gap in the worst quarter of states (−63 or worse, 11 states).
- Low effort that leaves schools underfunded (half-star penalty). Fiscal effort, state and local K-12 revenue as a share of gross state product (SFID, 8th ed.), below the median state’s 3.22 percent, and a typical student in a below-adequate district. That’s the stain: a state that could do more choosing not to, with children paying for it. Fifteen states get this flag, including all of yesterday’s bottom five. Lower effort on its own costs nothing.
Ties are broken by NAEP.
| State | Effort (% GSP, rank) | Effort change since 2006 (pts) | Typical student vs. adequate (rank) | Opportunity gap (pts) | KIDS COUNT 2026 rank | NAEP 2024 rank | Stars |
|---|---|---|---|---|---|---|---|
| Massachusetts | 2.79% (#35) | −1.05 | +54% (#6) | −104 | 2 | 1 | 2½ |
| New Jersey | 4.90% (#1) | −0.23 | +69% (#3) | −109 | 6 | 2 | 2½ |
| New Hampshire | 3.26% (#23) | −0.74 | +107% (#1) | −63 | 1 | 3 | 2½ |
| Wyoming | 3.48% (#14) | +0.04 | +80% (#2) | −6 | 12 | 4 | 2½ |
| Connecticut | 3.91% (#3) | +0.12 | +57% (#4) | −148 | 7 | 8 | 2½ |
All five land at two and a half stars. Four of them earn all three full stars and lose half a star for fairness; Wyoming misses the well-being star but earns the fairness bonus. NAEP breaks the tie: Massachusetts, New Jersey, New Hampshire, Wyoming, Connecticut. Next come Minnesota and Wisconsin at two stars each, earned on outcomes alone, then Utah and North Dakota at one and a half.
Notes: effort change, typical-student adequacy and high-poverty adequacy are my calculations from the SFID State Indicators Database (2026 release). The NAEP ranking is my calculation from published 2024 state averages for public schools. It orders states almost exactly as Business Insider’s ranking of the same tests does. Opportunity gap = adequacy of the 40 percent highest-poverty districts minus the 40 percent lowest-poverty districts, as published in the SFID report; closer to zero is more equal. Raw NAEP scores partly reflect student poverty, which is one reason funding and fairness count here too. SFID doesn’t estimate adequacy for Alaska, Hawaii or Vermont, so they can’t earn star 1 or the equal-opportunity adjustment.
The top five
1. Massachusetts
Massachusetts makes the list on results. It ranks 1st on NAEP, with the highest average in the country on all four 2024 tests (225 and 246 in 4th grade reading and math; 268 and 283 in 8th, where Wisconsin ties it in math). It ranks 2nd on KIDS COUNT, and its typical student is in a district spending about 54 percent above adequate (6th).
Its effort is 2.79 percent of GSP, 35th in the country and below the national average, and it’s one of only three states whose effort fell by a full percentage point or more since 2006 (with Indiana and West Virginia). On yesterday’s list, that would be a stain. Here it isn’t, because a large, high-income economy means even below-average effort buys a lot: its typical student is still funded well above adequate, and its kids lead the nation. Massachusetts built that lead on the 1993 Education Reform Act and extended it with the 2019 Student Opportunity Act. The risk is that, as a share of its economy, it keeps spending the lead down. Its opportunity gap (−104), the fourth-largest in the nation, costs it half a star. For how Massachusetts and New Jersey stack up against the voucher states, see Red State, Blue State, Round Two: Arizona & Florida vs. New Jersey & Massachusetts.
2. New Jersey
New Jersey has the highest fiscal effort in the nation, 4.90 percent of GSP. For scale: Arizona would have to raise its K-12 revenue by about 150 percent to match it. New Jersey’s typical student is in a district spending about 69 percent above adequate (3rd), the state ranks 6th on KIDS COUNT, and it ranks 2nd on NAEP behind only Massachusetts (222 and 240 in 4th grade; 266 and 282 in 8th).
This didn’t happen by accident. It is the product of decades of Abbott v. Burke litigation and a weighted, need-based formula in the School Funding Reform Act of 2008. Thanks to that, New Jersey’s high-poverty districts are funded nearly 50 percent above adequate, better than the typical district in all but a handful of states. But its opportunity gap (−109) is still among the largest in the country, driven mostly by how much its wealthiest districts spend, and that costs it half a star. On what New Jersey’s formula needs now, see Reforming New Jersey School Funding in 2026; on why the spending-and-scores graphs creeping into its funding debate mislead, Misinform, Not Inform. The Education Rights Project page has an animation of New Jersey districts against the Massachusetts standard, 2009–2024.
3. New Hampshire
New Hampshire’s numbers look almost too good. The typical student’s district spends about 107 percent above the NECM target, the highest in the nation. Just 0.1 percent of students attend a below-adequate district. New Hampshire ranks 1st on KIDS COUNT and 3rd on NAEP (221 and 242 in 4th grade; 264 and 280 in 8th). SFID’s state profile gives it an overall score of 90, third of 47 states rated.
But this is a low-cost, low-poverty state with a lot of local property wealth. Its effort (3.26 percent, 23rd) is only average and has dropped 0.74 points since 2006, costing schools about $2.81 billion (10.7 percent) over 2016–2023. And it has a real equal-opportunity problem. Its opportunity gap (−63) is the 11th-largest in the country, enough to cost it half a star, and SFID rates its equal opportunity “low.” The gap is driven mostly by how lavishly its wealthiest towns spend; its highest-poverty districts are still funded about 78 percent above adequate, better than the typical district in most states. New Hampshire is well funded largely because its towns are rich, not because the state makes it so, which is what the Claremont litigation has been about for three decades.
4. Wyoming
Wyoming is the surprise, and on fairness, the model. Its typical student is in a district spending about 80 percent above the NECM target, second only to New Hampshire. Its effort (3.48 percent, 14th) is above average, and it’s another of the five states that held to or exceeded its 2006 effort level every year from 2016 to 2023. Its students rank 4th on NAEP, and its 4th graders’ math average (243) is tied for second in the country.
What sets Wyoming apart is equal opportunity, the only state on this list to earn the bonus. Its opportunity gap is just −6 points, the smallest in the country: its highest-poverty districts are funded about as far above adequate (+83 percent) as its most affluent ones. That’s no accident. Since the Campbell County decisions of the 1990s, Wyoming has funded schools through a cost-based model built from what districts actually need. Wyoming ranks 12th on KIDS COUNT, just outside the top ten.
5. Connecticut
Connecticut earns all three full stars, and it gets there the hard way. It puts 3.91 percent of its economy into K-12, third in the nation, and it’s one of just five states that stayed above its own 2006 effort level in every year from 2016 to 2023 (SFID). Its typical student attends a district spending about 57 percent above the NECM adequacy target, fourth-best in the country. Connecticut ranks 7th on KIDS COUNT and 8th on NAEP, beating the national average on all four 2024 tests (219 and 239 in 4th grade reading and math; 263 and 277 in 8th grade).
Then it loses half a star. Connecticut has the second-largest opportunity gap in the country (−148 points), behind only New York. Its high-poverty districts are still funded above adequate, but its affluent suburbs are funded to achieve far more. Bridgeport and New Britain have shown up on my lists of America’s most financially disadvantaged districts for more than a decade, from the 2015 edition to the latest, for 2022–2024. Still a top-five state, with a very big asterisk.
A big asterisk. Connecticut makes this list on averages, and averages are where inequality goes to hide. On equal educational opportunity, Connecticut is a disaster, and its racial and economic segregation is a huge liability. It ranks 46th of 47 states on equal opportunity in our latest SFID report. By my measures it has the largest racial school funding gap in the nation. The fifth of students in its whitest districts attend schools funded at about 201 percent of adequate; the fifth in its most Black and Hispanic districts, about 73 percent. Its funding system has slid from one of the more progressive in the country in the early 2000s to the fourth most regressive. And 13 districts serving about 124,000 students, 12 of them majority Black and Hispanic, fall short of even national-average adequacy. The light weight this scorecard puts on fairness flatters Connecticut more than any other state on the list.
Connecticut’s high averages are the same defense the State of Kansas offered in Montoy v. State two decades ago. In closing argument, the state’s attorney told Shawnee County District Judge Terry Bullock that Kansas’s schools were “producing meaningful results for most children.” Bullock’s reply, in his December 19, 2003 order, fits Connecticut today:
“The Court will never forget Mr. Weltz’s statement in closing argument in this case when he said, in haec verba, ‘Our education system is strong and is producing meaningful results for most children.’ This case, of course, is about the rest of those children.”
Judge Terry Bullock, Memorandum Decision and Order, Montoy v. State, No. 99-C-1738, Shawnee County District Court, December 19, 2003
Connecticut is the same story. Most of its kids are doing fine, and its overall outcomes are among the best in the country. But a great many of its children, concentrated in Bridgeport, Hartford, Waterbury and other high-poverty, majority Black and Hispanic districts, are deeply deprived. For a state that otherwise does so well, that is a huge problem. Any honest ranking of Connecticut has to be about the rest of those children. (For where Kansas stands two decades after Montoy, see my Kansas & Missouri policy brief.)
For the full picture, see my Connecticut Equal Educational Opportunity policy brief and Reforming School Finance in Connecticut slide deck on the Education Rights Project page, and my recent posts Challenge Accepted: How Connecticut Became the Poster Child for Educational Inequality and The collapse of fairness in Connecticut school funding.
What they have in common
The common thread is adequacy plus results. All five rank in the top six on typical-student adequacy and the top eight on NAEP, and all five beat the national average on every 2024 NAEP test. How they pay for it differs. New Jersey, Connecticut and Wyoming back it with sustained, above-average effort; Wyoming and Connecticut are two of only eight states putting at least as large a share of their economies into schools as they did in 2006. New Hampshire and Massachusetts get there on average or below-average effort, because their economies are big enough that it still buys adequate schools. Compare that to the bottom five: four of them are the four lowest-effort states in the country, and all five fund their typical student below adequate.
Four of the five also have something the bottom five lack: a school funding formula forced into shape by courts. Abbott in New Jersey, Campbell County in Wyoming, Claremont in New Hampshire, McDuffy behind the 1993 reform in Massachusetts. Litigation isn’t sufficient, as Connecticut’s CCJEF case shows, but in these states it set the floor.
The caveat that matters
Educational opportunity is unequal in every state, these five included. Only Wyoming earns the equal-opportunity bonus. Connecticut (−148), New Jersey (−109), Massachusetts (−104) and New Hampshire (−63) all have gaps well beyond the median state’s (−38). In each, the gap is driven at least as much by how lavishly affluent districts spend as by shortfalls in poor ones.
That isn’t a reason to level down. Wealthy communities investing in their kids is a good thing. But it does mean the job in these states is to raise the floor: drive targeted state aid to high-poverty districts until they’re funded as far above adequate as the suburbs next door. Wyoming shows it can be done. Its gap is −6.
Note: the state with the next-smallest opportunity gap after Wyoming is Florida (−8), which gets there by underfunding nearly everyone. Equal is only good when it’s also adequate. More in Florida School Finance Update: Here’s your manageable standard, now fund it!
Honorable mentions
North Dakota is the oddity. Its effort is modest: 2.59 percent of GSP, 41st, the same as Texas. But its economy is large relative to its student population, so modest effort still buys adequate funding (typical student about 33 percent above target, 9th), spread fairly evenly (an opportunity gap of −23, earning the half-star bonus). It ranks 12th on NAEP and 14th on KIDS COUNT, just outside on both. Same effort as Texas, very different result. That’s a reason for Texas to try harder, not praise for North Dakota’s effort.
Maine tries hard. It ranks 8th on effort (3.69 percent) and 5th on adequacy, with a typical student about 56 percent above target. But it ranks only 21st on KIDS COUNT, and its 2024 NAEP scores were the lowest in three decades. Its opportunity gap (−71) also costs it half a star. Money is necessary, not sufficient.
Illinois is the most-improved story. It ranks 4th on effort (3.86 percent), and its effort is up 0.43 points since 2006, the largest increase of any state. Much of that reflects the 2017 Evidence-Based Funding formula; The Red State Miracle That Wasn’t tracks what it bought against Texas and Florida. But it is still climbing out of a deep hole: adequacy ranks only 18th, and its opportunity gap (−80) is wide. Chicago and Waukegan are fixtures on my most-disadvantaged lists. Check back in a few years.
Pennsylvania ranks 2nd in the nation on effort (3.97 percent), but its money is badly distributed. Adequacy ranks 11th, the opportunity gap is −103, and in 2023 the Commonwealth Court ruled the system unconstitutional. Reading, Allentown and Philadelphia have long topped my lists of the most financially disadvantaged districts in the country. Philadelphia spent about 55 percent of what it would cost to reach national-average outcomes in 2024, about where it was in 2009; see A Philadelphia Story of Underfunding.
New York and Rhode Island put a lot in, ranking 7th and 6th on effort, and earn the adequacy star (7th and 10th). Then they lose half a star each for opportunity gaps of −151 and −96, the largest and sixth-largest in the nation. Neither ranks in the top 25 on NAEP or KIDS COUNT. On New York, see What’s up with New York State School Finance? and my policy brief on Foundation Aid and the small city districts. SFID urges caution with New York’s adequacy estimates, which rely on imputed test data.
Notable misses
Minnesota and Wisconsin earn two stars each, both on outcomes: top-ten NAEP (9th and 10th) and top-ten KIDS COUNT (5th and 8th). Neither earns the adequacy star. Minnesota ranks 30th on effort; Wisconsin is about average (21st), with a typical student only about 8 percent above adequate. Minnesota’s averages also hide wide gaps; see Minnesota’s Equal Educational Opportunity Problem and the Minnesota funding and outcome gaps animation, national vs. Massachusetts standards on the Education Rights Project page. Utah has the same two outcome stars (5th on NAEP, 3rd on KIDS COUNT) but loses half a star. It ranks 39th on effort (2.60 percent), and its typical student is in a district spending about 6 percent below adequate. That’s exactly the stain this scorecard penalizes: low effort that leaves schools underfunded. These are states where kids do well in spite of their funding systems, helped in part by comparatively low child poverty.
Vermont ranks 4th on KIDS COUNT but can’t be scored. SFID doesn’t publish Vermont effort or adequacy estimates because of irregularities in its data since 2017.
What the bottom five could learn
Put the two lists side by side and the lesson is plain. All five of the top states fund their typical student well above what it costs to reach national-average outcomes, and all five beat those outcomes comfortably. New Jersey, Connecticut and Wyoming get there with large, sustained commitments of their own economies, and Wyoming shows that adequate and equal can go together. New Hampshire and Massachusetts get there with average or below-average effort, and that’s fine as long as the money is enough, though both have let effort slide since 2006, and that cushion isn’t permanent. The bottom five can’t say any of this. Their low effort leaves their schools underfunded, by choice, and their kids pay for it.
The gap between the lists is a choice, not a law of nature. If Arizona put New Jersey’s share of its economy into its schools, its K-12 revenue would rise by about 150 percent. If North Carolina matched even Wyoming’s effort, it would add roughly 70 percent. Nobody is asking Nevada to become Connecticut overnight. But the states at the top of this list show what sustained commitment buys. And yes, money matters, and the evidence keeps piling up, all the way through to state economic growth (Human Capital Pays, If You Count the Cost).
They also show its limits. Even the best states leave their poorest children with less than their richest. Being the best, in American school finance, still isn’t the same as being fair.
Sources and data notes
- Baker, Di Carlo & Weber (Feb. 2026), The Adequacy and Fairness of State School Finance Systems, 8th ed.: effort ranks, opportunity gaps, and the states above their 2006 effort, 2022-23. See also the report summary.
- SFID State Indicators Database, 2026 release: my calculations of effort change since 2006, typical-student adequacy and high-poverty adequacy (NECM funding gap as a share of estimated cost).
- SFID New Hampshire state profile, 2026.
- Annie E. Casey Foundation, 2026 KIDS COUNT Data Book, via Becker’s full ranking.
- 2024 NAEP state average scale scores (NCES), compiled by US School Index and cross-checked against Business Insider’s state ranking.
- Maine Morning Star, Maine students score lowest in three decades.
- Companion post: America’s Worst States for Education (2026 Edition).
Notes: adequacy is not estimated for Alaska, Hawaii or Vermont. Interpret New York’s adequacy estimates with caution. All rankings are relative across states, using SFID’s modest benchmark of national-average test scores.


