Figure 1 – left panel – compares nominal per pupil spending by U.S. Census Poverty rates for all school districts nationally. Per pupil spending is measured as a ratio of each school district’s spending to the average spending for all other districts in the same labor market (metropolitan or micropolitan core based statistical area or rural area outside of CBSA, within each state). A district with a spending ratio of 1.0 would be spending at the average of those districts around it. This approach compares districts subject to similar input prices. What we see here is that on average, districts with higher rates of child poverty tend to have higher per pupil spending. In fact, moving from 0% to 100% child poverty would be associated with .62 increase in per pupil spending (from average to 62% above average). More realistically, within the actual range of data, the highest poverty district would be expected to have about 31% higher relative spending than the lowest poverty district, in 2023, weighted for district enrollment. That sounds rather progressive. But, is it progressive enough? To provide equal opportunity? Similarly, as we can see in Figure 2 – left panel – districts that serve majority black student enrollments tend to be above the “average” line, while also being generally high in child poverty rate. Measured this way, a district that is 100% black would be expected to have about 25% higher relative spending. Again, progressive.
Figure 1 – right panel – shows what happens when we measure current spending with respect to the cost of achieving national average outcomes in reading and math. Despite the uphill (progressive) slope in the left panel, we see a regressive slope with respect to poverty in the right panel. If the slope in left panel was steep enough – progressive enough – the right panel would have all districts falling along the horizontal line. The right panel captures both adequacy and equal opportunity. Adequacy – measured as a low bar of national average outcomes in reading and math, is captured in the dashed horizontal line. Many low poverty (left) districts spend well above what would be needed to achieve merely “adequate” outcomes measured by this low bar. Meanwhile, most high poverty districts and nearly all majority black districts fall below spending needed to achieve “adequate” outcomes. The distance of each district to the horizontal line, or ratio to it, measures equal educational opportunity.
Figure 1
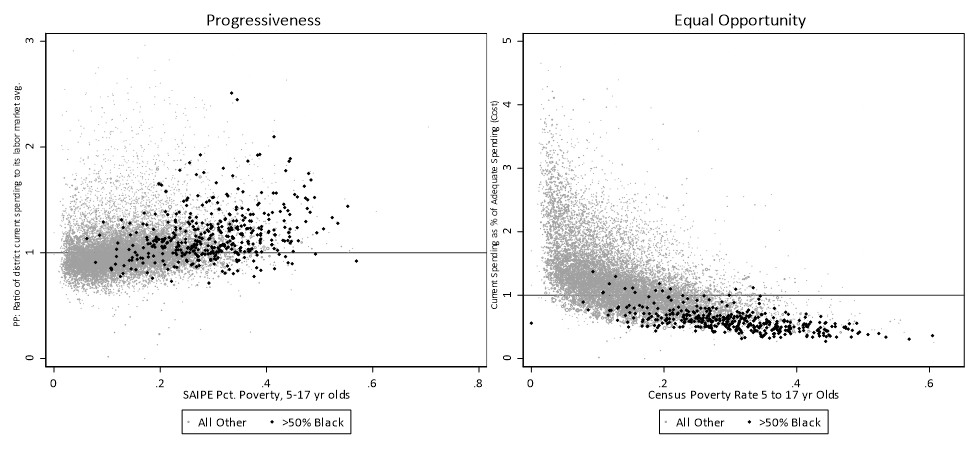
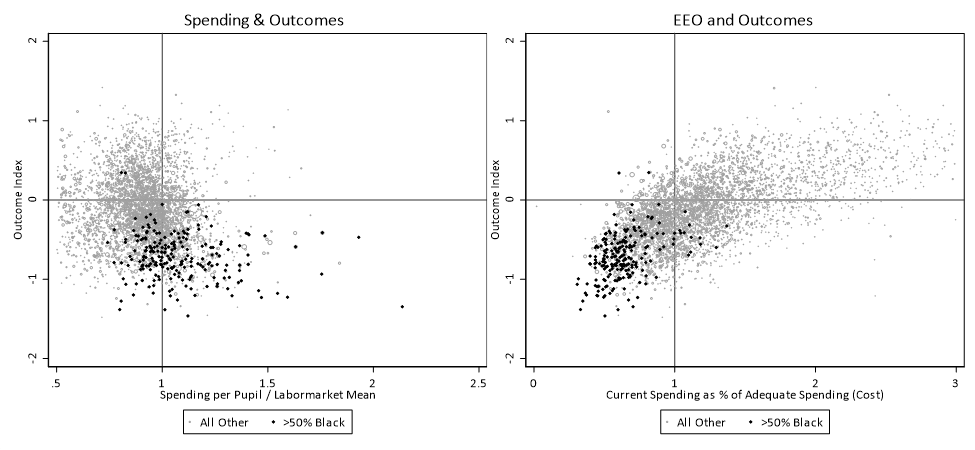
Figure 2 shows why this reframing is so important. It is important that we understand the outcome implications of inadequate funding. That the goal of a well-designed funding formula is to ensure that all children have resources adequate to achieve a common set of educational outcomes. State school accountability systems are premised on as much – that all children are expected to achieve “X.” And that school and district officials shall be subject to penalties if or when they do not. That is, even if the state has not calibrated the school funding formula to provide equal opportunity to do so.
Figure 2 – left panel – shows that if we look just a relative spending and student outcomes, higher spending districts have lower outcomes, with majority black districts having relatively higher spending but particularly low outcomes (combined, normed index of reading and math achievement). The opposite is true (right panel) when comparing the adequacy of spending to outcomes – more adequate spending leads to higher outcomes, consistent with the research on how and why money matters. Additionally, the adequacy of district spending explains nearly 40% of outcome variation, whereas relative spending alone explains about 5%, but in the “wrong” direction. Spending adequacy is simply the better, more correct (more valid[1]) measure for comparing access to fiscal resources across children and setting. These are the same data used above, also for 2023. Collectively what Figures 2 and 3 tell us is that while spending on average is “progressive” it is far from “progressive enough,” leaving large gaps in equal educational opportunity, including significant racial gaps.
Figure 2
[1] Valid in the sense that the measure has predictive validity – can predict the outcome measures of interest (with the correct sign, sufficient magnitude and variance explained) – which, in this case are measured student outcomes in reading and math. See also: Baker, B. D. (2006). Evaluating the reliability, validity, and usefulness of education cost studies. Journal of Education Finance, 32(2), 170-201.
