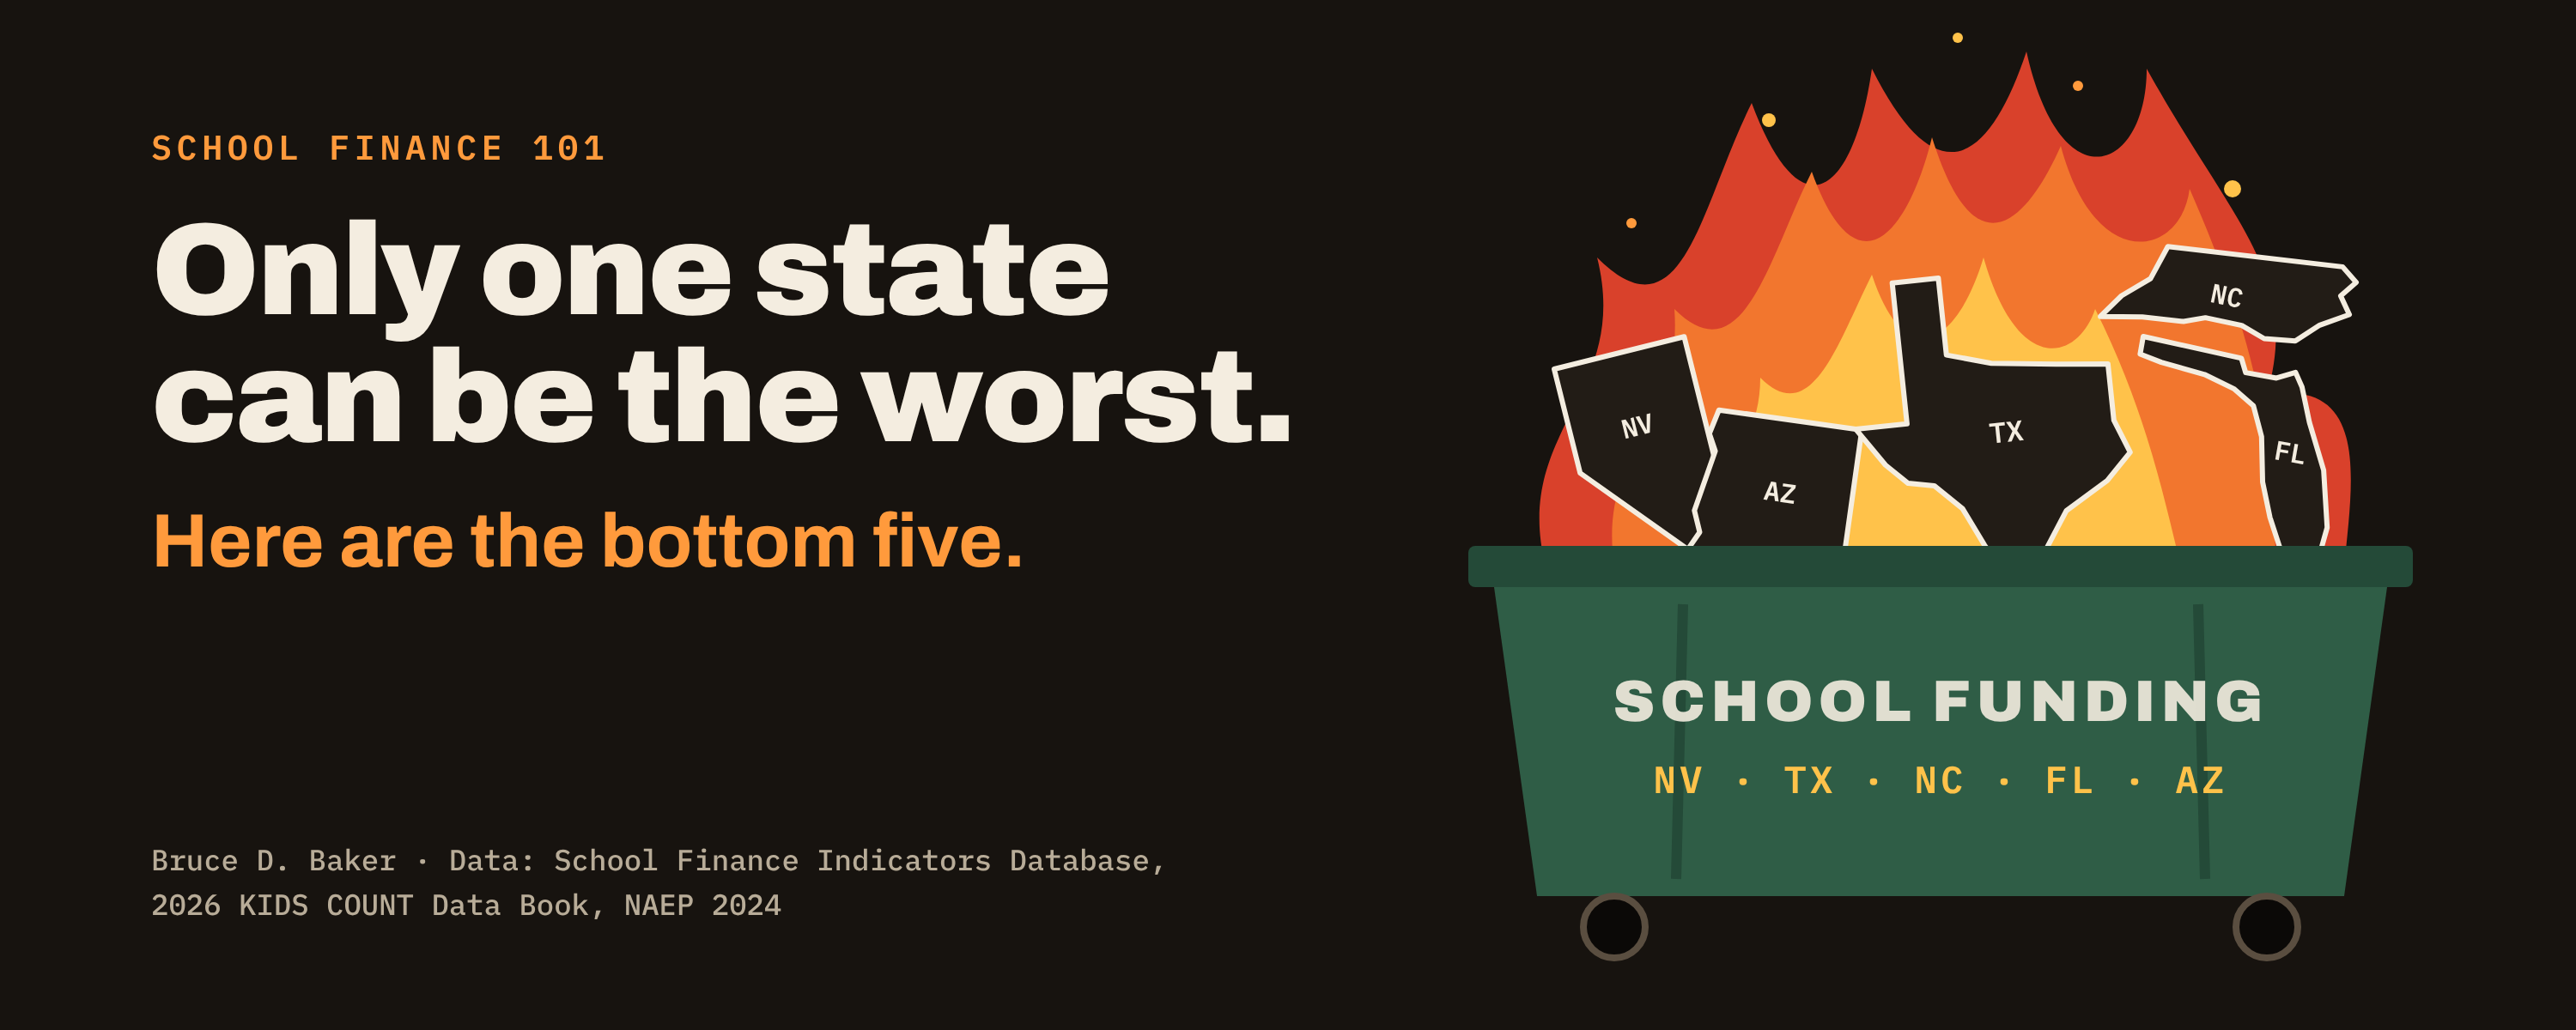
Often when I speak to large national groups in the US, those in the room wish to proclaim their state as the worst on education funding. But only one state can really hold that position. Here, I take a look at the bottom five.
Can’t versus won’t
America’s worst states for education are Nevada, Texas, North Carolina, Florida and Arizona. Not because their kids are the poorest or their test scores the lowest, but because they could do far better by their children and choose not to.
Every summer brings another round of “best and worst states for schools” listicles. Most mash together spending, class size, test scores, safety and whatever else is lying around, then hand out a rank. They tend to reward states for being rich and punish them for being poor. That tells us who has the money. It doesn’t tell us who is failing to use it.
So here’s a different question. Which states pair weak outcomes for kids with a deliberate refusal to put their own economic capacity toward fixing them? Those states aren’t unlucky. They’re making a choice.
How I picked them
I counted red flags on four measures, then used NAEP as a check on outcomes. A state earns a flag for each of the following:
- Low fiscal effort. Bottom ten on state and local K-12 revenue as a share of gross state product, 2022-23 (SFID, 8th ed.). The U.S. average is 3.13 percent.
- Chronic underfunding. At least half of students in “chronically underfunded” districts, the 20 percent of districts nationally furthest below their National Education Cost Model (NECM) adequacy targets. Ten states meet that bar.
- Deliberate choice. Named in the SFID report as low-adequacy and low-effort, meaning inadequate funding is at least partly a policy choice, not a capacity problem.
- Child well-being. Bottom ten in the 2026 KIDS COUNT Data Book, which scores 16 indicators across economics, education, health and family/community.
The NECM benchmark is modest: what each district would need to spend to reach national average math and reading scores in grades 3–8, given its poverty, labor costs and size.
| State | Effort (% GSP, rank) | ≥50% chronically underfunded | SFID “deliberate choice” | KIDS COUNT 2026 rank | NAEP Core 2024 rank | Flags |
|---|---|---|---|---|---|---|
| Nevada | 2.10% (#47) | Yes | Yes | 46 | not available | 4 |
| Texas | 2.59% (#40) | Yes | Yes | 44 (tie) | 36 | 4 |
| North Carolina | 2.05% (#49) | Yes | Yes | 32 | not available | 3 |
| Florida | 2.19% (#46) | Yes | Yes | 35 | 27 | 3 |
| Arizona | 2.10% (#48) | No | Yes | 40 | not available | 2 |
Arizona ties several states at two flags. It takes the fifth slot because its retreat from its own pre-recession effort is the largest SFID highlights (−35 percent), which I’ll get to below. NAEP Core ranks (4th and 8th grade math and reading pooled) come from the University of Oklahoma’s Fall to 48th report; I only have them for the states it lists.
The bottom five
1. Nevada
Nevada hits every flag I can measure. It puts 2.10 percent of its economy into K-12, 47th in the country. At least half its students attend chronically underfunded districts, and SFID names it among the states where that’s a choice. Kids pay for it outside school too: Nevada ranks 46th on KIDS COUNT, ahead of only Alaska, Louisiana, New Mexico and Mississippi. On NAEP, Nevada had the seventh-lowest 8th grade math proficiency rate in 2024, with about one in five 8th graders proficient.
This is a state with a casino-and-tourism economy and no personal income tax. It has capacity. It just doesn’t point it at kids.
2. Texas
Texas also hits all four flags, and it does so at a scale no other state on this list approaches. Effort is 2.59 percent of GSP (40th) (SFID). At least half of Texas students are in chronically underfunded districts. Texas ties Oklahoma at 44th on KIDS COUNT. Its NAEP Core rank of 36th is middling, which tells you something: Texas kids are outperforming what Texas is willing to pay for.
And because Texas enrolls so many children, its choices shape the schooling of a very large share of the nation’s underfunded students.
3. North Carolina
North Carolina has the lowest fiscal effort in the nation, 2.05 percent of GSP. It has a large, growing economy and chooses to devote less of it to public schools than any other state. Unsurprisingly, at least half of its students sit in chronically underfunded districts, and SFID lists it among the deliberate-choice states.
North Carolina’s KIDS COUNT rank (32nd) is better than the others on this list. That’s the point: this is a state with the economic and social base to do far better. Instead, it has spent roughly three decades litigating the Leandro case over whether the state is meeting its own constitutional duty to provide a sound basic education.
4. Florida
Florida devotes 2.19 percent of GSP to schools (46th). Had it held to its own 2006 effort level, its schools would have had about 29 percent more state and local revenue from 2016 to 2023, among the steepest losses in the SFID report. At least half of Florida students are in chronically underfunded districts.
Here’s the twist. Florida posts one of the smallest opportunity gaps between high- and low-poverty districts in the nation (−8 points). That isn’t equity. It’s what happens when nearly everyone is underfunded: there isn’t enough money in the system to generate much inequality. Florida ranks 35th on KIDS COUNT and 27th on NAEP Core.
Note: SFID’s opportunity gap compares adequacy in the 40 percent highest- and lowest-poverty districts in each state, in percentage points.
5. Arizona
Arizona puts 2.10 percent of its economy into K-12 (48th). Few states have walked away from their schools faster: had Arizona kept its 2006 effort level, its schools would have had about 35 percent more state and local revenue from 2016 to 2023, the largest proportional loss the SFID report highlights. To reach New Jersey’s effort level, Arizona would have to raise K-12 revenue by about 150 percent.
Arizona is on SFID’s deliberate-choice list and ranks 40th on KIDS COUNT. On NAEP, its 4th graders scored below the national average in both math and reading in 2024; only about a quarter were proficient in reading, and nearly half scored below Basic.
What they have in common
All five are low-effort states with the economic capacity to do more. Four of the five are the four lowest-effort states in the country (NC, AZ, NV, FL), and all five appear on SFID’s list of states where inadequate funding reflects, at least in part, a policy choice. That’s the common denominator: not poverty, not geography, but priorities.
The cost lands unevenly. Nationally, 75 percent of Black students attend districts funded below NECM adequacy levels, versus 37 percent of white students; for chronically underfunded districts it’s 57 percent versus 18 percent. Hispanic students are almost 70 percent more likely than white students to be in an underfunded district. States like Texas, Florida and Nevada, with large Black and Hispanic enrollments and chronically underfunded systems, are where those national gaps are made.
None of this is a pandemic story. U.S. average effort fell from 3.59 percent of GSP in 2006 to 3.13 percent in 2023, and 42 states now put a smaller share of their economies into schools than before the Great Recession. Had states simply held their 2006 effort levels, schools would have had about $575 billion more from 2016 to 2023. The five states here just went further down that road than almost anyone.
Note: the post-2020 dip in effort partly reflects unusually fast GSP growth, not only budget cuts; Matt Barnum at Chalkbeat also raised whether federal COVID aid let states ease off.
The children’s rights picture rhymes. Human Rights Watch’s state scorecard finds no state above a C on child marriage, corporal punishment, child labor and juvenile justice; 16 states get an F. Corporal punishment remains legal in both public and private schools in 22 states. A country that won’t ratify the Convention on the Rights of the Child leaves those guarantees to the states, and the states on this list have chosen to guarantee children rather little, starting with their schools.
Dishonorable mentions
Oklahoma would make any outcomes-only list. It ranks 48th on NAEP Core, ahead of only West Virginia, Alaska and New Mexico, and 48th on the KIDS COUNT education domain. Its effort (2.85 percent, 34th) is below average but not bottom-tier, so it misses my cut. It shouldn’t take comfort in that.
Alabama has at least half its students in chronically underfunded districts and a wide gap between its high- and low-poverty districts: high-poverty districts sit about 48 percent below adequate, low-poverty districts about 7 percent below, a 41-point opportunity gap. It ranks 42nd on KIDS COUNT and 44th on NAEP Core.
Tennessee is a low-effort, deliberate-choice state (2.31 percent, 45th) whose NAEP Core rank of 17th shows what reform without money can buy, and its limits.
New Mexico and Mississippi are the hard cases. They hold the bottom two spots on KIDS COUNT, and New Mexico is last on every NAEP test (Mississippi, thanks to its literacy push, now sits 28th on NAEP Core). Mississippi has 99 percent of students in below-adequate districts and 80 percent in chronically underfunded ones. But both try: New Mexico ranks 12th on effort (3.54 percent) and Mississippi 20th (3.30 percent). These are can’t states, not won’t states. Small economies and high child poverty mean even strong effort can’t close the gap alone. That’s an argument for federal foundation aid targeted at high-effort, low-capacity states, not for putting them on a shame list.
Note: Alaska and West Virginia also sit near the bottom on NAEP and KIDS COUNT. SFID doesn’t estimate adequacy for Alaska, whose geography drives costs the national model can’t capture.
These are choices
The usual response to lists like this is that some states are just poorer, more rural, or harder to serve. For New Mexico and Mississippi, that’s partly true. For Nevada, Texas, North Carolina, Florida and Arizona, it isn’t. These states have the capacity. They’ve chosen tax cuts, revenue limits and, increasingly, private school subsidies over adequately funding the public schools most of their children attend.
We know what works. Money matters, and it matters most for the kids these states shortchange. The fix starts with three things:
- Raise effort. Getting even to the national average of 3.13 percent of GSP would mean billions in new revenue in each of these states.
- Target it. Drive state aid to high-poverty districts based on rigorously estimated costs, and strip out flat grants and minimum-aid guarantees that send money where it isn’t needed.
- Tie federal aid to effort. Supplemental federal foundation aid should flow to high-need districts in states that pay their fair share, which would reward New Mexico and Mississippi and give the bottom five a reason to try.
Until then, children in these five states will keep paying for their legislators’ priorities.
Sources and data notes
- Baker, Di Carlo & Weber (Feb. 2026), The Adequacy and Fairness of State School Finance Systems, 8th ed. — effort, NECM adequacy and opportunity gaps, 2022-23. Adequacy not estimated for Alaska, Hawaii or Vermont. See also the report summary.
- Annie E. Casey Foundation, 2026 KIDS COUNT Data Book, via Becker’s full ranking and Oklahoma Policy Institute (domain ranks).
- Tyner (Feb. 2026), The Fall to 48th, Oklahoma Center for Education Policy — pooled NAEP Core ranks, 2024.
- USAFacts, Nevada NAEP math proficiency; Arizona Republic on Arizona’s 2024 NAEP; Rio Grande Foundation on New Mexico’s 2024 NAEP.
- Human Rights Watch, How Do US States Measure Up on Child Rights? (last updated Sept. 2023).


