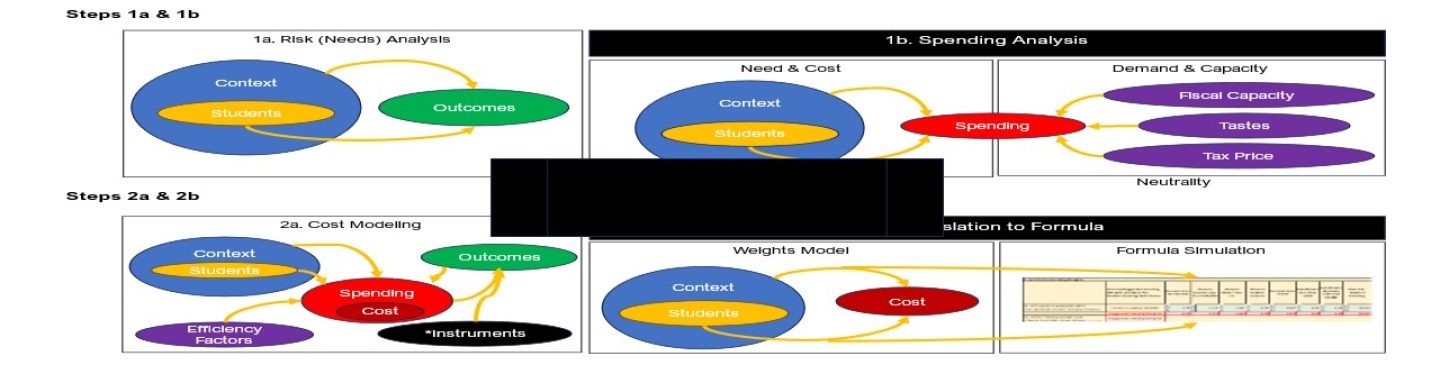
Building out tables & graphics for public sharing on Education Rights and Enforcement in U.S. States (Claude assisted)
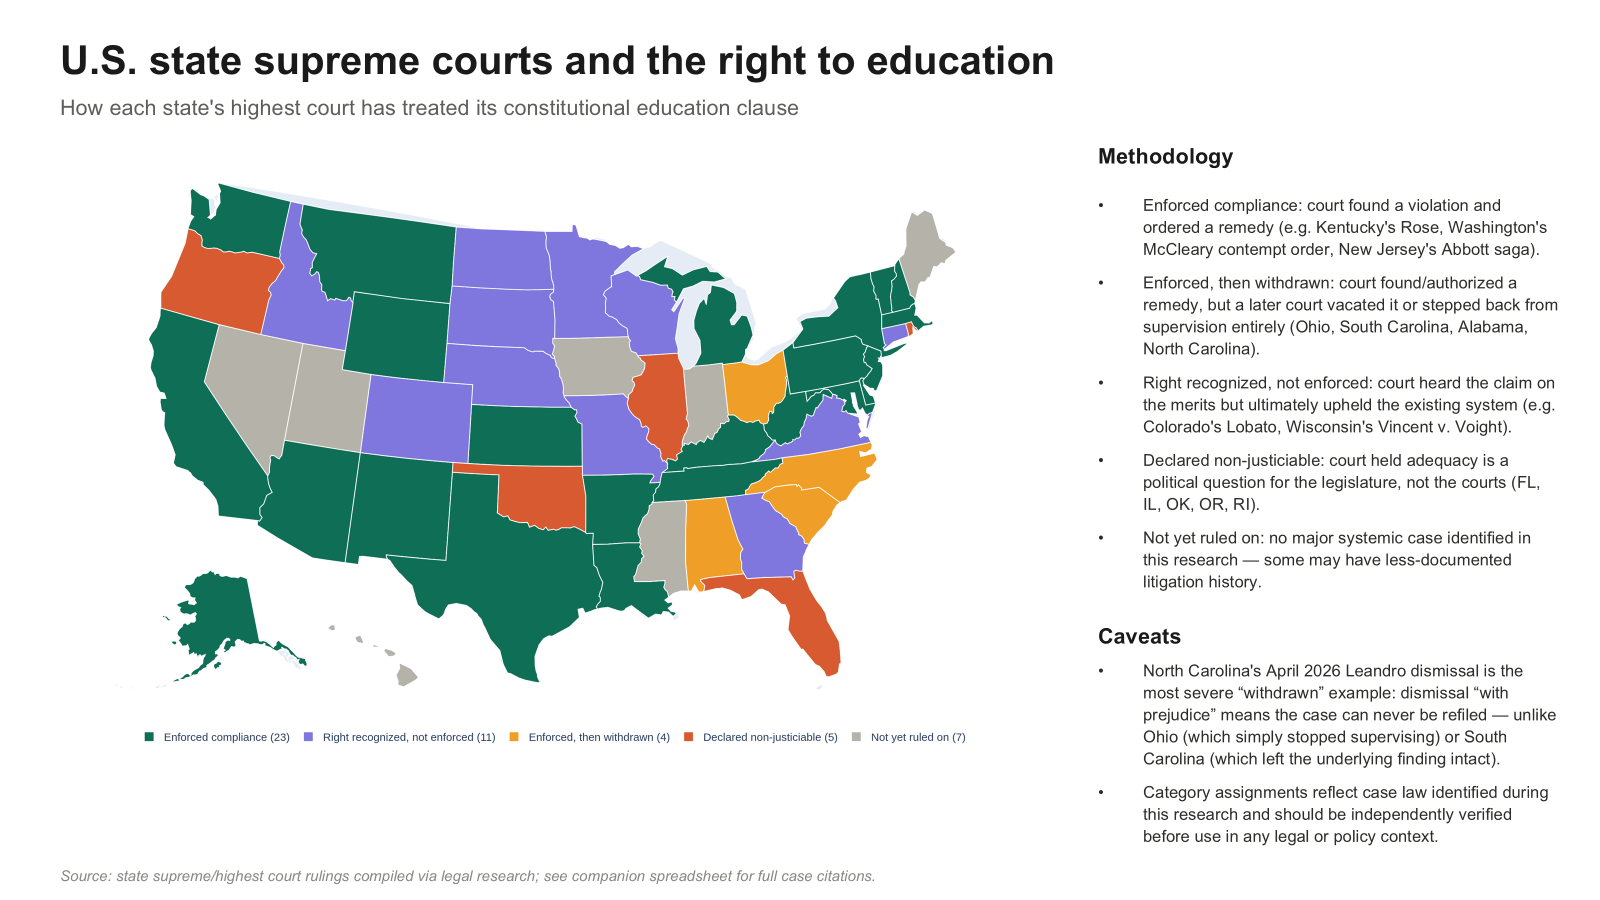
National
In progress: Global Education Rights project tied to Global Education Adequacy Estimates Project. More coming!
State-Specific Information
A few items are still being finalized and will go live shortly.
Connecticut
- Policy Brief: Connecticut EEO Policy Brief
- Slide Deck: Reforming School Finance in Connecticut
- Interactive Widget: CT School District Outcomes vs. Funding Adequacy — download (.zip)
- Critique Brief: On Marguerite Roza’s Deceitful Presentation in Connecticut (PDF)
- Blog Post: Same Junk, New Audience: Marguerite Roza’s Deceitful Presentation to Connecticut’s Blue-Ribbon Commission
Florida
- Policy Brief: FL School Funding Policy Brief
- Slide Deck: FL School Funding Slide Deck
- Interactive Widget: FL District Outcomes — National vs. Massachusetts Comparison — download (.zip)
- Interactive Widget (Map): First Coast Redlining & Adequacy: Duval & St. Johns (1937 HOLC, NECM gaps, 2024–25 schools) — download (.zip)
New York State Small City School Districts
- Policy Brief: NYSCS Foundation Aid Policy Brief
- Slide Deck: NYSCS Foundation Aid Deck
- Slide Deck (Fall 2026): NYSCS Fall 2026 [link pending]
- Interactive Widget: Small City Cost Model — Spending vs. Outcome Standards — download (.zip)
Kansas & Missouri
- Policy Brief: School Finance in Kansas & Missouri: Funding Adequacy, Student Outcomes, and What Fifteen Years of Data Mean for Policy
- Slide Deck: School Finance in Kansas & Missouri — Funding Adequacy, Student Outcomes & Trends, 2009–2024
- Interactive Widget: Kansas & Missouri District Outcomes vs. Funding Adequacy — download (.zip)
- Interactive Widget (Toggle): Kansas School Finance Toggle Widget — download (.zip)
New Jersey
- Slide Deck: NJ Education Rights Briefing Deck
Minnesota
- Policy Brief: Minnesota’s Equal Educational Opportunity Problem
- Slide Deck: Minnesota School Finance: Progressive on Paper, Short in Practice (PDF)
Texas
Digging Out: Restoring Equal Educational Opportunity in Texas (November 2026). Texas ranked 6th of 49 states in school funding effort in 1993 and 35th in 2024. Its highest-poverty districts now spend about half of what national-average outcomes cost, 46th of 48 states, and 98% of Texas students attend districts spending below that cost. Appendix A re-runs the analyses of the 2012 school finance trial expert report through 2025; the inequities documented then remain, and several are larger. Stata replication packages reproduce every figure.
- Policy Brief: Digging Out: Restoring Equal Educational Opportunity in Texas, with Appendix A: The 2012 Expert Report Revisited (PDF)
- Slide Deck: Digging Out: Texas School Finance (PDF)
- Interactive Widget: Texas District Funding Gaps vs. Outcome Gaps, 2009–2024 — download (.zip)
- Blog Post: A Letter to Governor Hinojosa: Fixing Texas School Finance
International
Mexico
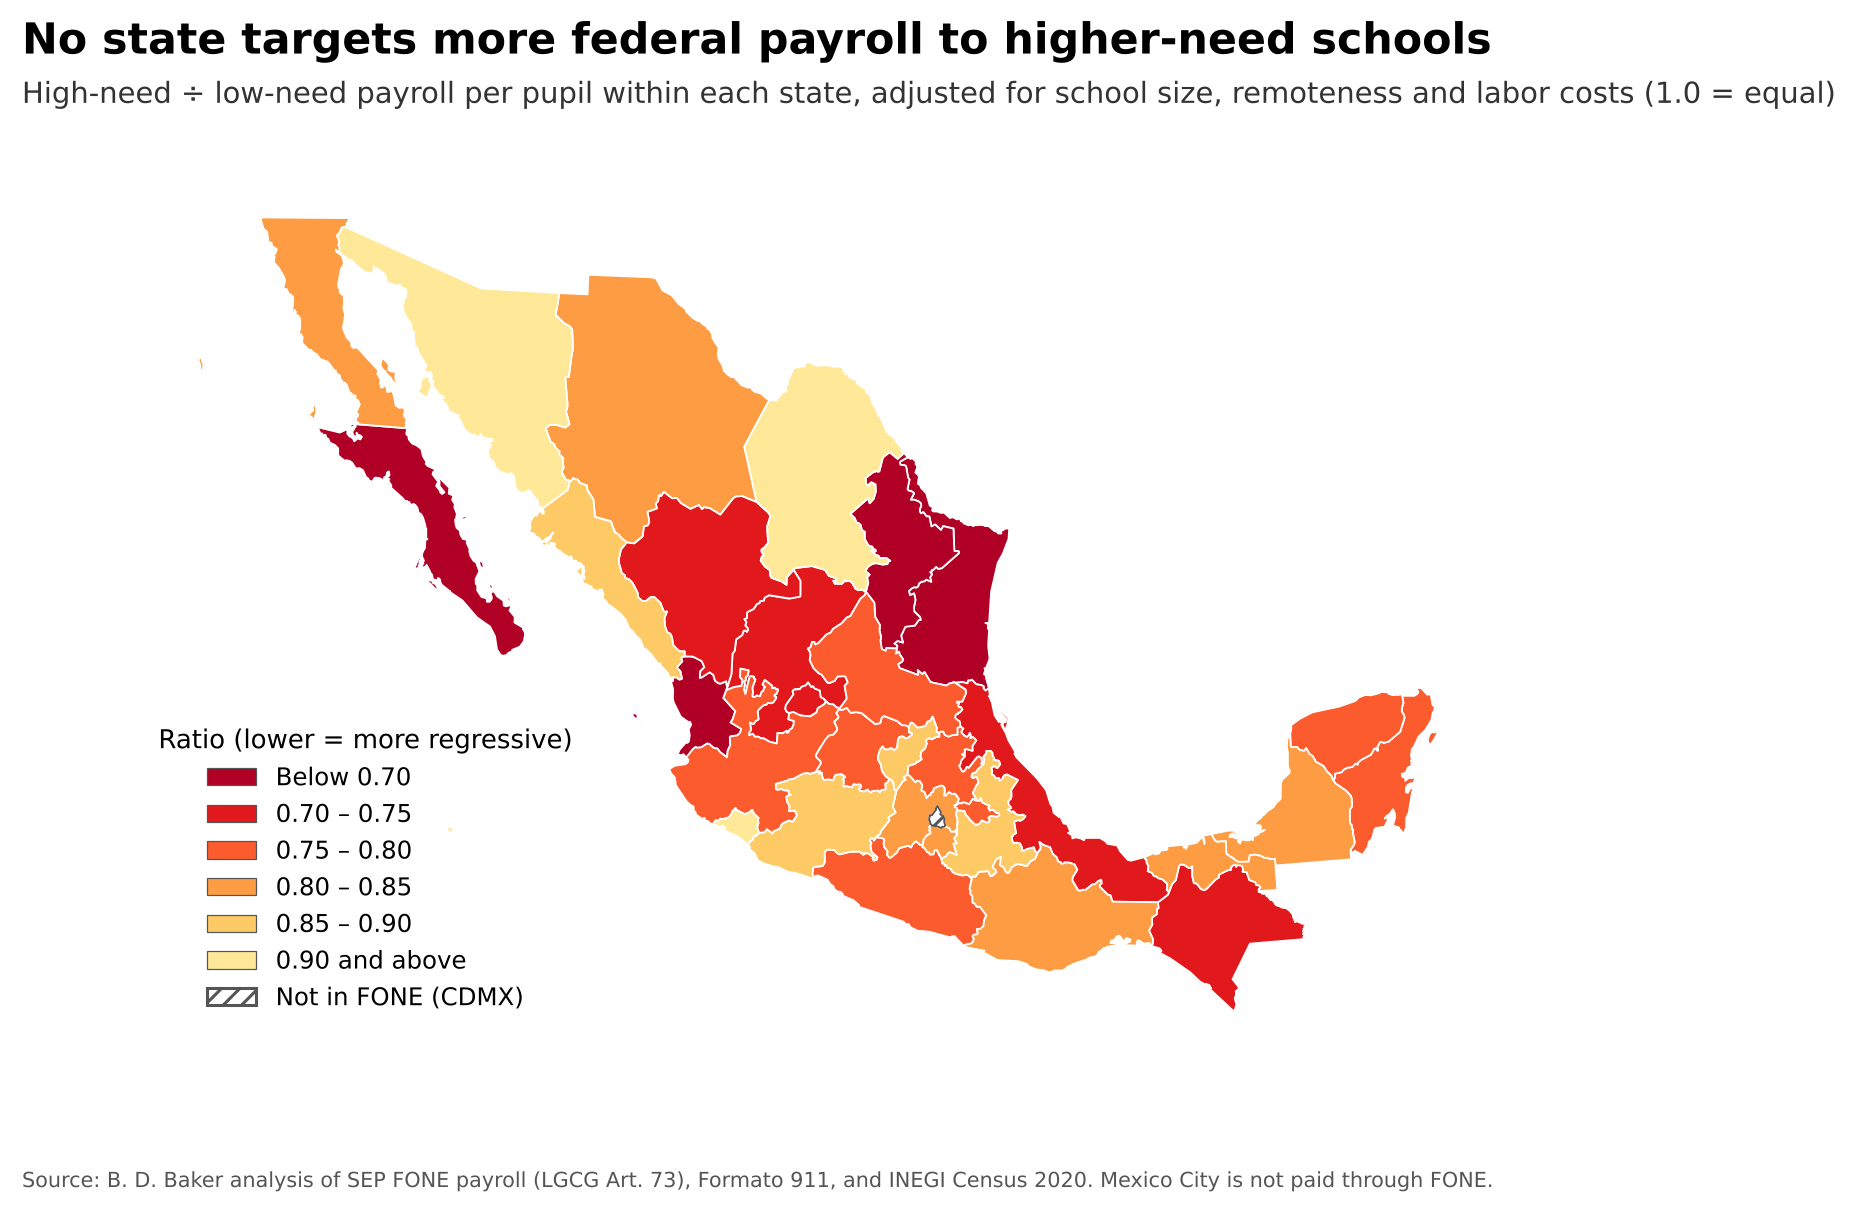
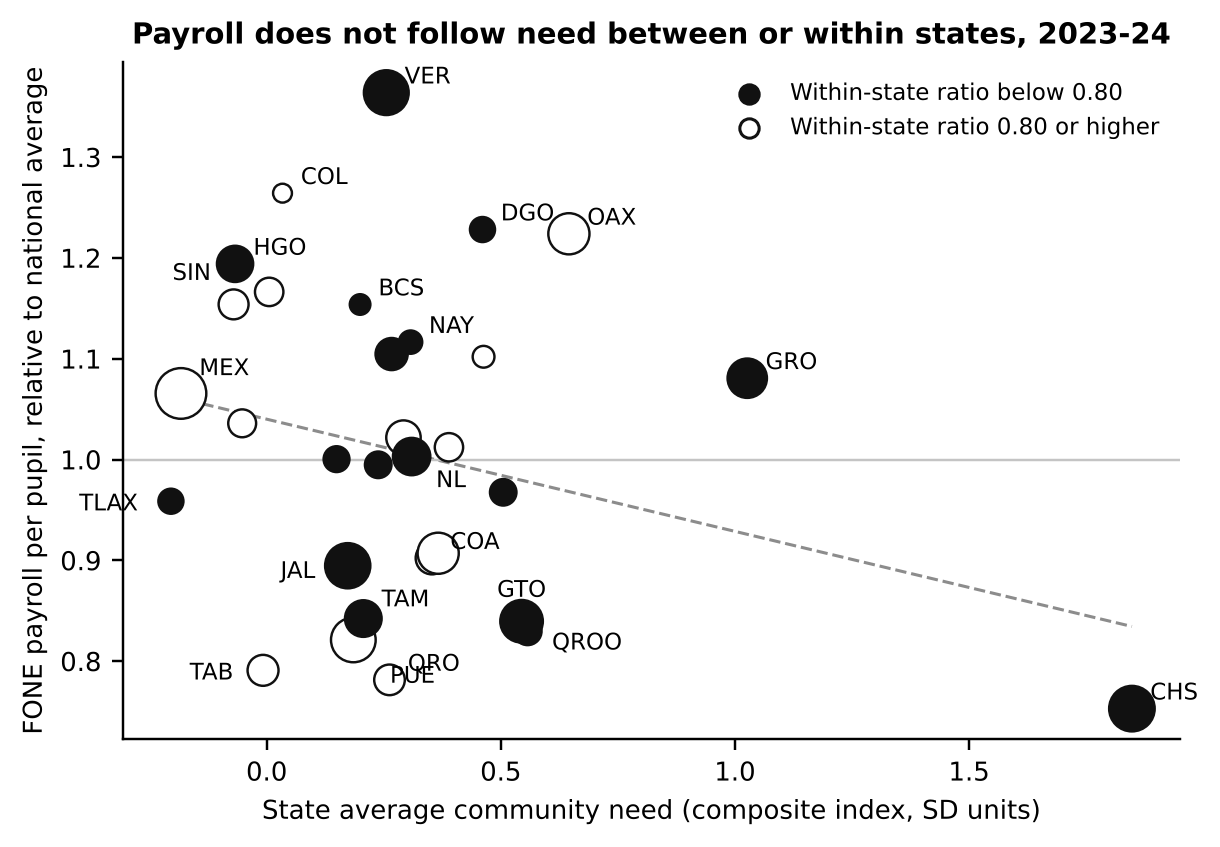
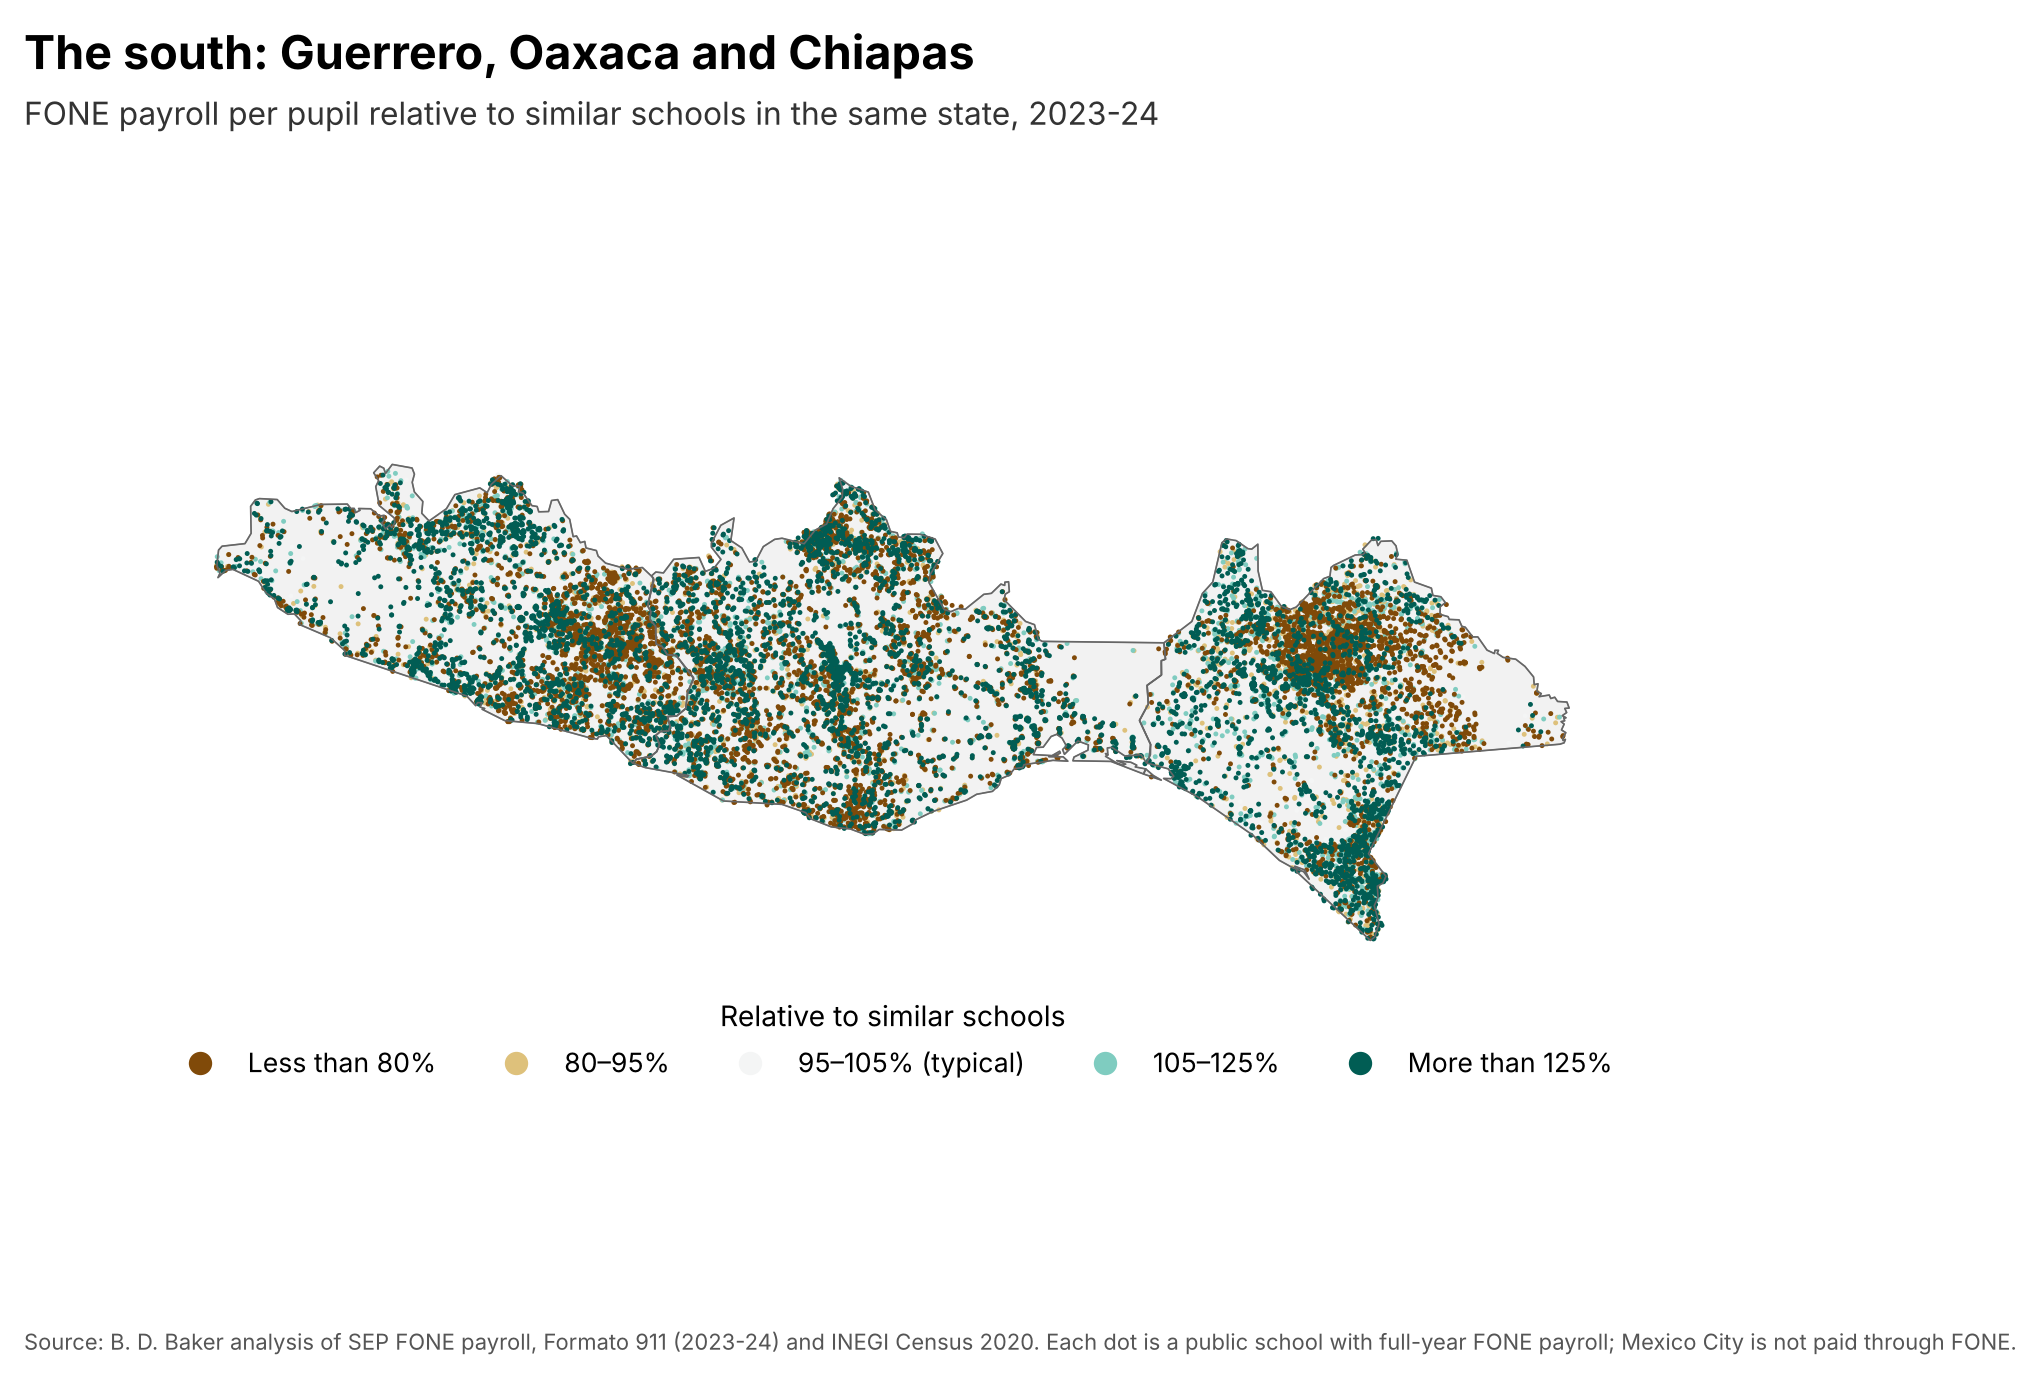
Risk and Spending in Mexican Public Basic Education (October 2026). Applies the risk and spending analysis steps of the equal educational opportunity framework to more than 113,000 public preschools, primarias and secundarias, linking federal FONE payroll by school to the Formato 911 census, PLANEA results and 2020 Census community measures. Federal school payroll is regressive: comparing similar schools within the same state, schools in the highest-need communities receive about three-quarters (0.77) of the payroll per pupil of schools in low-need communities. No state is progressive once school size and remoteness are accounted for, and the highest-need state, Chiapas, has the lowest payroll per pupil in the country.
- Executive Summary: School Funding Equity in Mexico (PDF)
- Technical Report: Risk and Spending in Mexican Public Basic Education (PDF)
- Slide Deck: School Funding Equity in Mexico (PDF)
Brazil
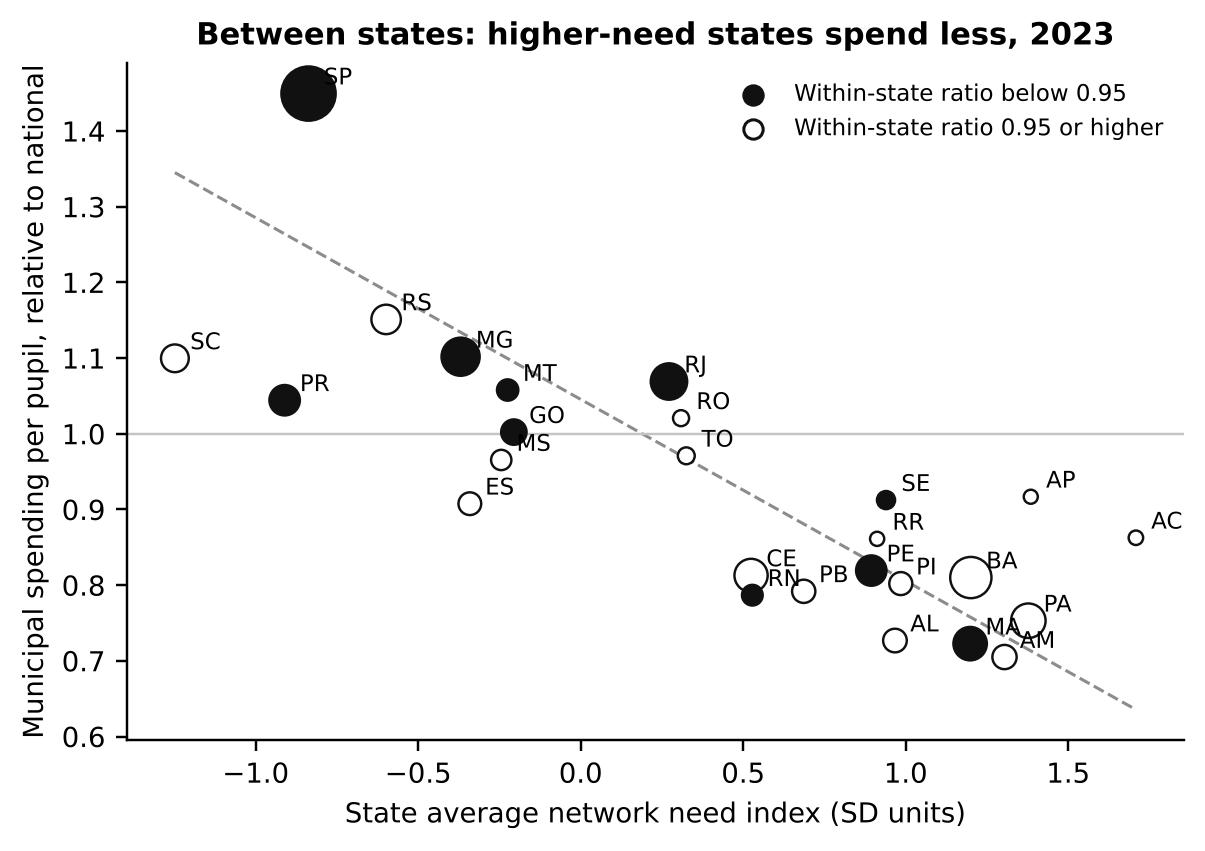
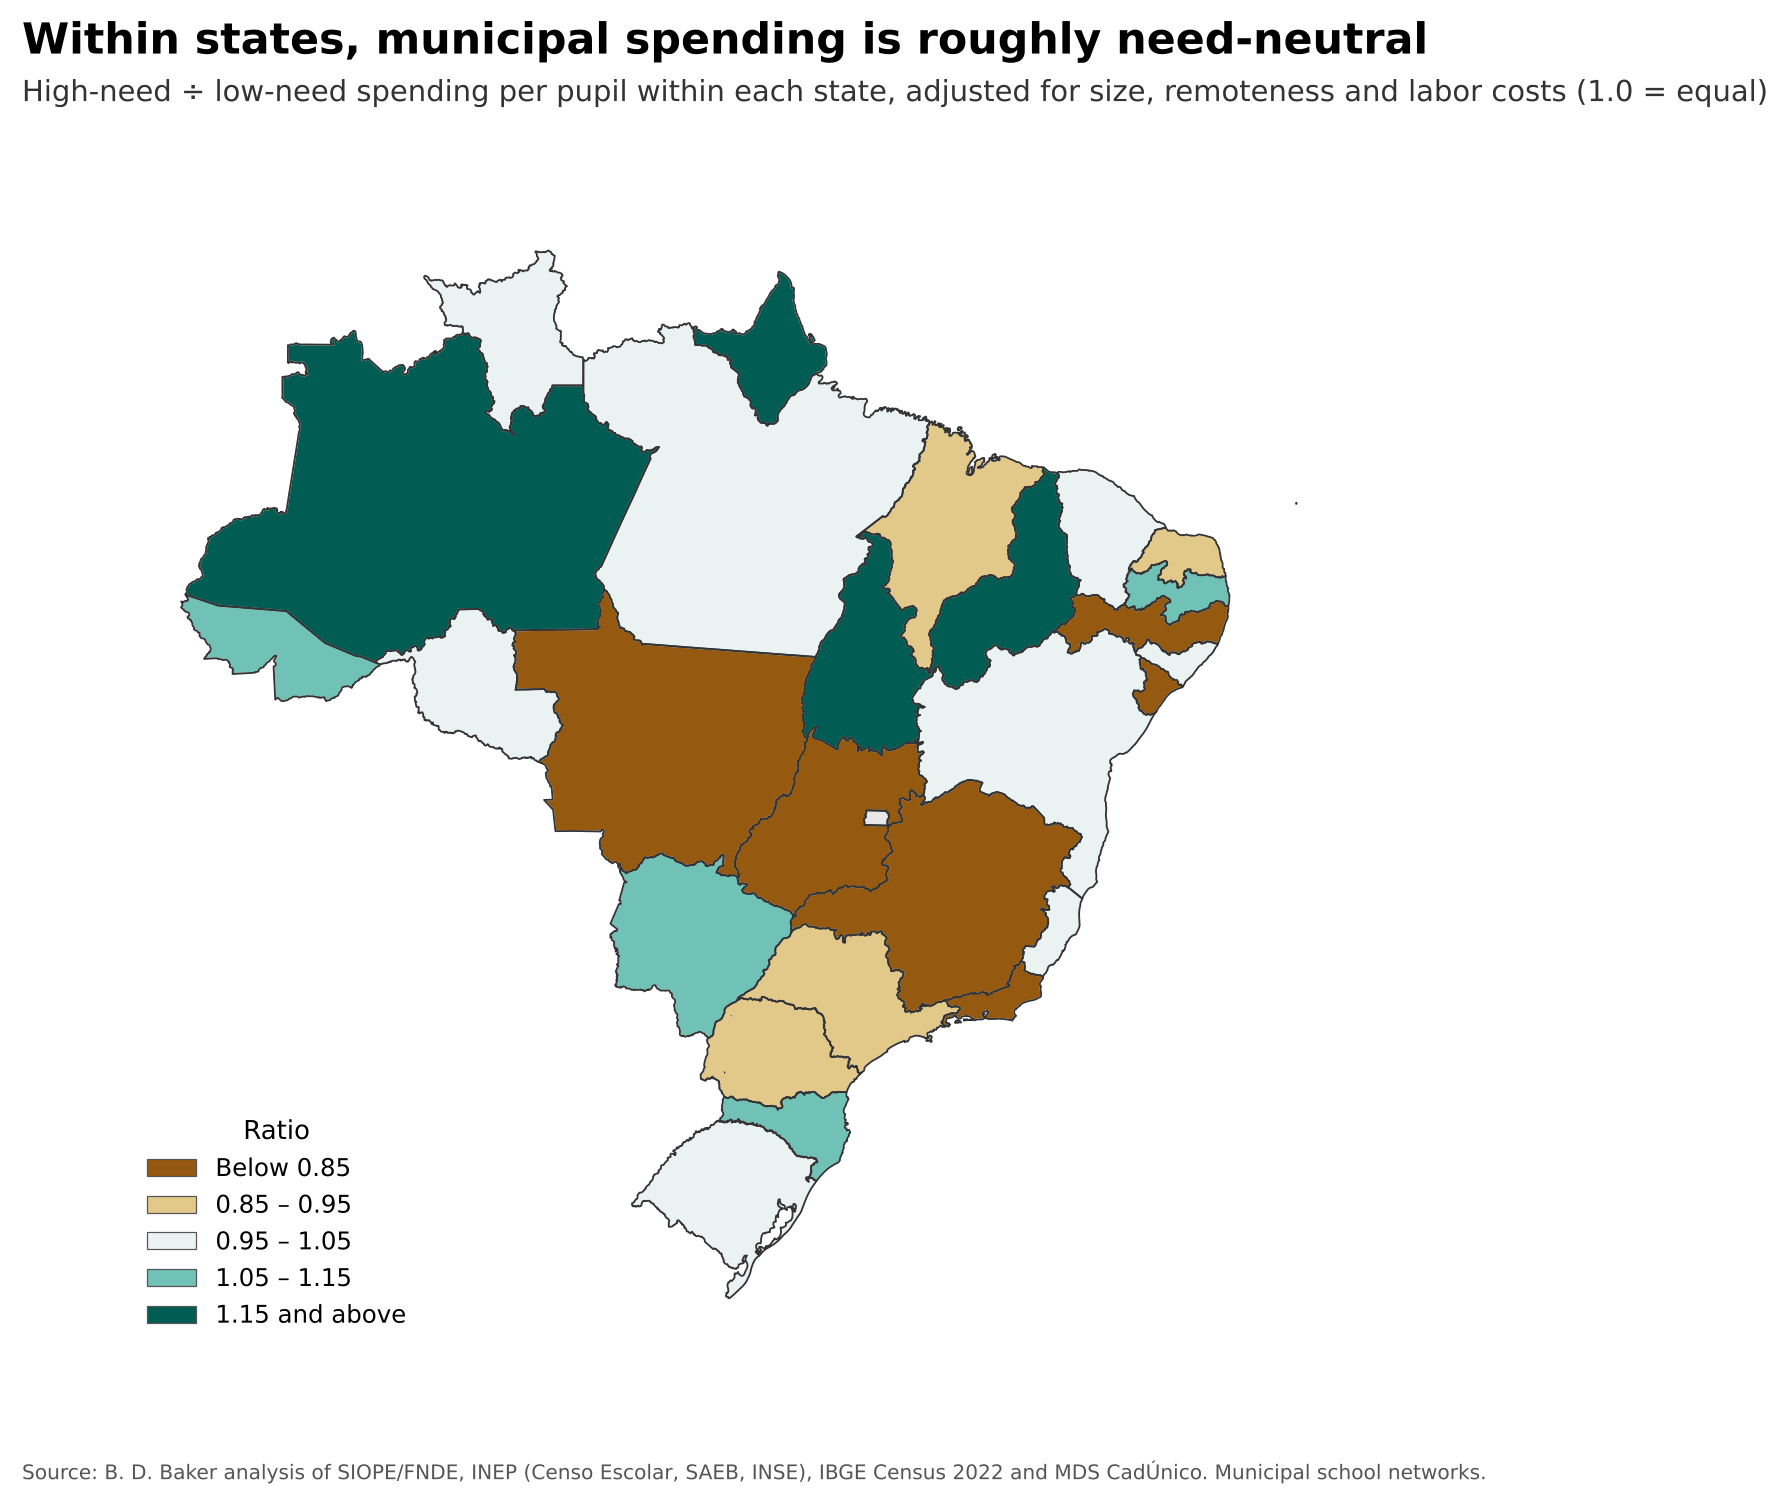
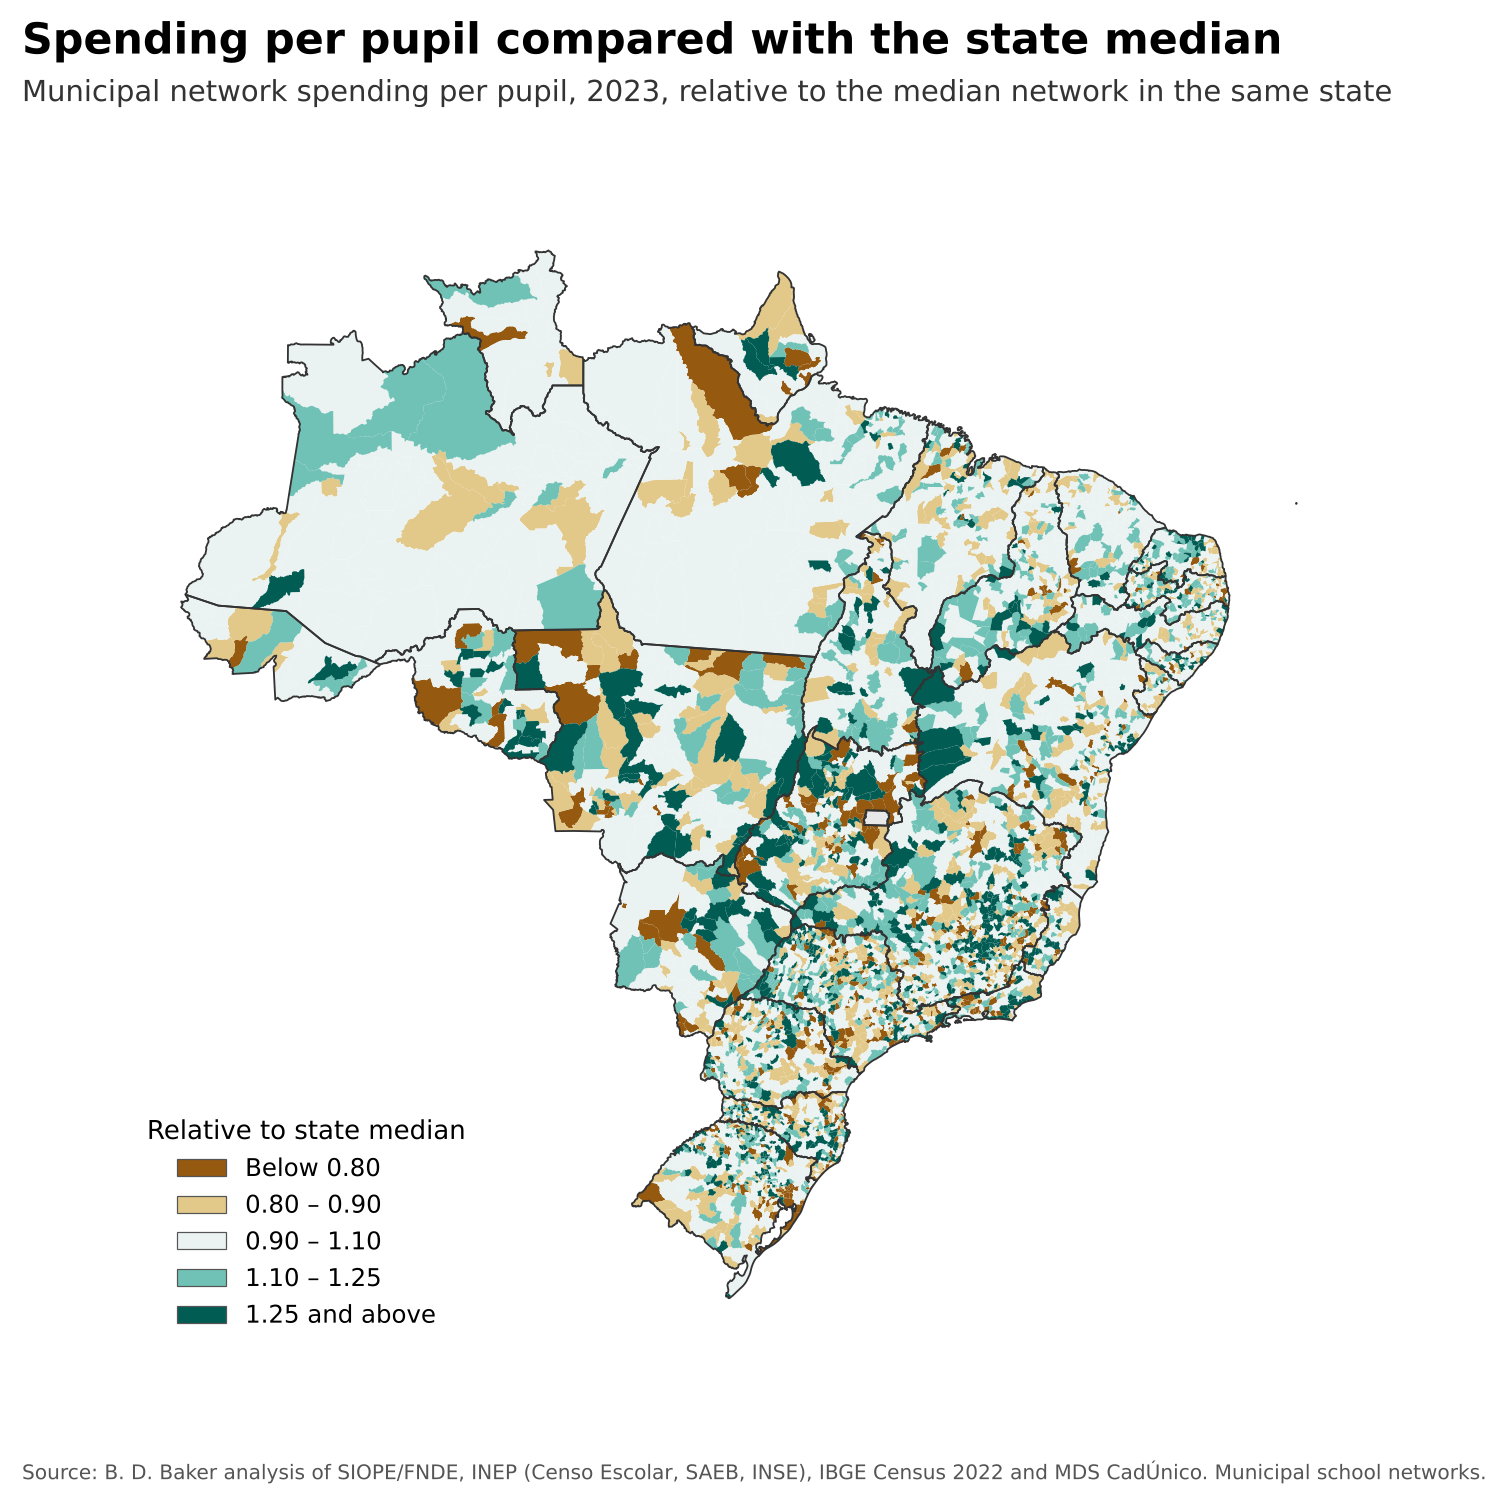
Risk and Spending in Brazilian Municipal School Networks (October 2026). Applies the risk and spending analysis steps of the equal educational opportunity framework to Brazil’s 5,560 municipal school networks, linking SAEB results, INEP’s school socioeconomic index, the Censo Escolar, the 2022 Census and Cadastro Único poverty data with SIOPE spending for 2019–2023. Nationally, municipal spending is sharply regressive: high-need networks spend about two-thirds (0.65) as much per pupil as low-need networks. Most of the gap lies between states, where need and spending correlate at −0.78. Within states, where FUNDEB pools revenue, spending is roughly need-neutral (0.96) and tracks local revenue; the 2021 FUNDEB reform moved within-state distributions toward neutrality.
- Executive Summary: School Funding Equity in Brazil (PDF)
- Technical Report: Risk and Spending in Brazilian Municipal School Networks (PDF)
- Slide Deck: School Funding Equity in Brazil (PDF)
France
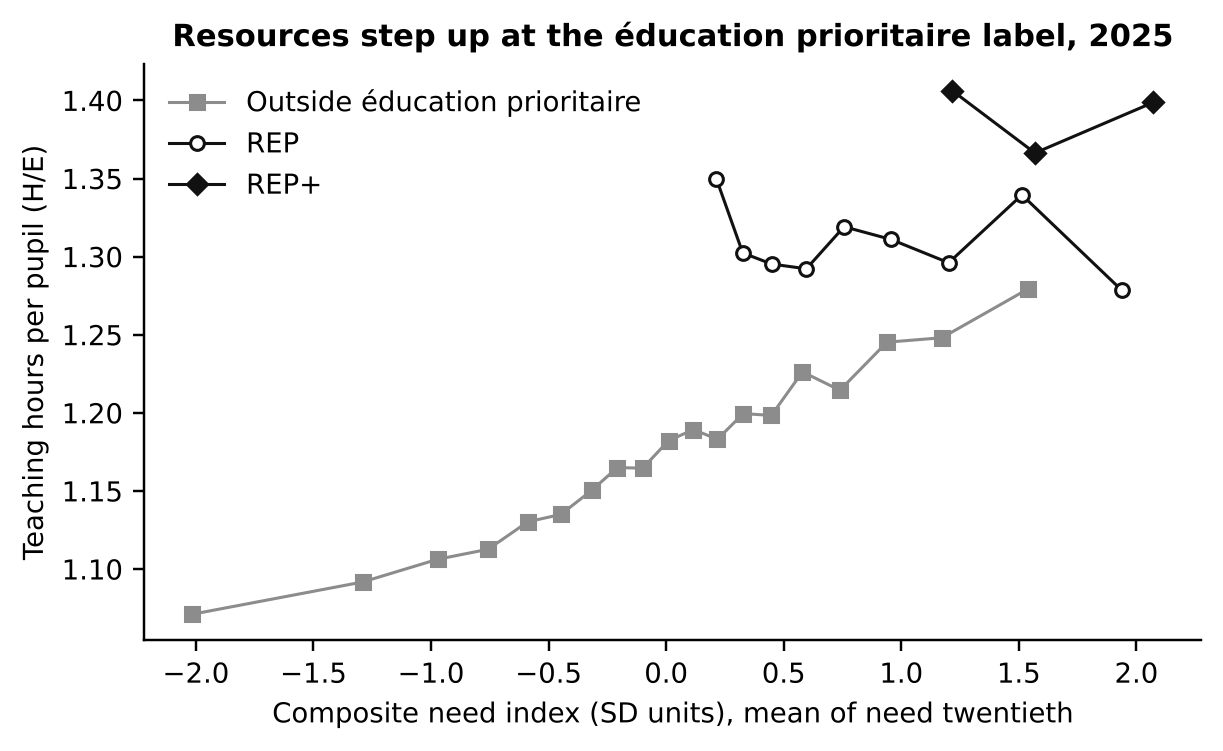
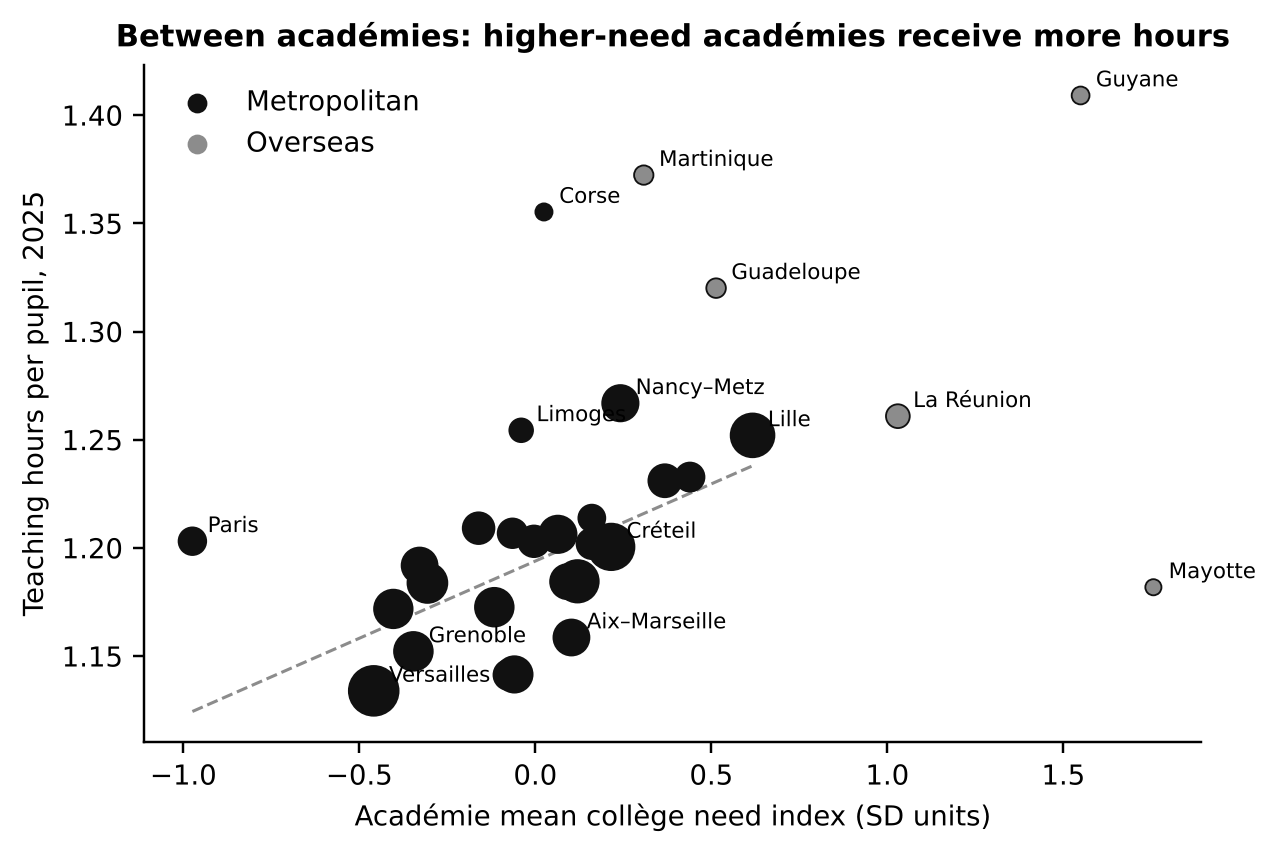
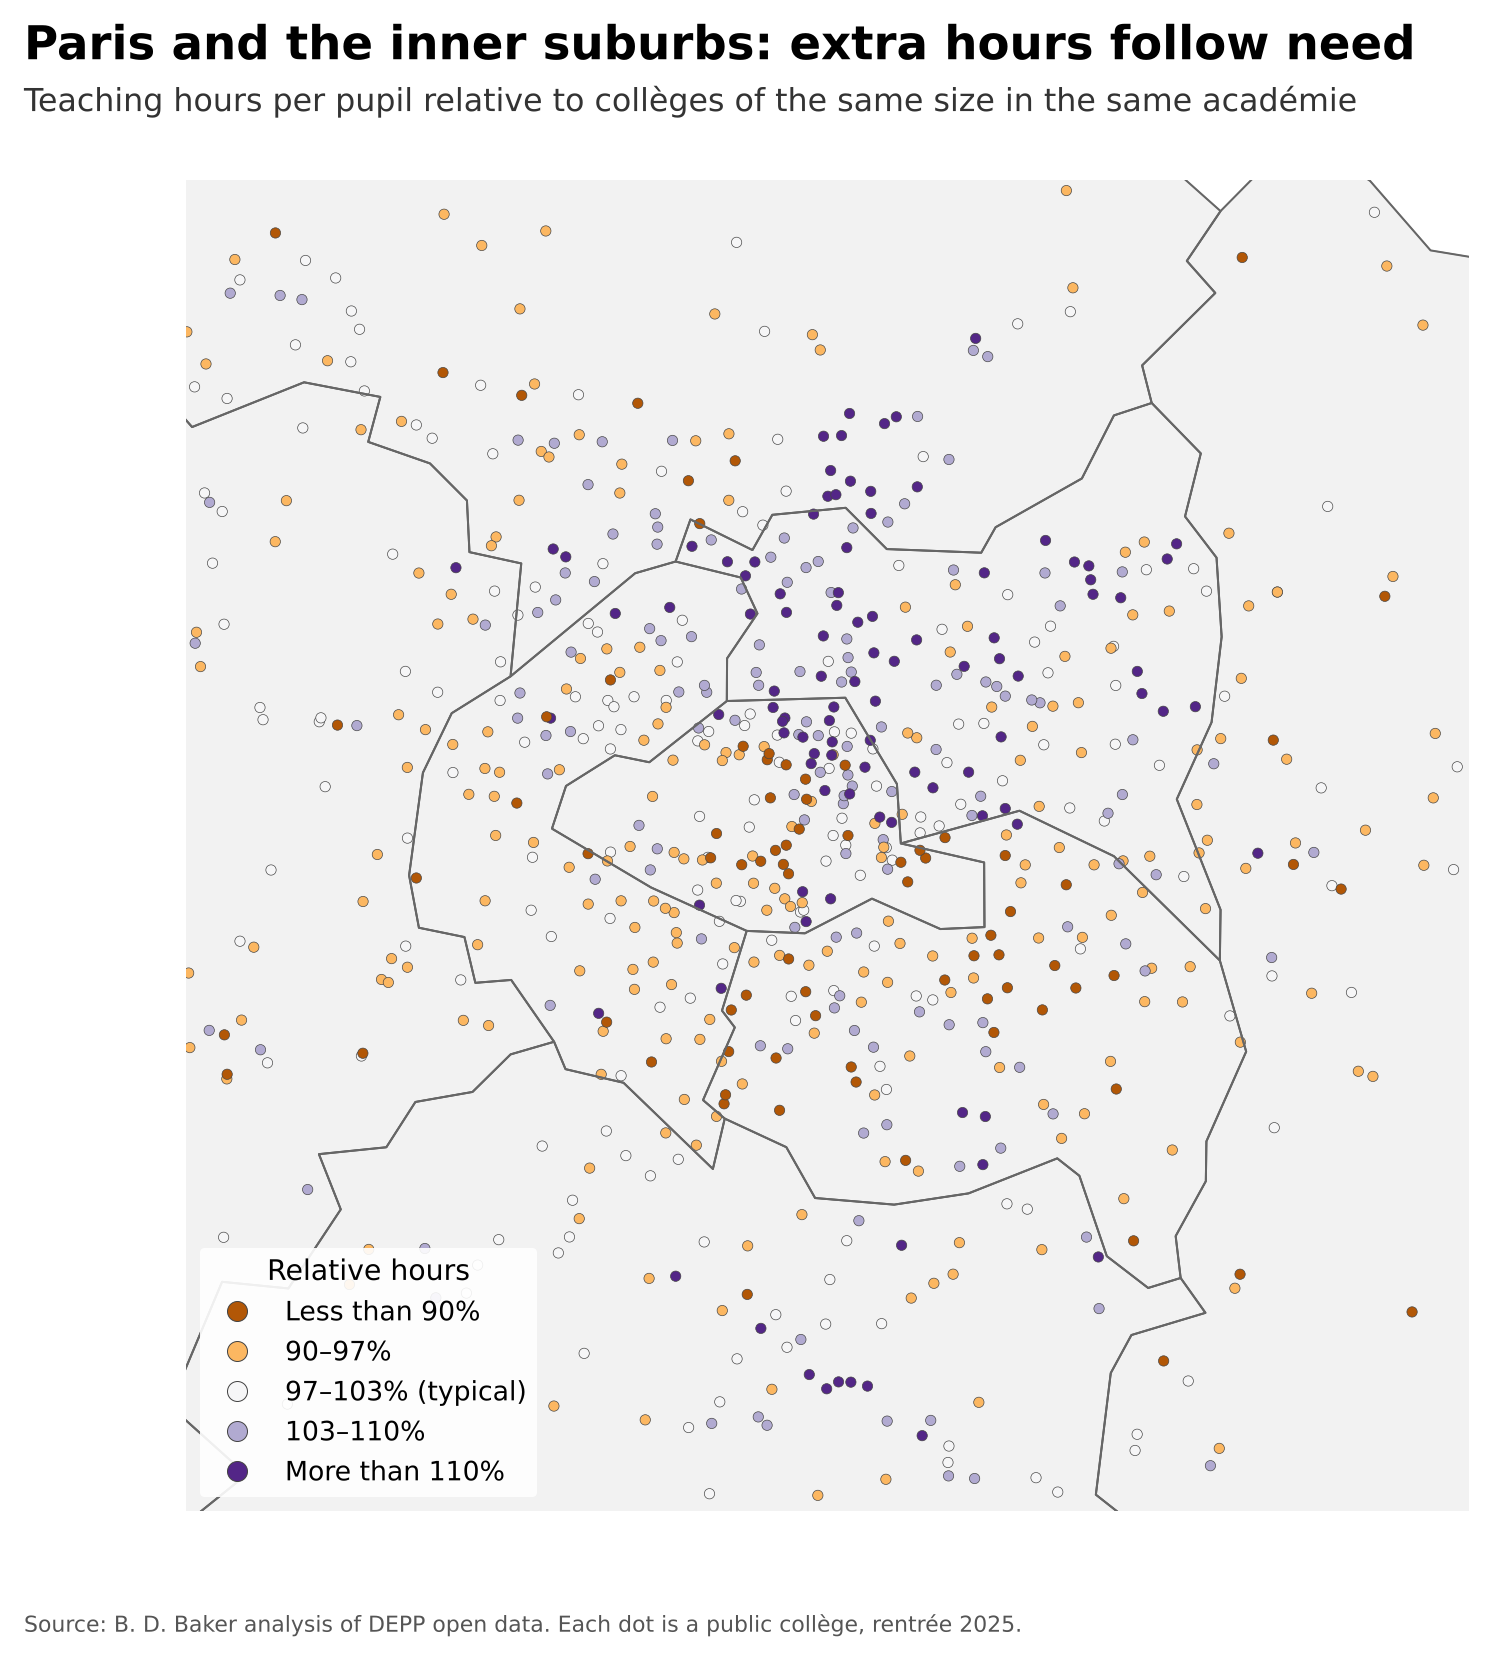
Risk and Resources in French Public Collèges (October 2026). Applies the risk and resource analysis steps of the framework to about 5,300 public collèges, linking brevet results, grade-6 national tests and the social position index (IPS) of each collège’s intake with the teaching hours per pupil the State allocates to each collège, 2023–2025. Because teachers are paid on national scales and allocated as hours, the State layer is measured in hours rather than euros. Unlike Mexico and Brazil, the State allocation is progressive: within académies, high-need collèges receive about 15% more teaching hours per pupil, mostly as smaller groups. Most of that runs through the 2015 REP/REP+ map, which leaves many disadvantaged collèges outside it. Mayotte, the highest-need académie, receives only average hours, and département spending on collèges is unequal and unrelated to need.
- Executive Summary: School Funding Equity in France (PDF)
- Technical Report: Risk and Resources in French Public Collèges (PDF)
- Slide Deck: School Funding Equity in France (PDF)
South Korea
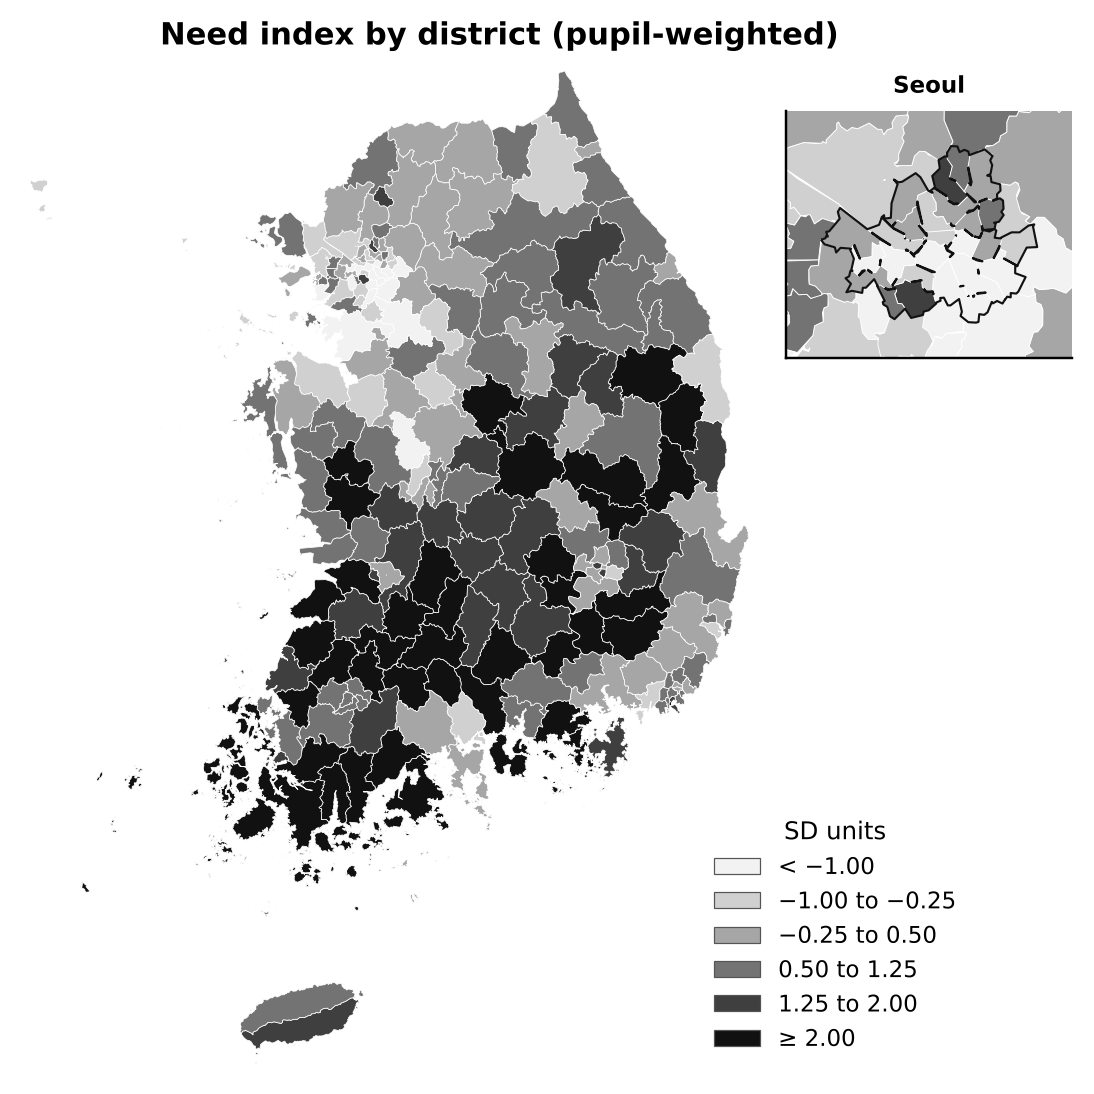
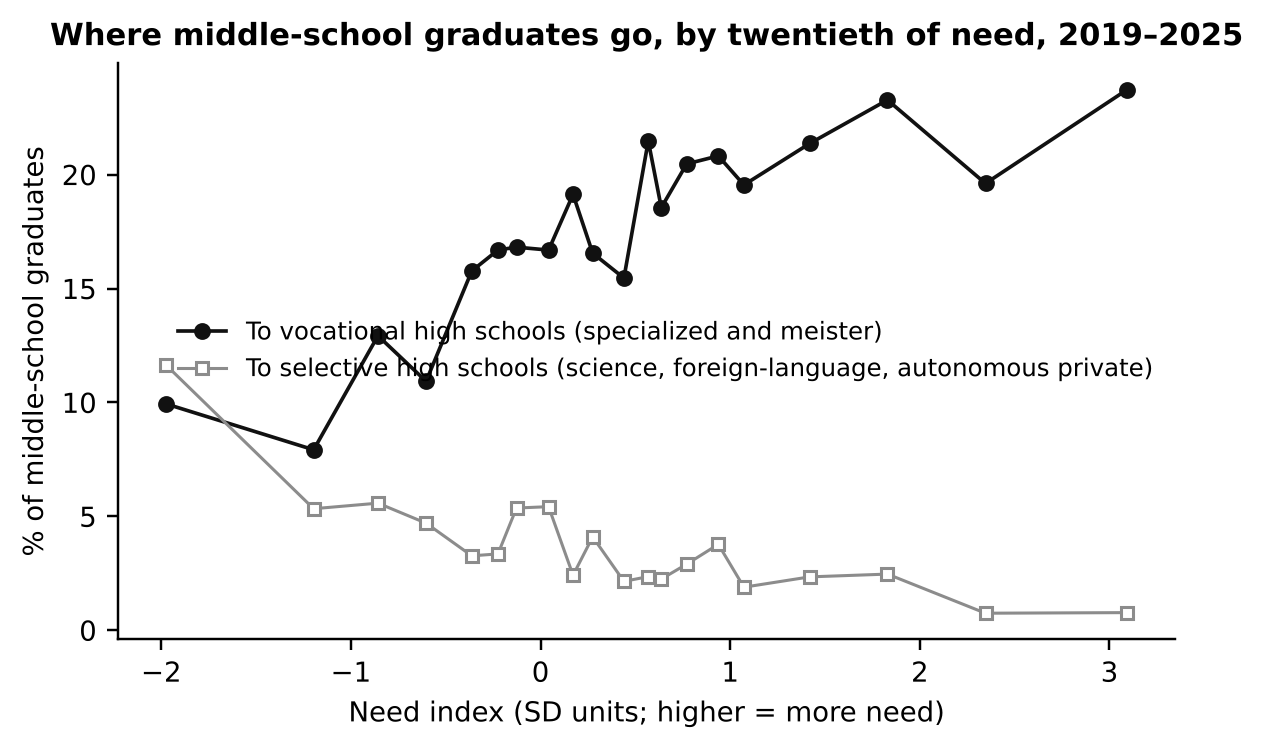
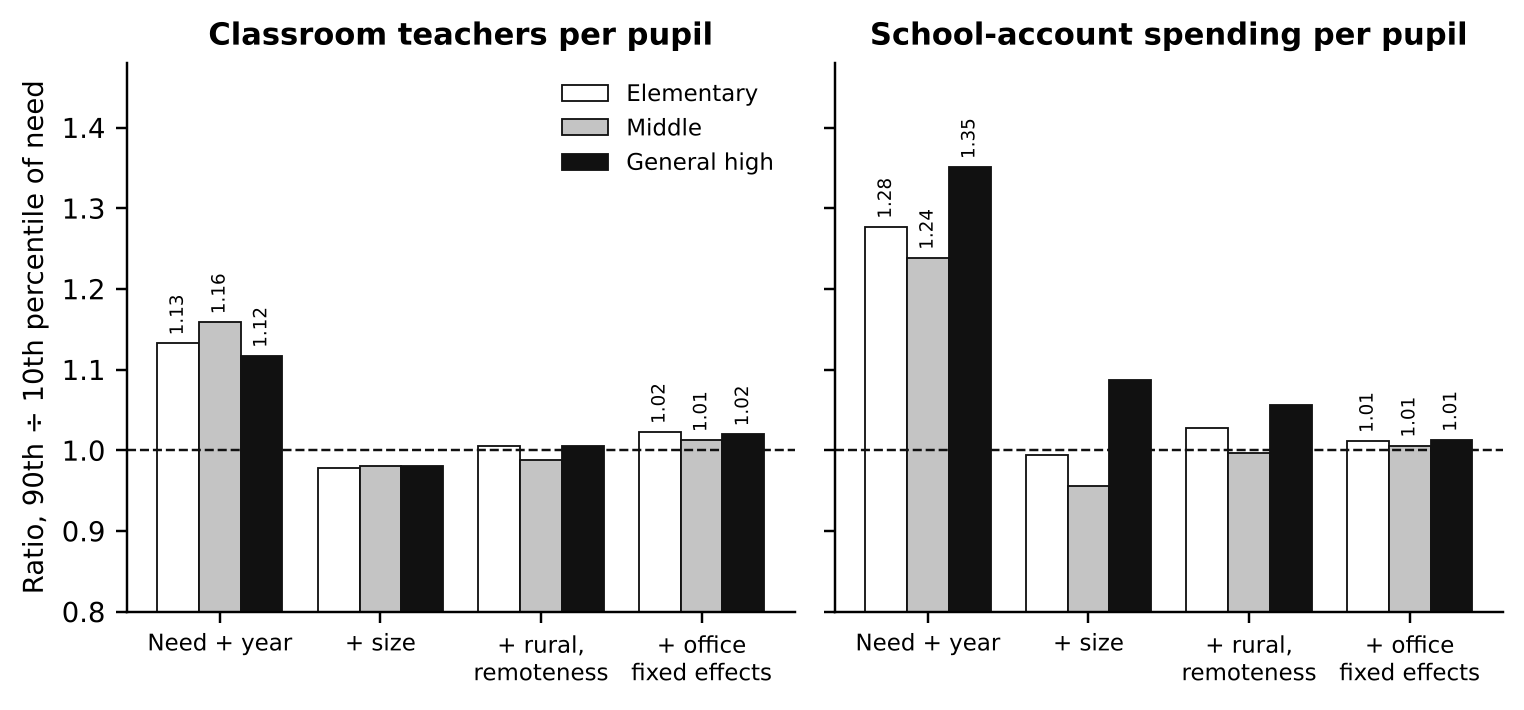
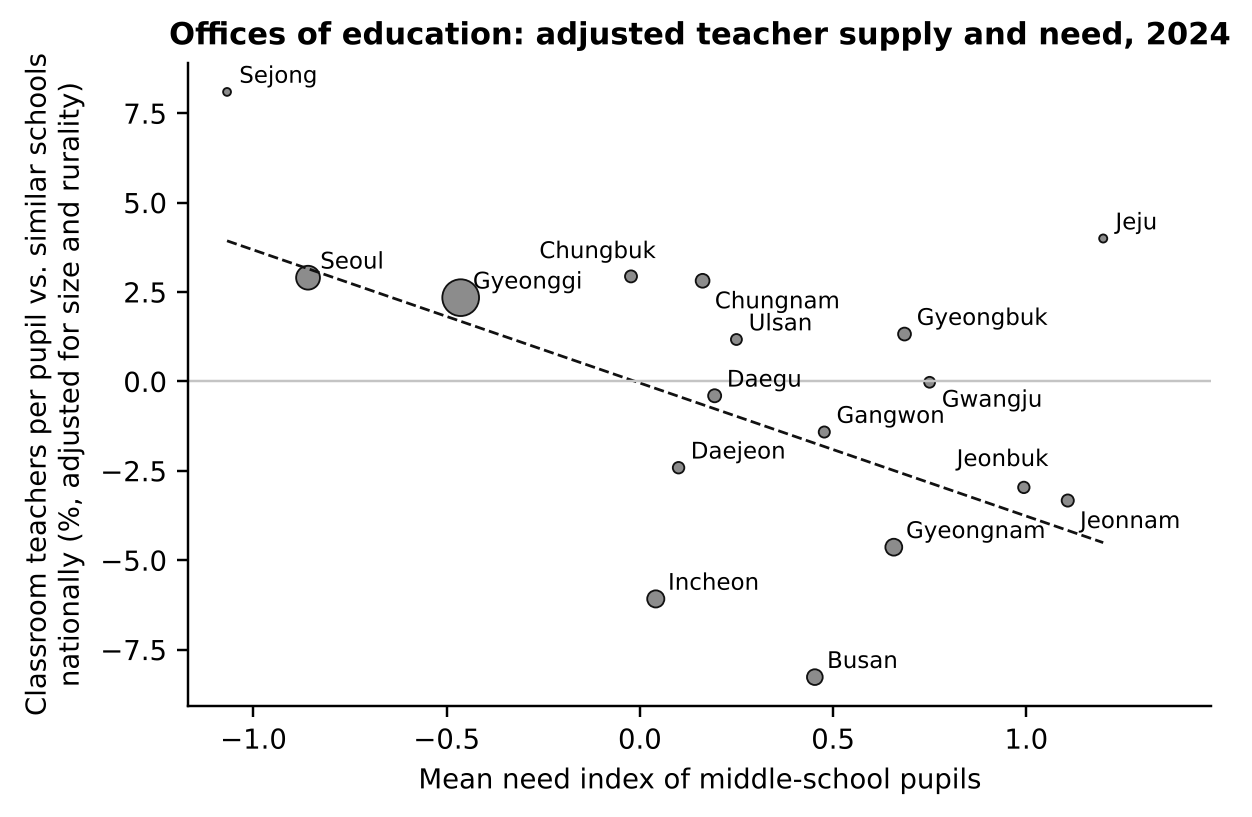
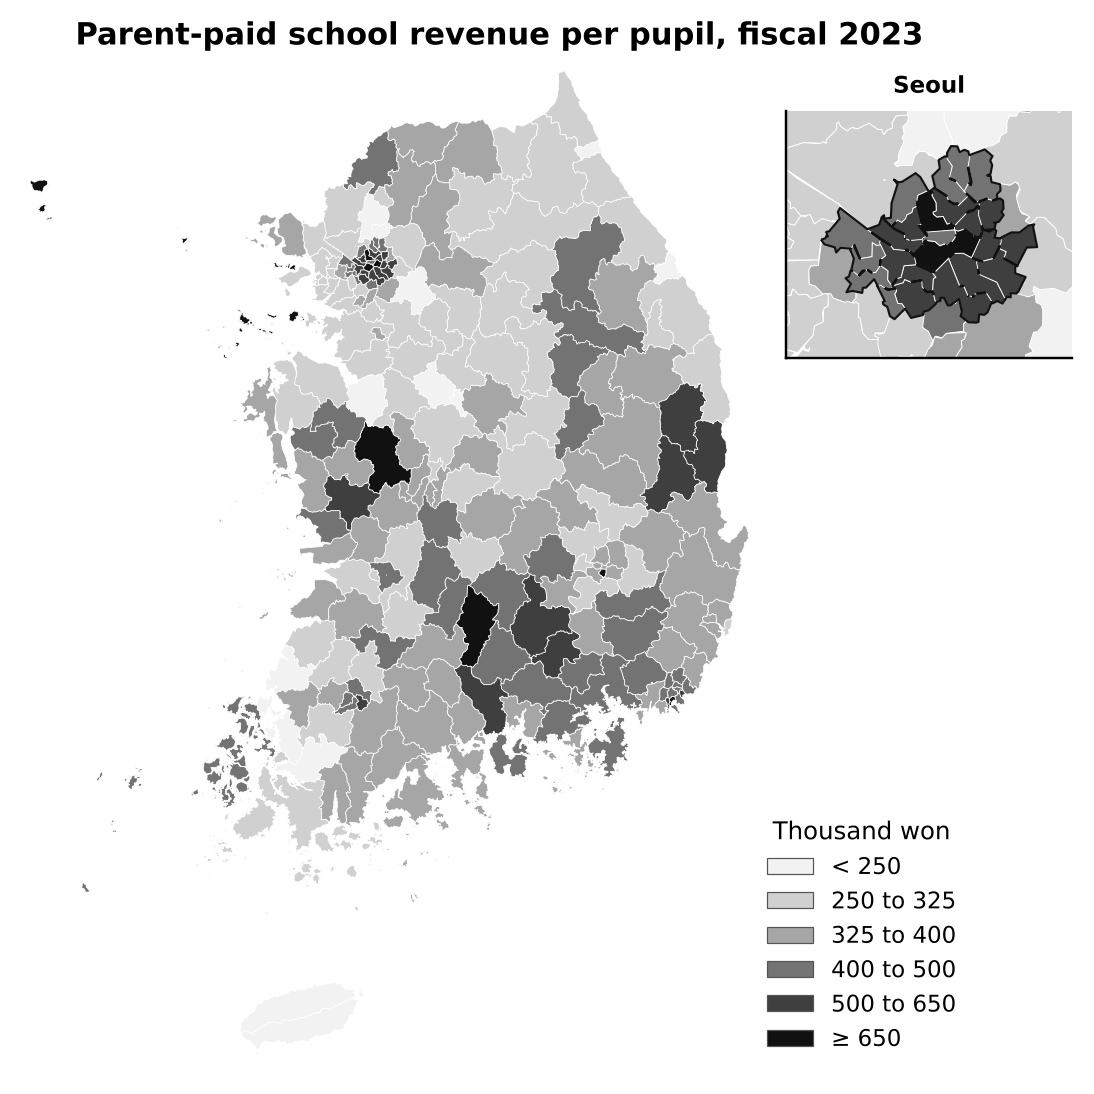
Risk and Resources in Korean Public Schools (October 2026). Applies the risk and spending analysis steps of the framework to about 9,900 public elementary, middle and general high schools enrolling 4.2 million pupils, linking School Info (학교알리미) disclosures of classes, teachers, staff, school accounts and graduates’ destinations for 2019–2025 with district welfare, health-insurance and pension-income data. Korea does not publish achievement by school, so risk is measured by progression: in the highest-need tenth of middle schools, 21% of graduates enter vocational high schools and under 1% selective ones, against 9% and 8% in the lowest-need tenth. Raw comparisons make the system look progressive, because high-need districts have many small rural schools with generous staffing. But comparing schools of similar size and remoteness within the same office of education, classroom teachers and school budgets per pupil are essentially need-neutral (ratios of 1.01–1.02). Parent payments to school accounts rise with district income, and size-adjusted teacher supply leans slightly toward the lowest-need offices, Sejong and Seoul.
- Executive Summary: School Funding Equity in Korea (PDF)
- Technical Report: Risk and Resources in Korean Public Schools (PDF)
- Slide Deck: School Funding Equity in Korea (PDF)
England
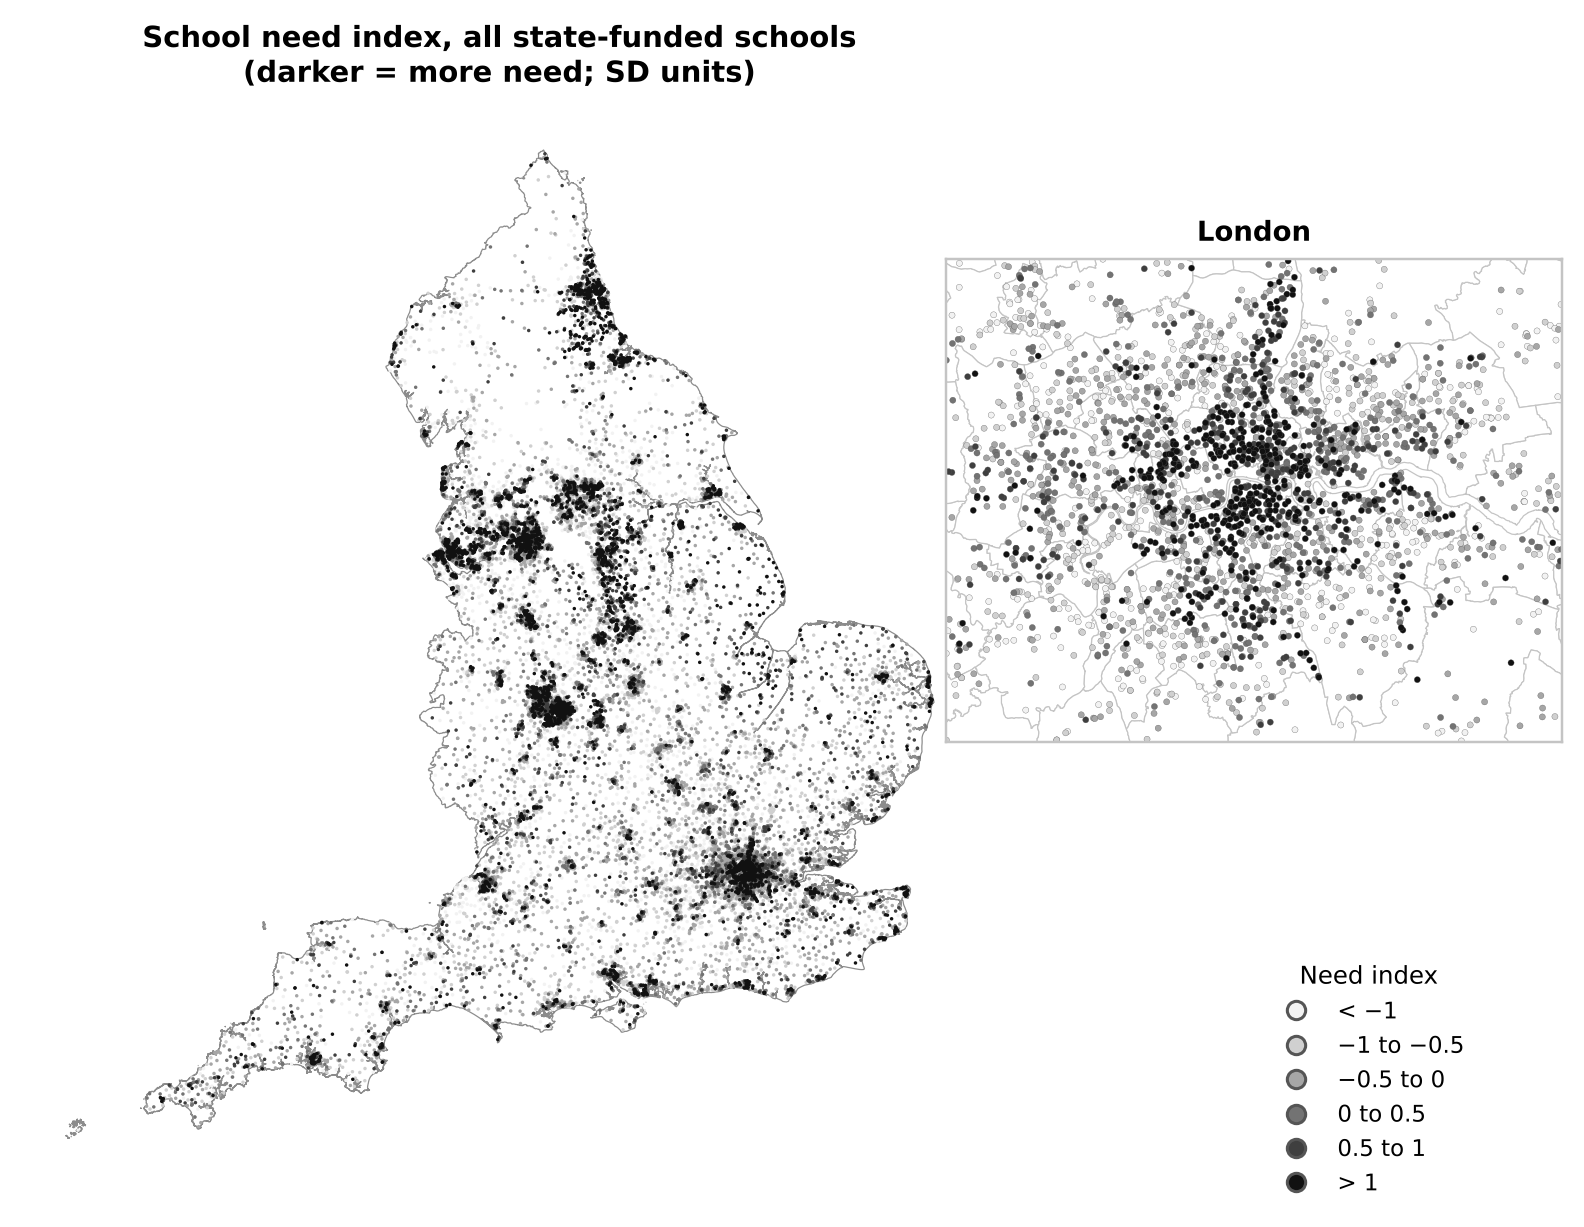
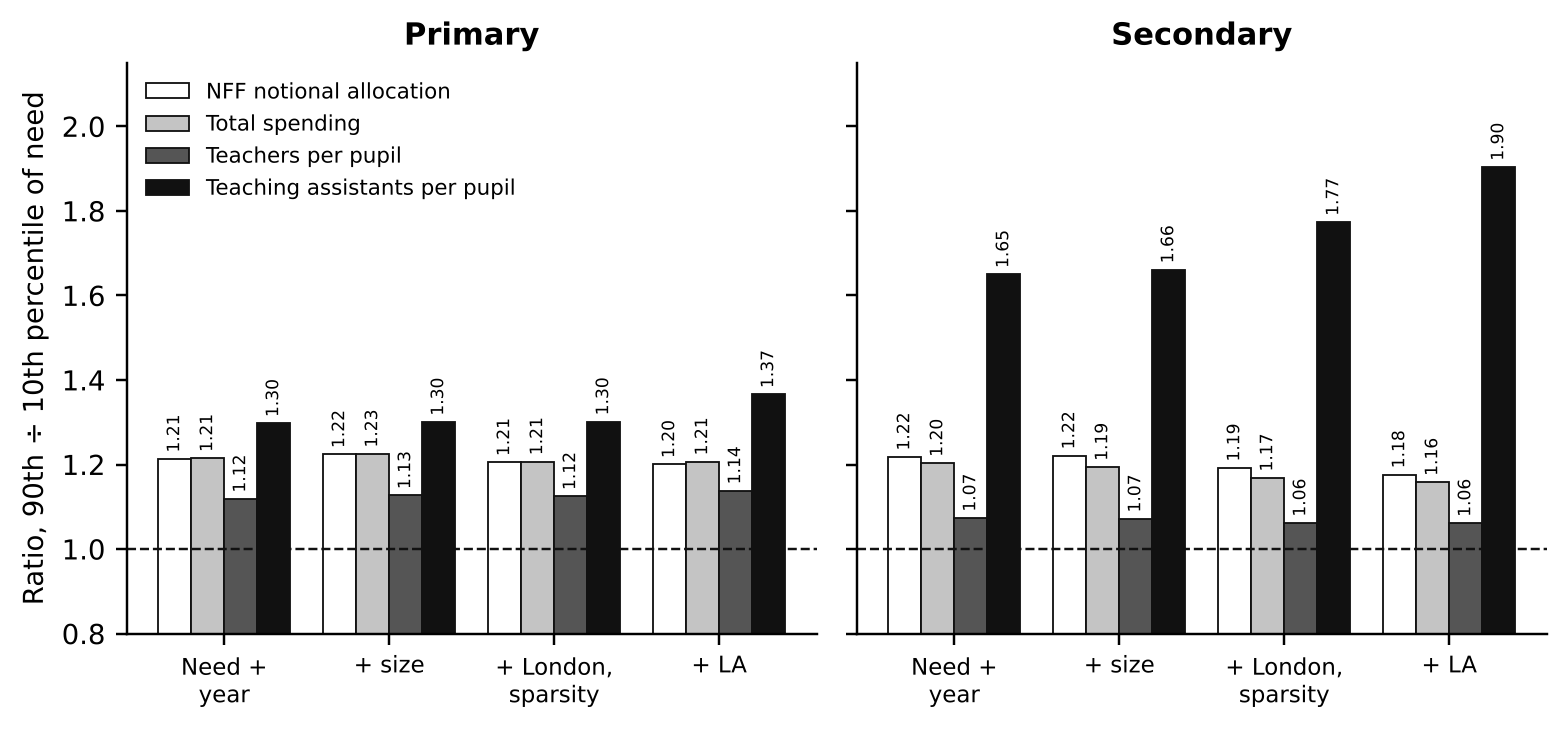
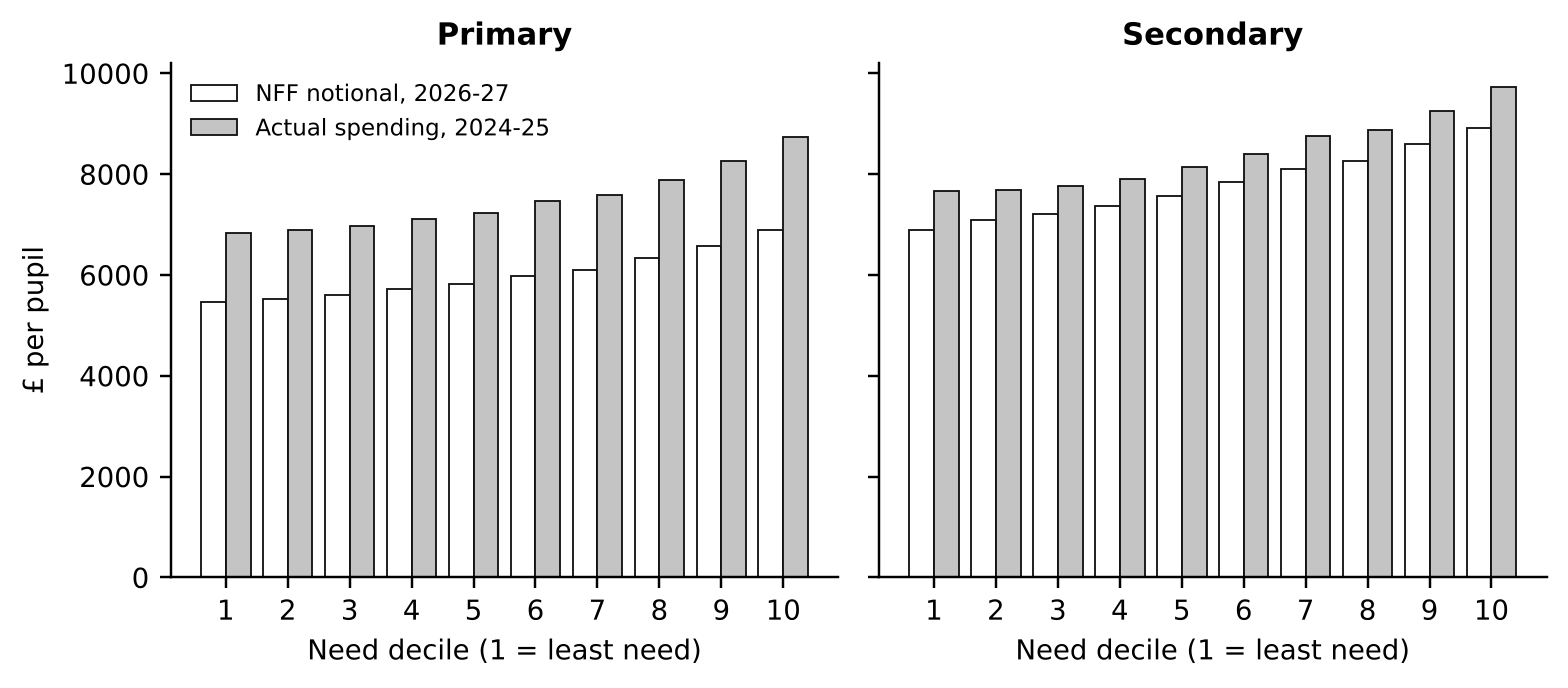
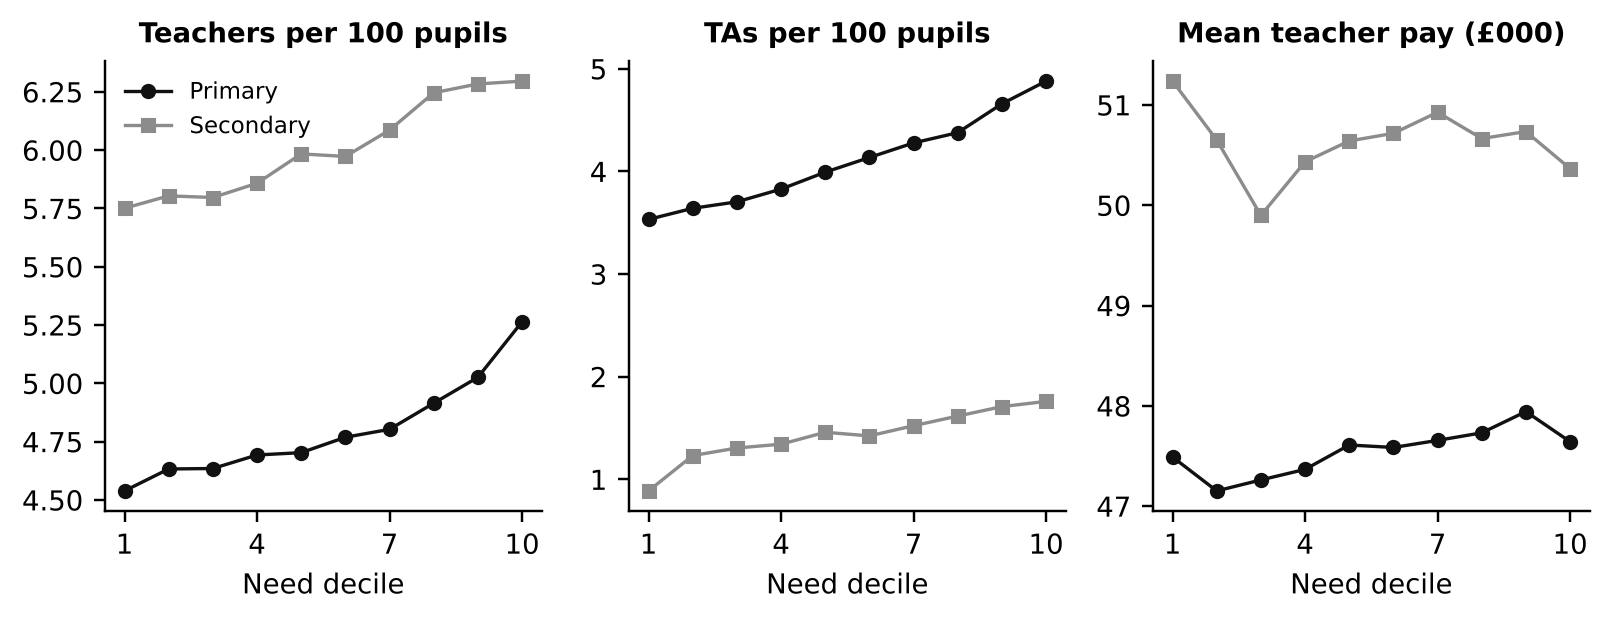
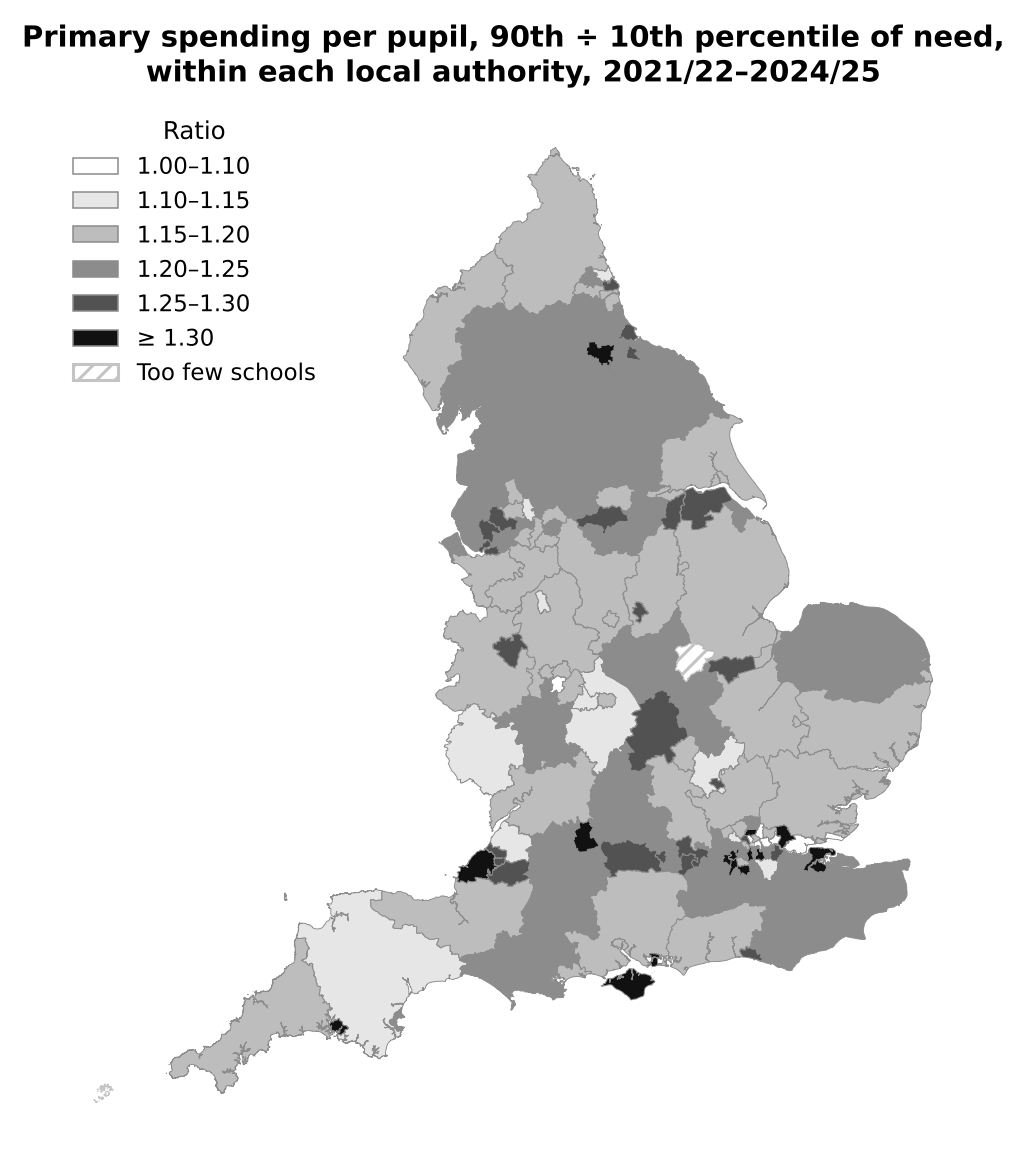
Risk and Resources in English State Schools (October 2026). Applies the risk and resource analysis steps of the framework to about 15,800 primary and 3,350 secondary schools, maintained and academies, linking Key Stage 2 and 4 results and school census data with school-level spending from the Department for Education’s benchmarking tool (2021/22–2024/25), workforce and pay data, and 2026-27 national funding formula allocations. Free school meal eligibility and SEN support are the strongest predictors of results; English as an additional language barely predicts them, though the formula funds it. Comparing schools of similar size and location in the same local authority, high-need schools spend about 21% more per pupil in primary and 16% more in secondary, close to the formula allocation, and every local authority is progressive. But the extra money buys teaching assistants far more than teachers (1.37 and 1.90 against 1.14 and 1.06), and teacher pay does not rise with need. Against outcome gaps of 1.2 to 1.6 standard deviations, a 20% differential is modest. England’s open data meet every requirement for a school-level cost function, making it the strongest candidate so far for Step 2.
- Policy Brief: School Funding Equity in England (PDF)
- Slide Deck: School Funding Equity in England (PDF)
Australia
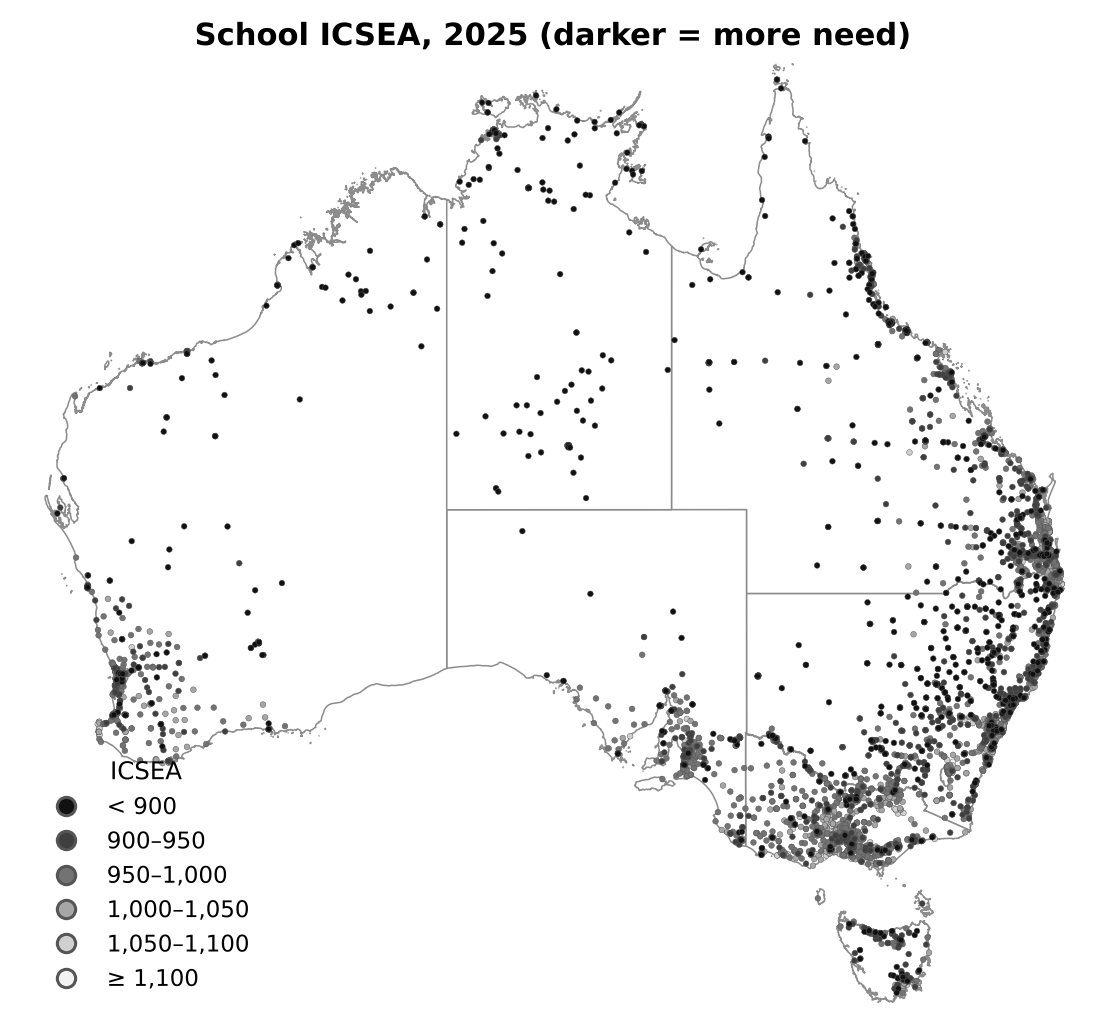
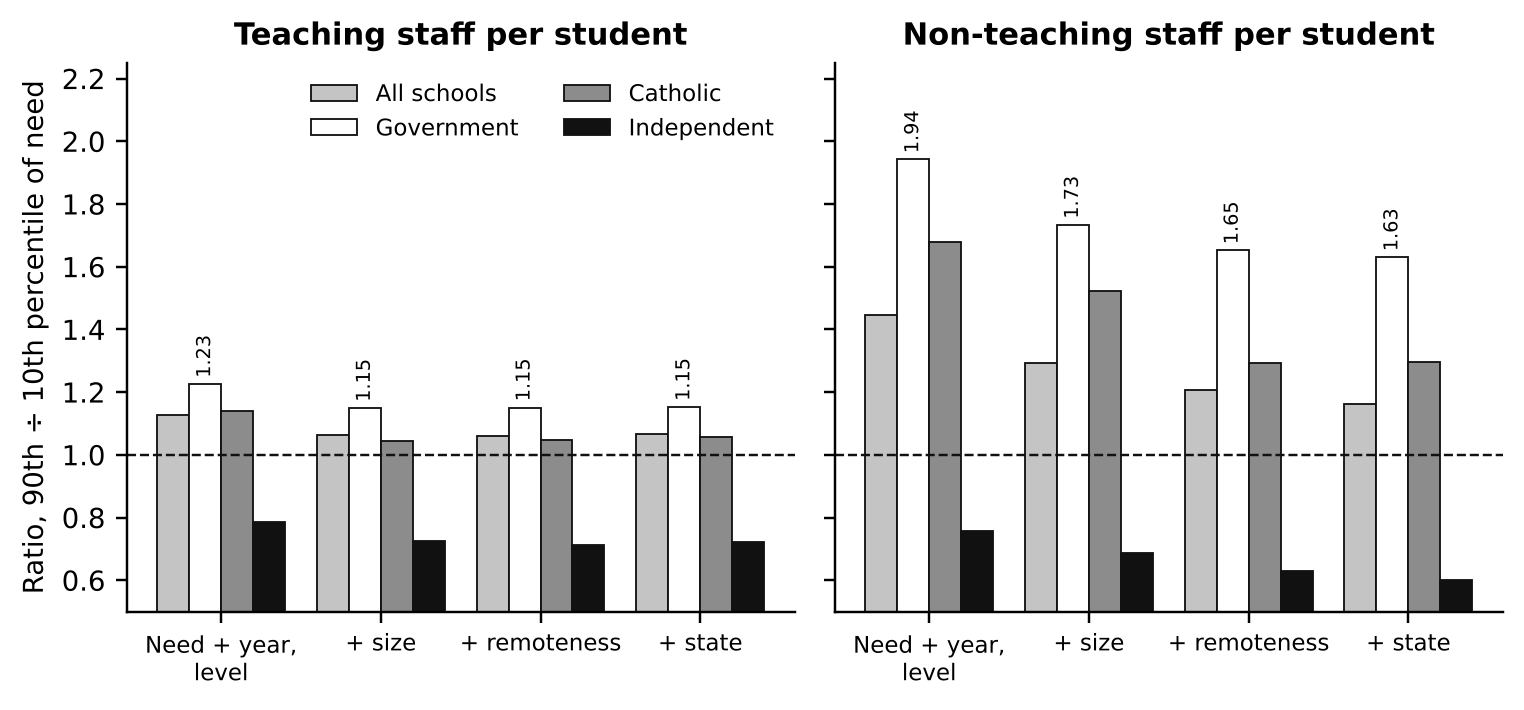
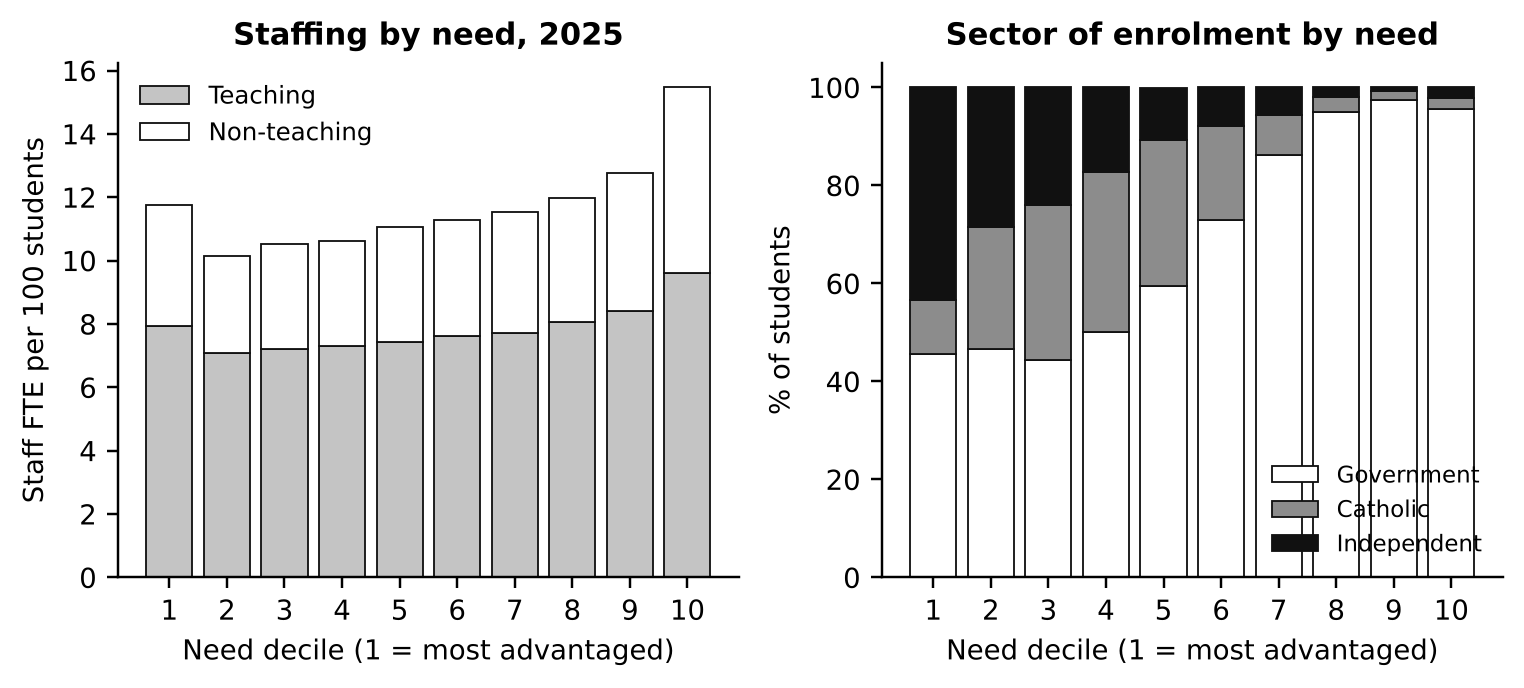
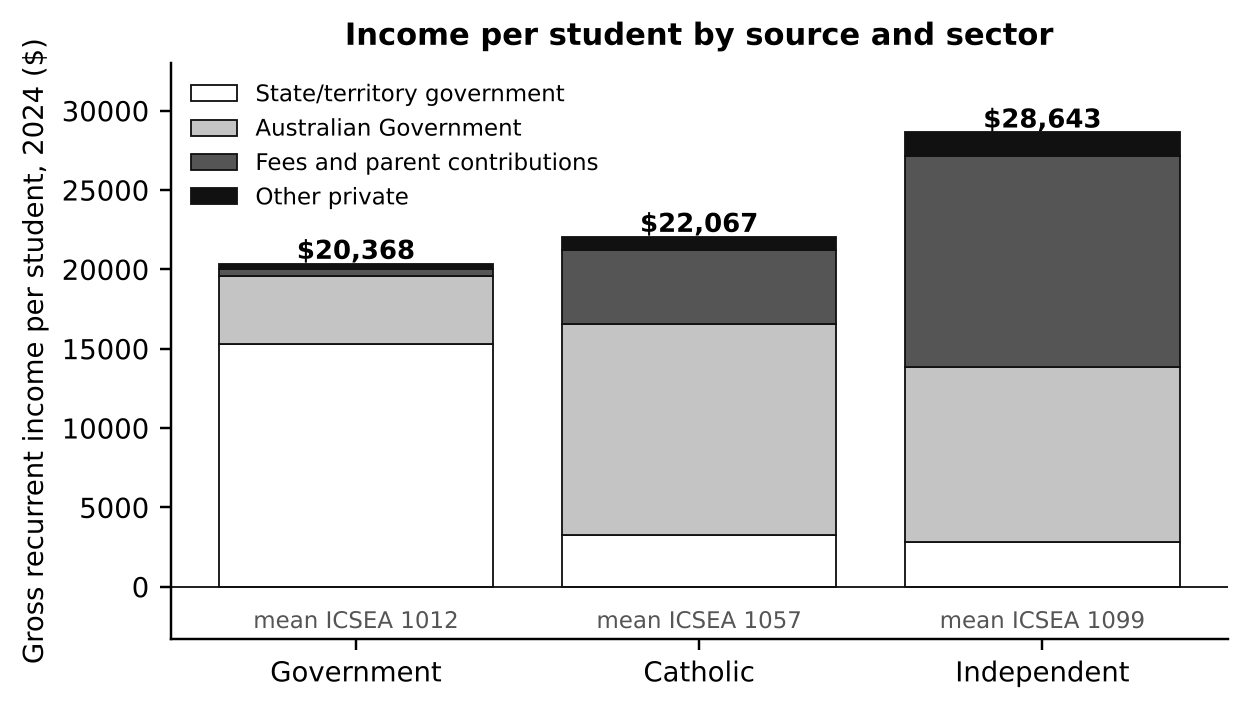
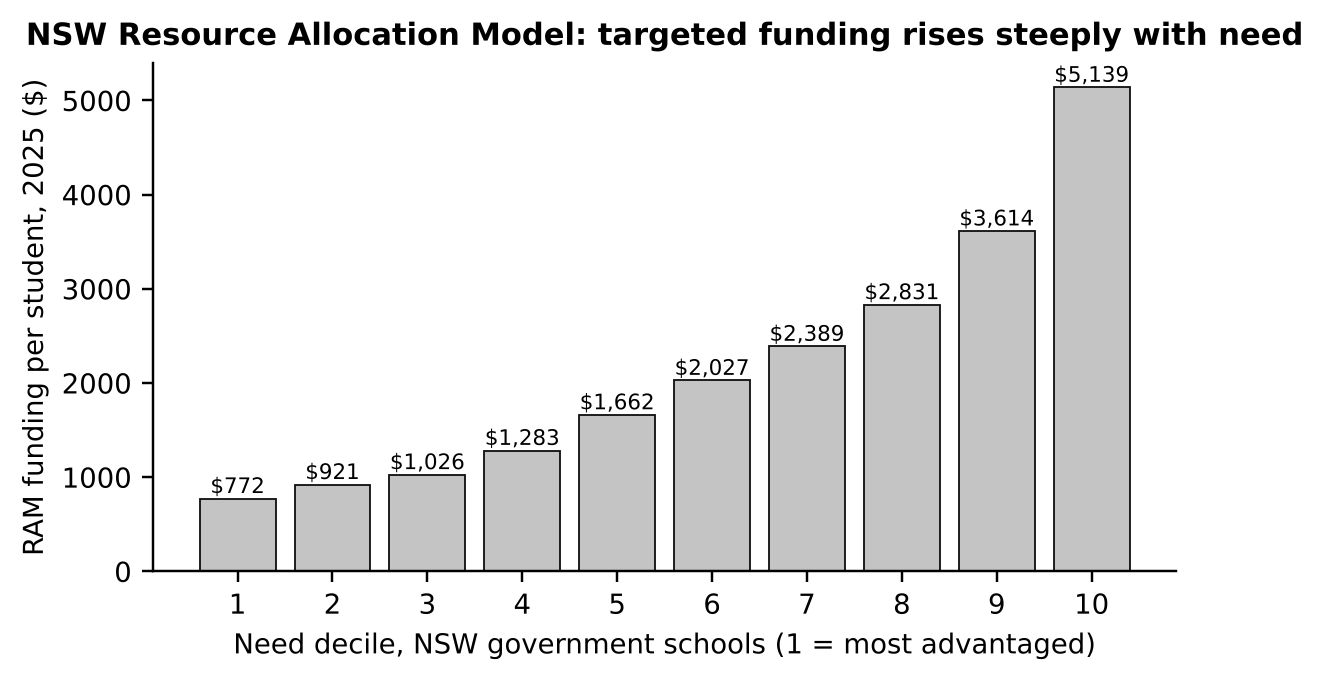
Risk and Resources in Australian Schools (October 2026). Applies the risk and resource analysis steps of the framework to about 9,350 government, Catholic and independent schools, 2015–2025, using ACARA’s open school profile and finance data, Victorian senior secondary results and NSW school-level formula funding. ICSEA, ACARA’s index of socio-educational advantage, alone explains 73% of the variation in Victorian schools’ median VCE study scores, and sector adds nothing once it is held constant. Government schools staff progressively: comparing similar schools in the same state, high-need schools have 1.15 times the teaching staff per student. The independent sector is regressive (0.72), and with independent schools enrolling the most advantaged students and drawing fee income on top of public funding, the system as a whole is barely progressive (1.07). NSW’s Resource Allocation Model shows how targeted funding can be steeply progressive. A cost function is not feasible with open data but would be with ACARA’s licensed school-level NAPLAN and finance data, and would allow the Schooling Resource Standard loadings to be tested.
- Policy Brief: School Funding Equity in Australia (PDF)
- Slide Deck: School Funding Equity in Australia (PDF)