Full report: Digging Out: Restoring Equal Educational Opportunity in Texas (PDF)
Dear Governor-elect Hinojosa,
Congratulations. You take office in January with an opportunity no Texas governor has had in a long time: the chance to start digging the state’s public schools out of a hole Texas has spent the better part of two decades digging.
I’ve been working on Texas school finance since 2004, first alongside the state’s own analysts on the Texas School Finance Project, and later as an expert witness in the 2012 school finance trial before Judge John Dietz. I’ve just completed a new report, Digging Out: Restoring Equal Educational Opportunity in Texas (PDF linked below), that pulls together what the data show today. I’ll summarize the main points here.
Texas used to lead
It’s easy to forget, but Texas was once ahead of most of the country on school funding. After Edgewood v. Kirby in 1989, and the “Robin Hood” equalization that followed in 1993, Texas ranked 6th in the nation in school funding effort, measured as spending relative to personal income. Its state and local revenue was progressive, meaning higher-poverty districts got more per pupil. And by 2000, Texas students outscored the national average in NAEP math.
Then Texas stopped investing
Since the mid-2000s, the state has steadily backed away:
- Effort fell from 6th to 35th. Texas spent 5.35% of personal income on schools in 1993 and 3.31% in 2024, below the median state.
- Teachers fell further behind. A 35-year-old Texas teacher now earns 68% of what similarly educated non-teachers earn, down from 85% in 2000.
- The basic allotment stalled. It went up $55 between 2019 and 2025. Once you account for inflation, it’s worth about 20% less than it was in 2019.
- The highest-poverty districts are funded at about half of cost. Using the National Education Cost Model, the highest-poverty fifth of Texas districts spent about 50% of what it would cost to reach national-average outcomes in 2024. That’s 46th of 48 states. Even the state’s lowest-poverty districts are at 70%, down from 113% in 2009.
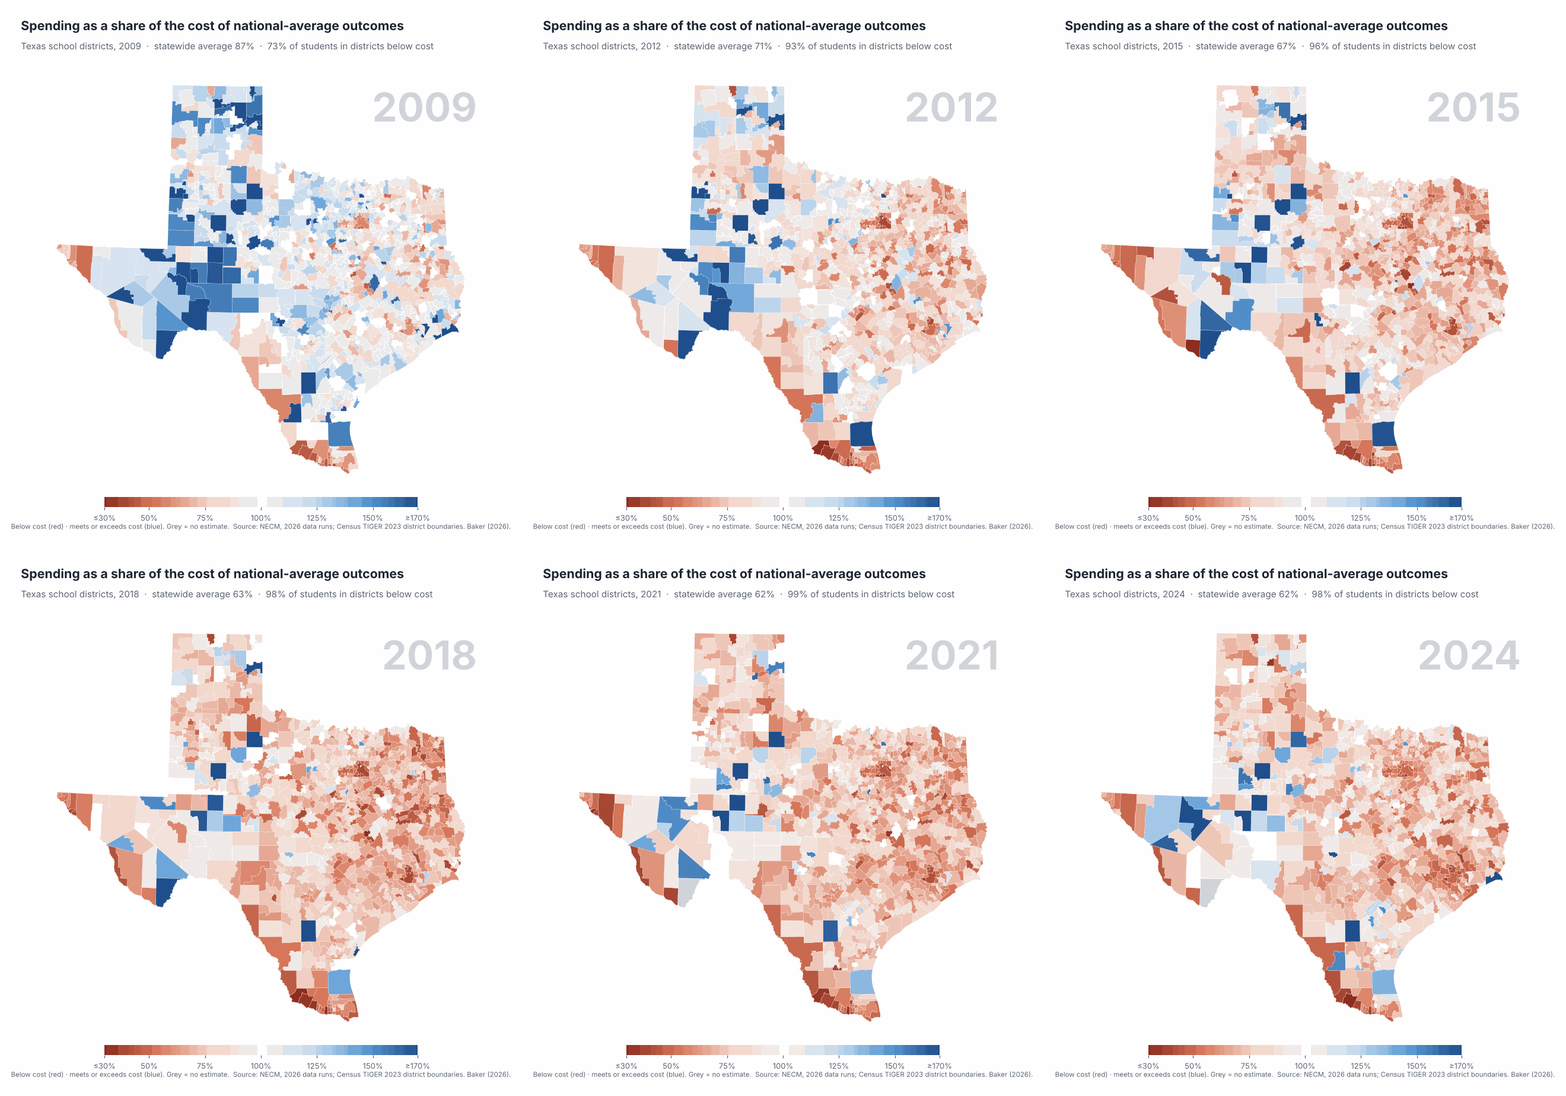
The map tells the story. In 2009, 73% of Texas students attended districts spending below the cost of national-average outcomes. By 2024, 98% did.
The children most affected are overwhelmingly Black and Hispanic. In 2024, 93% of children in majority Black and Hispanic districts attended districts that were both funded below cost and performing below the national average, compared with 45% of children elsewhere (87% versus 33% averaged over 2009–2024). Houston ISD spends about 46% of its estimated cost. Dallas spends 43%. Edgewood ISD, the district whose name is on the 1989 decision, spends 61%, while Alamo Heights, a few miles away, spends 114% of its cost.
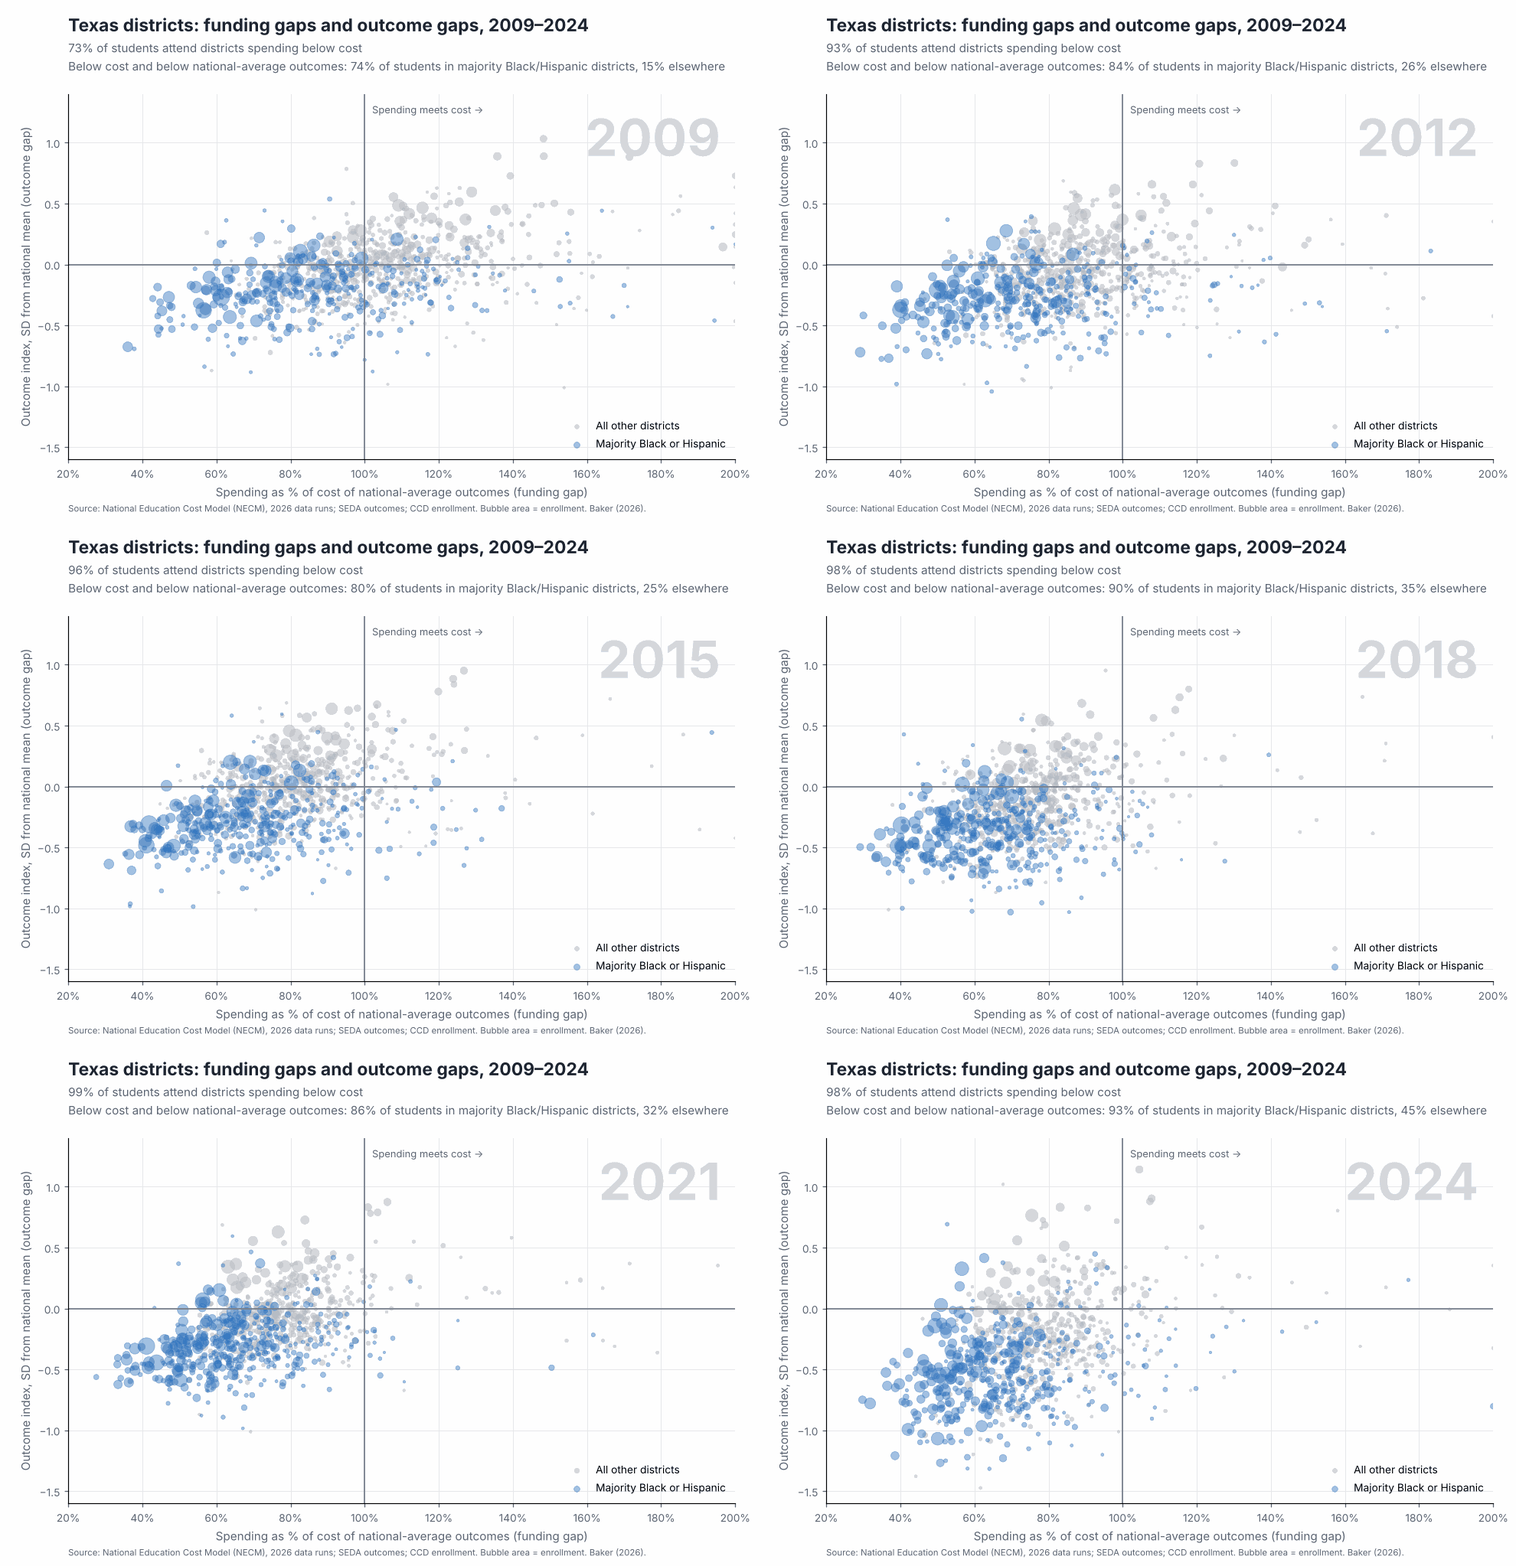
And outcomes have followed the money. Texas 8th graders went from 7.5 points above the national average in NAEP math in 2011, the year of the $5.4 billion cut, to 3 points below in 2024.
Money matters, and it matters most where Texas has underinvested
The research on this is no longer seriously in dispute. Increases in school funding improve student outcomes, and cuts make them worse. That holds whether the money goes to operations or facilities, and whether it comes from legislatures, courts, or local voters. And additional dollars have the biggest effect where states have historically underinvested and where child poverty is highest. That describes much of Texas.
The vouchers are the wrong priority
The state launched its Education Freedom Accounts this year at $1 billion. About 43% of selected students came from public schools; most of the money is going to families who were already in private school or homeschooling. The Comptroller has already asked for roughly $2 billion for the next biennium, and the Legislative Budget Board projected costs of $4.8 billion by 2030.
By comparison, closing the gap between what Texas districts spend and what it would cost to reach just national-average outcomes runs on the order of $45 billion a year. The voucher program is pegged to average state and local funding, which this analysis finds falls below cost in nearly every district. The state shouldn’t be expanding a private alternative at a funding level it hasn’t shown is adequate for its public schools.
You already know one fix
As a legislator, you filed HB 1246 in 2021 and HB 31 in 2023 to fund Texas schools on enrollment rather than average daily attendance. That proposal is right, and the evidence behind it goes back more than a decade. In my 2012 expert report in the school finance trial, I showed that attendance as a share of enrollment fell steadily from the lowest- to the highest-poverty fifth of Texas districts in every year from 2006 to 2011. Because Texas uses attendance both for the base count and for the students who generate need weights, that gap compounds through the whole formula. Sean Corcoran and I made the same point nationally that year in The Stealth Inequities of School Funding: funding on attendance works as an “unpoverty weight,” quietly moving money away from the districts that serve the most children in poverty.
Neither bill passed, and the problem is still with us. Texas still funds schools on average daily attendance; last year’s HB 2 changed only how often attendance is updated during the year, not what gets counted. Every Texan estimates that about 460,000 enrolled students, 8% of the total, went unfunded in 2023–24 as a result. Commissioner Morath put the cost of switching to enrollment at about $6 billion per biennium. That is real money, but it is a fraction of the gap documented here, it would go to exactly the districts furthest below cost, and it is the one fix that does not need to wait for a new cost study.
What I’d ask you to do
Fixing this takes three steps, and the first can start right away.
- Study it. Commission an independent, Texas-specific cost study in 2027 to determine what it costs for every district and campus to provide equal opportunity to reach the state’s outcome goals. Texas has done this before. In 2004, Texas A&M researchers (Gronberg, Jansen, Taylor and Booker) and economists Jennifer Imazeki and Andrew Reschovsky both estimated cost models on Texas data. The methods have improved a great deal since.
- Recalibrate it. Rebuild the Foundation School Program so each district’s funding target matches its cost. That means poverty and English learner weights sized to actual costs, a current regional wage adjustment to replace the Cost of Education Index the state abandoned, scale and sparsity adjustments estimated from data, and student counts based on enrollment rather than attendance. The 2029 session is a realistic target for a full new formula.
- Fund it. Index the basic allotment to inflation. Stop counting property tax compression as new school funding. Phase in the gap on a fixed schedule. And before Education Freedom Accounts grow any further, show that public school districts are funded at cost.
In Morath (2016), the Texas Supreme Court called the system “Byzantine,” “undeniably imperfect, with immense room for improvement,” and left it to the Legislature to fix. The Legislature has acted twice since then, in 2019 and 2025, and neither time changed the basic pattern: the districts with the greatest needs remain the furthest from adequate funding.
Texas led once. It can lead again.
Respectfully,
Bruce D. Baker
University of Miami


