
Or: how one of the richest states in the country managed to fund its whitest school districts at twice what they need and its Black and Hispanic districts at less than three-quarters.
Connecticut likes to think of itself as an education state. High test score averages, leafy suburbs, famous prep schools, Yale. And on average, sure. But I’ve spent a lot of years on this blog pointing out that averages are where inequality goes to hide.
In CCJEF v. Rell, a trial judge found in 2016 that Connecticut’s school funding system was irrational. In January 2018, a divided 4–3 Connecticut Supreme Court reversed that ruling, holding that the state had met its minimal constitutional obligation. Read charitably, the decision handed school funding back to the legislature. Read the way Connecticut lawmakers apparently read it, it was a dare: how unequal can we make this before anybody stops us?
Challenge accepted.
To be fair to the legislature, it had a head start. By the measures I use below, Connecticut already had the largest racial school funding gap in the country in 2009, and it has held that title every year I can measure. But once the court took itself off the field, lawmakers didn’t just defend the title. They ran up the score. From 2018 to 2024, funding adequacy in the districts serving Connecticut’s most Black and Hispanic fifth of students fell from 78% to 73% of what it would cost to reach national-average outcomes, and from 52% to 49% of what it would cost to reach Massachusetts-average outcomes. The share of Black students attending districts that spend less than it would cost to reach Massachusetts-average outcomes rose from 75% to 82%; for Latino students, from 71% to 77%. And the state funding system went from the 11th most regressive in the nation to the 4th.
In 2021, Robert Cotto, Preston Green and I wrote in the CT Mirror that it was time to fix Connecticut school finance (I laid out the case here too: Fixing Connecticut School Finance: The Time is Now), in three steps: study what it would actually cost to give every child an equal shot at robust outcomes, recalibrate the Education Cost Sharing (ECS) formula to hit those cost targets, and fund it. Five years later, the state has taken none of those steps. In our most recent national report, The Adequacy and Fairness of State School Finance Systems, Connecticut ranked 46th of 47 states on equal educational opportunity. In April, Governor Lamont created a commission to reevaluate education funding. Consider this a contribution to its homework. Here, using the same cost model and indicators from my recent red state, blue state posts, is how Connecticut lawmakers took the court’s pass and built the most racially unequal school funding system in the country.
Round 1: Funding by race
Start with the National Education Cost Model. For every district, it estimates what it would cost to get that district’s kids to national average outcomes, given who they are and where they live. Divide what the district actually spends by that cost, and you get percent of adequate. At 100%, the money covers the cost of average outcomes. Not elite outcomes. Average.
National average is a low bar for a state that likes to compare itself to Massachusetts. So the model also estimates what it would cost each district to reach Massachusetts-average outcomes, about one and a half times the national-average cost. I report both throughout: the national standard first, and the Massachusetts standard (“MA”) alongside it. Spoiler: raising the bar doesn’t change the rankings. It just makes the hole a lot deeper.
Now sort Connecticut’s students into five equal groups, from those attending the districts with the smallest shares of Black and Hispanic students to those attending districts with the largest.
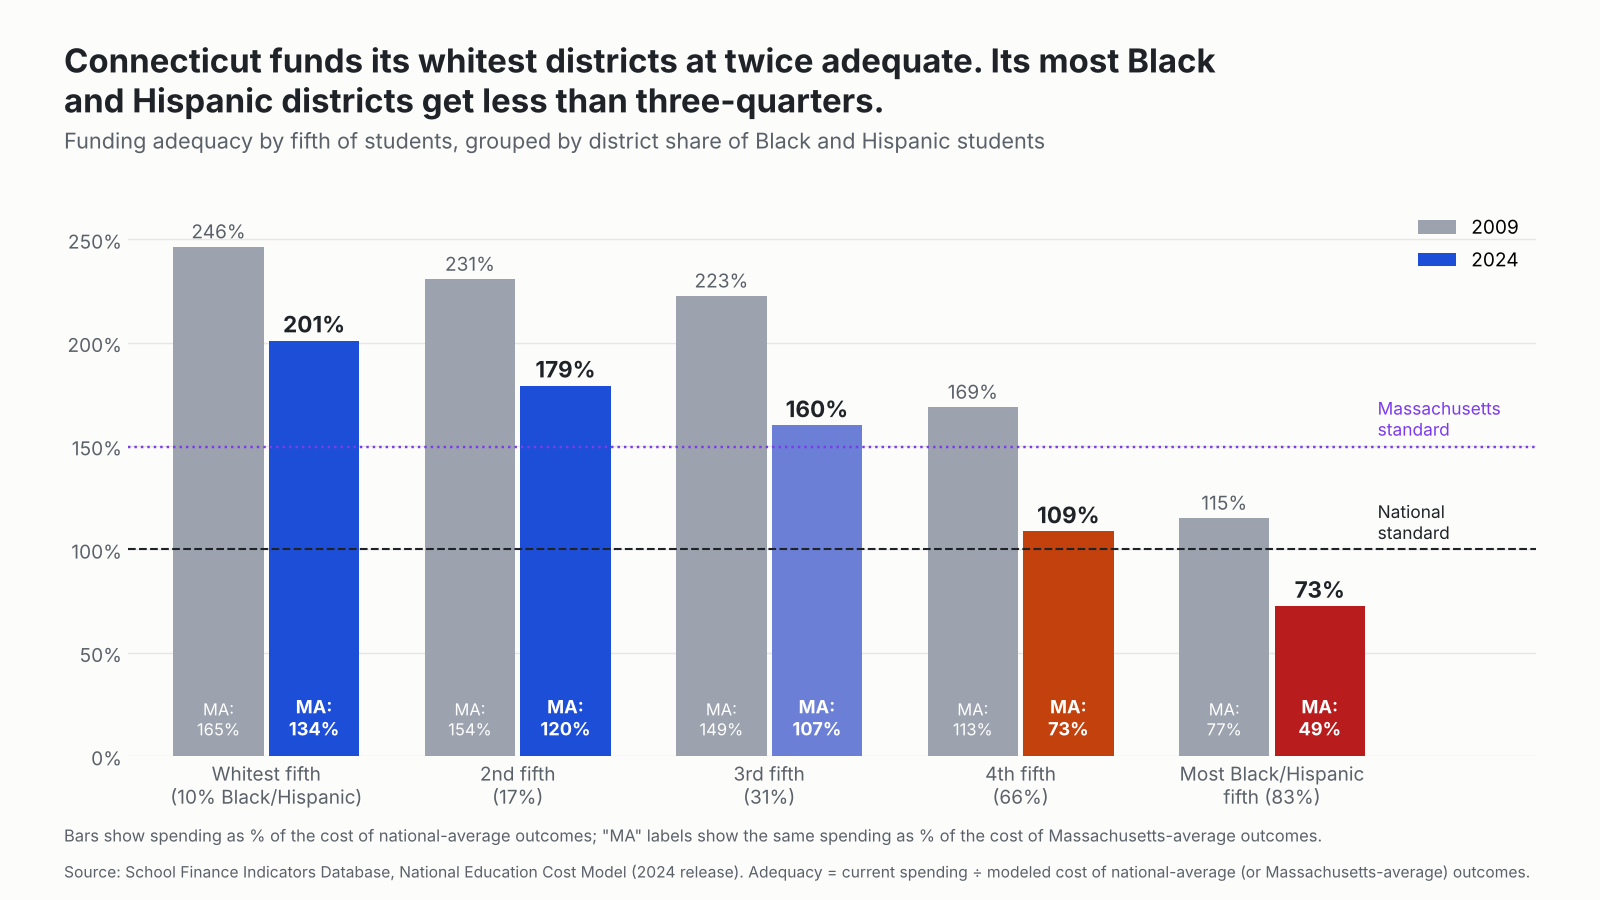
In 2024, the fifth of Connecticut students in the whitest districts (about 10% Black and Hispanic) attended schools funded at 201% of adequate (134% of the MA standard), about $13,500 per pupil more than the cost of national average outcomes. The fifth in the most Black and Hispanic districts (83% Black and Hispanic) attended schools funded at 73% (49% of the MA standard), about $8,900 per pupil short. That’s a gap of 128 percentage points (86 points against the MA standard). Against the Massachusetts standard, the whitest fifth is still about $6,900 per pupil ahead, while the most Black and Hispanic fifth is about $25,000 per pupil short. Put differently, the whitest districts sit about $22,400 per pupil further ahead of where they need to be than the most Black and Hispanic districts against the national standard, and about $31,900 further ahead against the Massachusetts standard.
How does that compare? I ran the same calculation for every state with enough districts to do it.
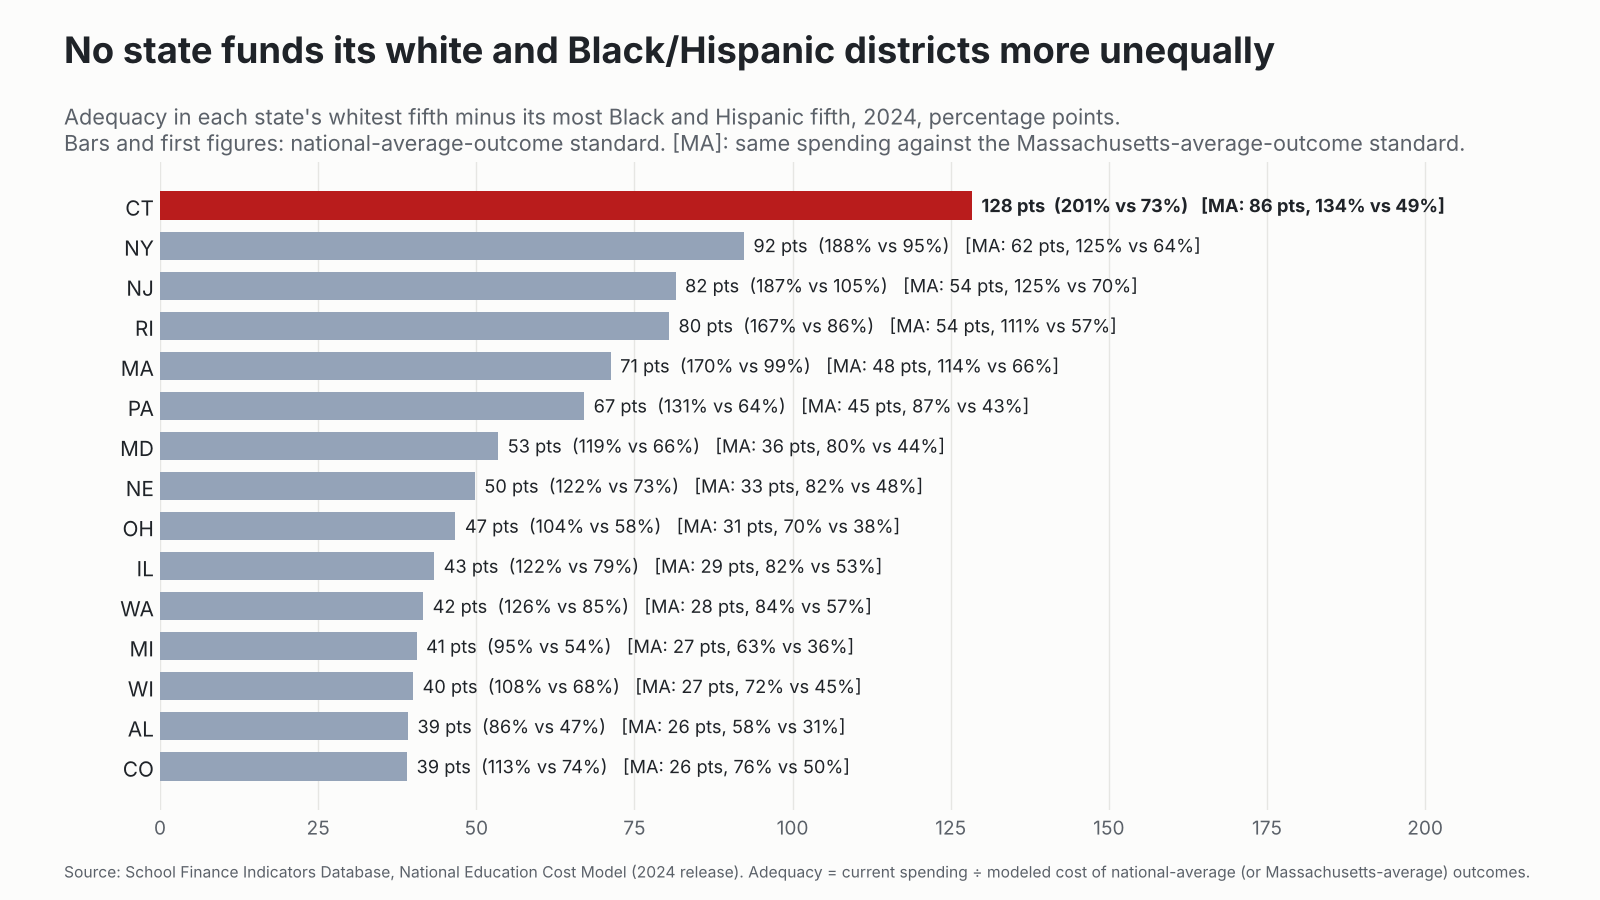
Connecticut is first under either standard, and it isn’t close. New York is a distant second at 92 points (62 against the MA standard, vs. Connecticut’s 86). Notice who else is up there: New Jersey, Rhode Island, Massachusetts. These are mostly wealthy northeastern states with small, fragmented districts drawn along lines of race and class, where the affluent towns spend like private schools. But Connecticut takes it to a level of its own.
Look at it from the student’s side. Just over half of Connecticut’s Black and Hispanic students, about 99,000 kids, attend districts funded below national adequacy. For all other students, it’s 9%. Against the Massachusetts standard, it’s 78% of Black and Hispanic students (about 153,000 kids) vs. 26% of everyone else. The typical Black or Hispanic student in Connecticut attends a district funded at 99% of adequate (66% of the MA standard). The typical student who isn’t Black or Hispanic attends one funded at 158% (105% of the MA standard). That 59-point difference in exposure is also the largest in the country.
Round 2: Names, not quintiles
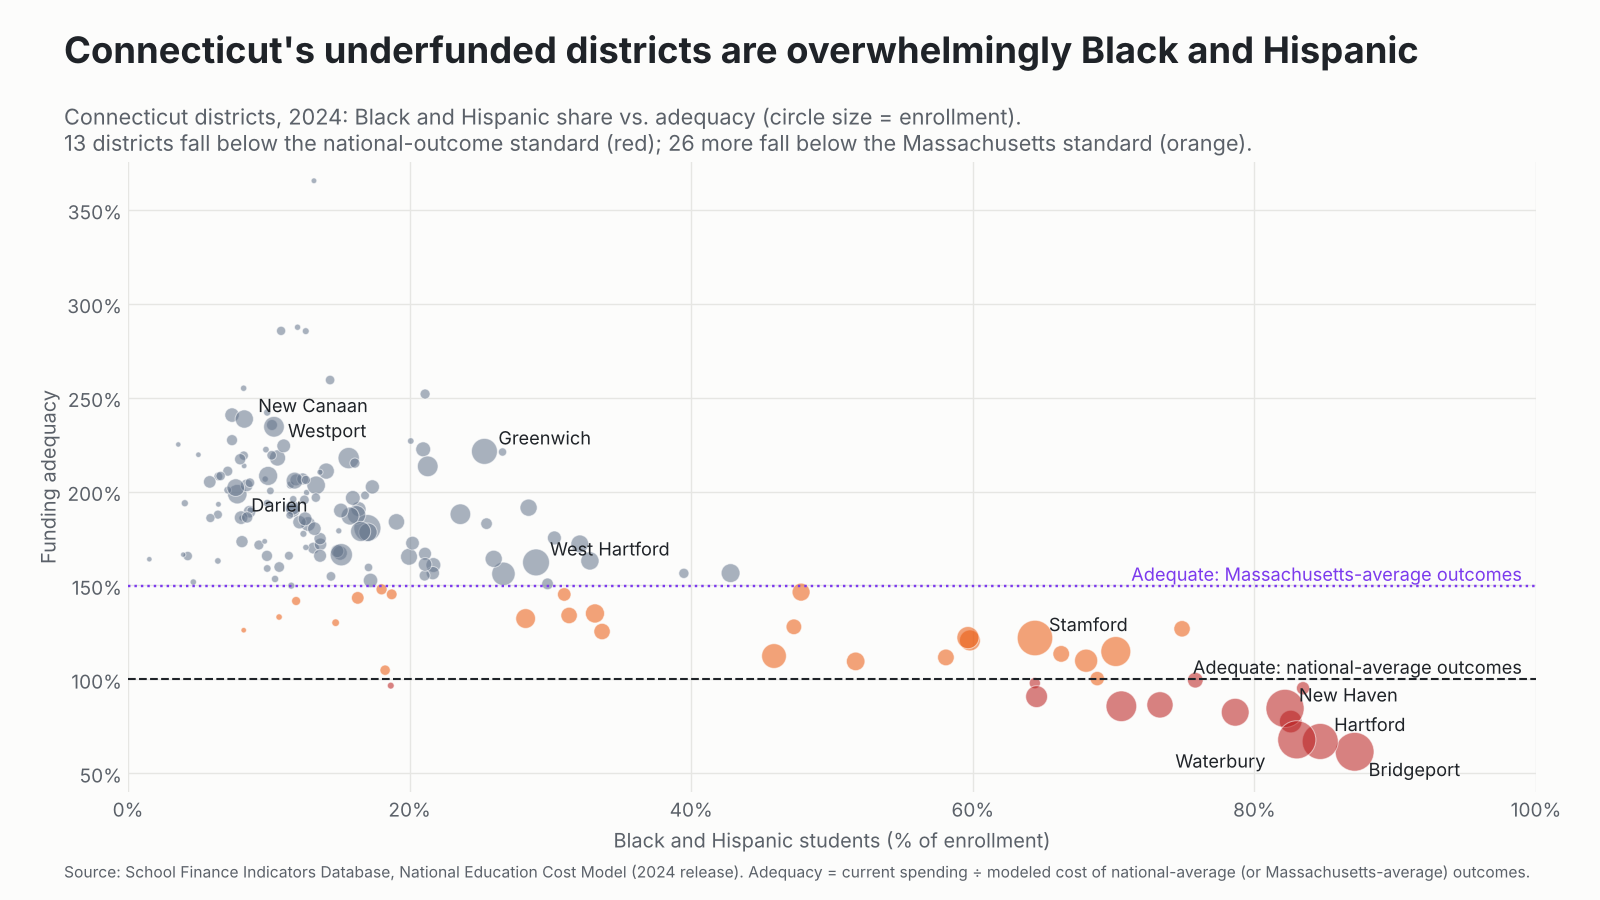
Quintiles are abstractions. Here’s what it looks like district by district.
| District | Black & Hispanic | Child poverty | Spending per pupil | Cost: national avg. | Adequacy: national | Cost: MA avg. | Adequacy: MA |
|---|---|---|---|---|---|---|---|
| Bridgeport | 87% | 25% | $21,004 | $34,195 | 61% | $51,172 | 41% |
| Hartford | 85% | 34% | $26,602 | $39,752 | 67% | $59,488 | 45% |
| Waterbury | 83% | 33% | $20,824 | $30,709 | 68% | $45,955 | 45% |
| New Haven | 82% | 24% | $23,235 | $27,491 | 85% | $41,139 | 56% |
| Darien | 8% | 2% | $28,136 | $14,167 | 199% | $21,200 | 133% |
| Greenwich | 25% | 5% | $31,563 | $14,255 | 221% | $21,333 | 148% |
| Westport | 10% | 3% | $29,927 | $12,761 | 235% | $19,097 | 157% |
| New Canaan | 8% | 3% | $29,555 | $12,384 | 239% | $18,533 | 159% |
Westport spends about $8,900 more per pupil than Bridgeport. Bridgeport’s kids, by the cost model’s estimate, need nearly three times as much to reach the same modest goal. So Westport spends more, needs less, and ends up funded at 235% of adequate while Bridgeport sits at 61%. They are about 20 minutes apart on I-95. Bridgeport, by itself, is about $13,200 per pupil short of adequate. So is Hartford. Against the Massachusetts standard, Westport is at 157% and Bridgeport at 41%, about $30,200 per pupil short. Hartford is about $32,900 short.
Thirteen Connecticut districts were funded below adequate in 2024. Together they serve about 124,000 students and fall about $931 million a year short. Twelve of the thirteen are majority Black and Hispanic. (The thirteenth is tiny Sprague, with fewer than 300 students.) Four of Connecticut’s five largest cities are on the list. (Stamford, at 122% of adequate, is the exception.) Raise the bar to Massachusetts and 39 districts fall short, serving about 226,000 students, nearly half the state, by about $3.4 billion a year. That includes all eight of Connecticut’s largest districts, Stamford (82%) among them. Twenty-two of the 39 are majority Black and Hispanic.
Round 3: It didn’t have to be this way
Here’s the part that should bother Connecticut most. In 2009, by this same measure, no Connecticut district was funded below adequate. Hartford was at 133%. Bridgeport was at 104%. The most Black and Hispanic fifth of students was at 115%. Unequal, yes, but everyone was above the line. Even against the Massachusetts standard, Hartford was at 89%, Bridgeport at 70%, and 16 districts fell short.
Fifteen years later, Hartford is at 67%, Bridgeport at 61%, and 13 districts serving a quarter of the state’s students are below adequate. Against the Massachusetts standard, Hartford is at 45%, Bridgeport at 41%, and the count of districts falling short went from 16 to 39. Meanwhile the dollar gap between the whitest and most Black and Hispanic fifths of students more than doubled in real terms, from about $9,600 per pupil in 2009 (in 2024 dollars) to about $22,400 in 2024 against the national standard, and from about $15,200 to about $31,900 against the Massachusetts standard.
How? Look at how state and local revenue lines up with poverty.
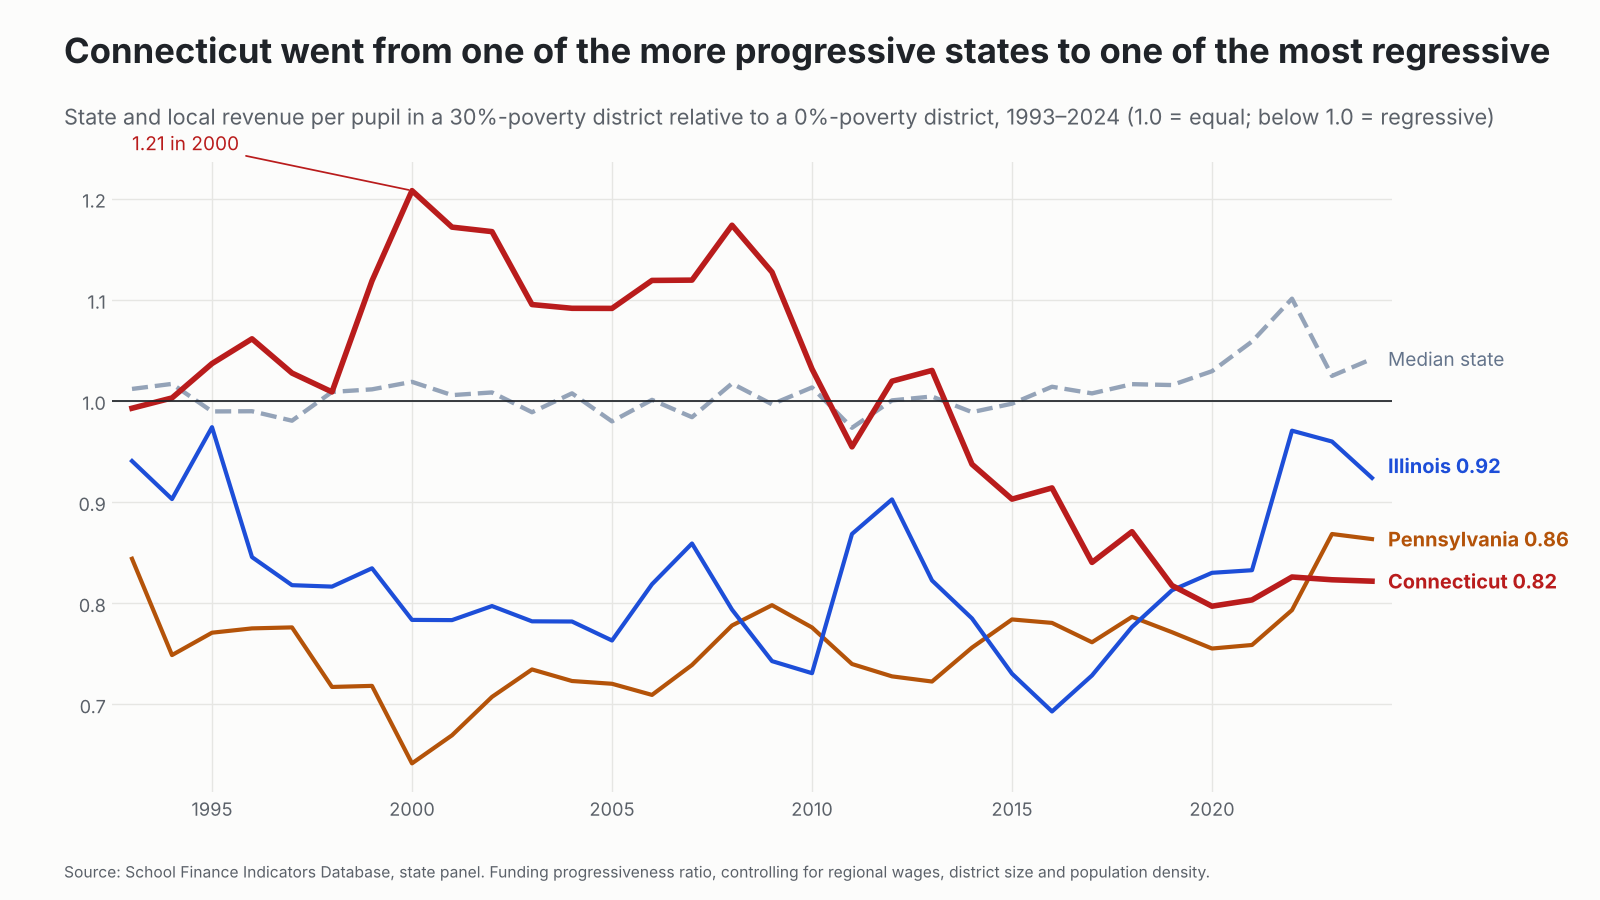
Connecticut wasn’t always like this. Through the 1990s and 2000s its state and local revenue actually tilted toward higher-poverty districts. At the peak, in 2000, a district with 30% child poverty received about 21% more per pupil than a district with none, and Connecticut stayed on the progressive side, give or take a year, until about 2013. Since then it has slid almost every year. By 2024 that same high-poverty district received about 18% less, making Connecticut the fourth most regressive school funding system in the country. The median state moved the other way. (I walked through this slide in more detail back in May: The collapse of fairness in Connecticut school funding.)
For context, I’ve spent years using Illinois and Pennsylvania as my go-to examples of regressive school finance. Both were below 1.0 for nearly this entire period. Both have since improved: Illinois adopted its Evidence-Based Funding formula in 2017, and a Pennsylvania court struck down that state’s system in 2023. In 2024 Illinois sat at 0.92 and Pennsylvania at 0.86. Connecticut, at 0.82, is now more regressive than both.
This is what happens when a state leans on local property wealth and lets its aid formula drift. The rich towns raise more locally, as rich towns always will. The state aid that is supposed to offset that doesn’t keep up. The slide started before the court ruled. The ruling just removed the last referee who might have stopped it. Everyone tells themselves the formula is being phased in.
A caveat before anyone holds up Illinois as the model for Connecticut. Illinois’s Evidence-Based Funding formula is better than the system it replaced, and the trend lines here show it. But as I explained in When Evidence Based Isn’t, it is not what it claims to be. Its “adequacy targets” come from consultant-built prototype schools, not from any measured relationship between spending and outcomes. They differ by only about 22% between the state’s lowest- and highest-poverty districts, when getting high-poverty districts to common outcomes typically takes two to three times as much. They overstate what the most affluent suburbs need and understate what Chicago and other high-poverty districts need. That is a political compromise dressed up as evidence: modest increases spread across lots of constituents, rather than what kids in high-need districts actually need. It shows in the numbers above. Eight years into EBF, Illinois’s highest-poverty fifth of students is still funded at only 79% of the cost of national-average outcomes and 53% of the Massachusetts standard. So the lesson for Connecticut’s commission isn’t “copy Illinois.” It’s “don’t let consultants pre-compromise the cost targets.” Do an actual cost study, calibrated to an actual outcome goal.
Same story by poverty
Sort Connecticut’s students by child poverty instead of race and you get nearly the same picture, because in Connecticut those are nearly the same districts. The lowest-poverty fifth is funded at 195% of adequate (130% of the MA standard); the highest-poverty fifth at 73% (49%). That 122-point gap (82 points against the MA standard) is the second largest in the country under either standard, behind only New York.
Connecticut vs. Illinois and Pennsylvania
So how does Connecticut compare with my usual suspects over time? First, the gap between each state’s lowest- and highest-poverty fifths of students.
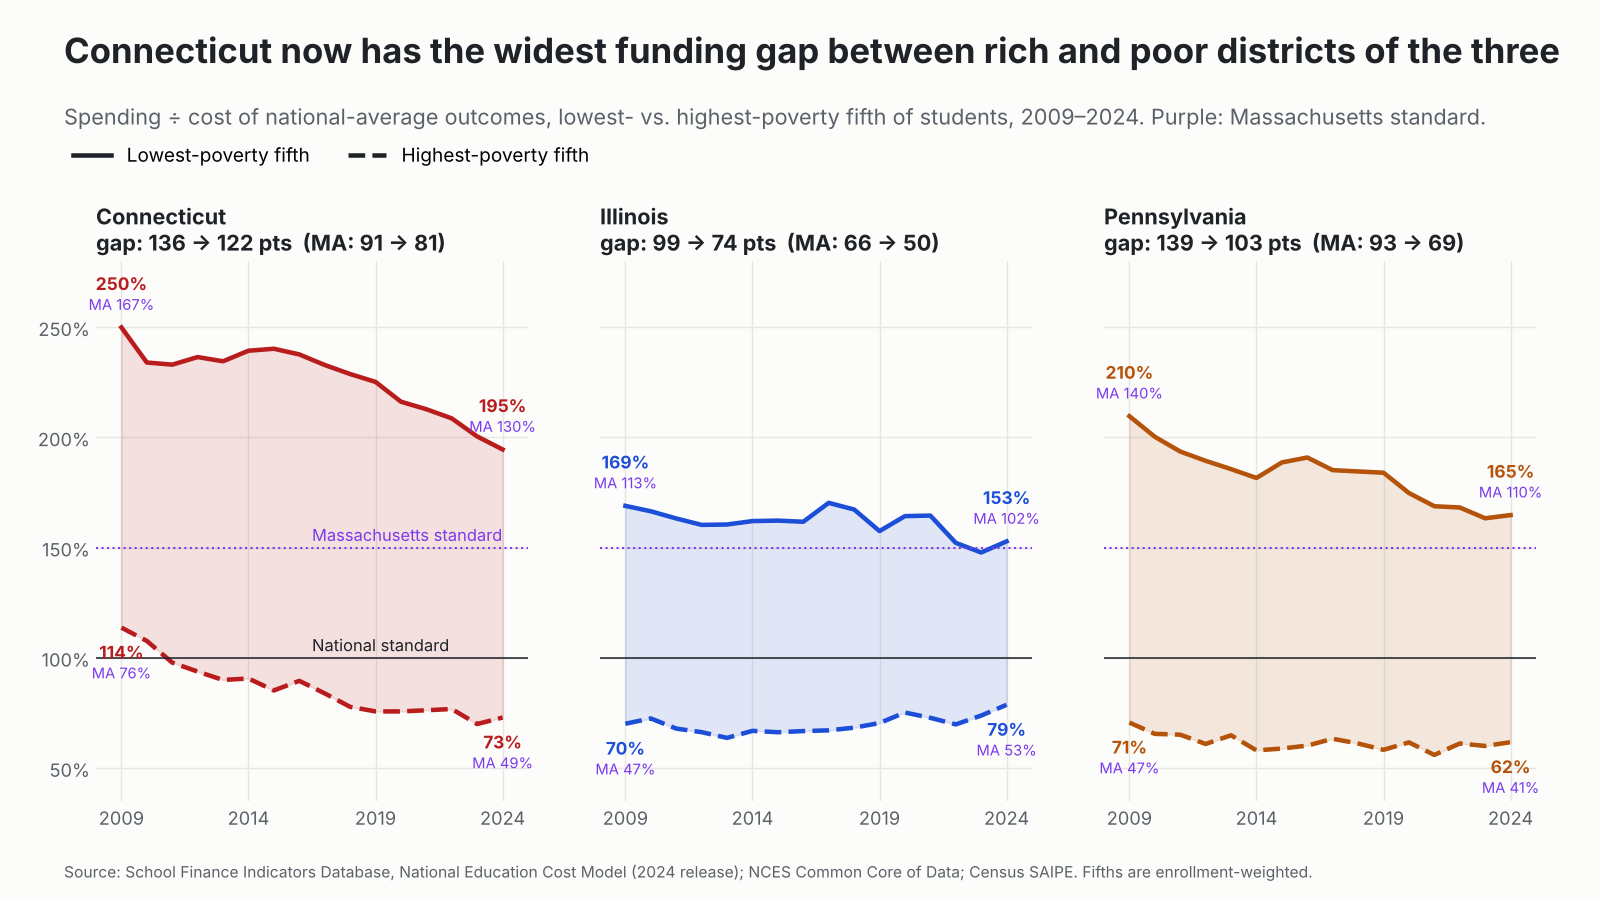
Connecticut’s poverty gap narrowed a bit, from 136 points to 122, but only because both ends fell, and the bottom fell through the floor: its highest-poverty districts went from 114% of adequate to 73%. Pennsylvania’s gap was actually larger than Connecticut’s in 2009 (139 points) and has narrowed to 103, though its poorest districts were underfunded then and still are (62%). Illinois narrowed its gap the most, from 99 points to 74, with its highest-poverty districts rising from 70% to 79%. Connecticut now has the widest poverty gap of the three. Against the Massachusetts standard (the purple labels), the gaps run 81 points in Connecticut, 69 in Pennsylvania and 50 in Illinois, and the highest-poverty fifth falls far short everywhere: 49% in Connecticut, 41% in Pennsylvania and 53% in Illinois. The difference is that Connecticut’s lowest-poverty fifth is at 130% of the MA standard, while Illinois’s is at 102%.
Now by race.
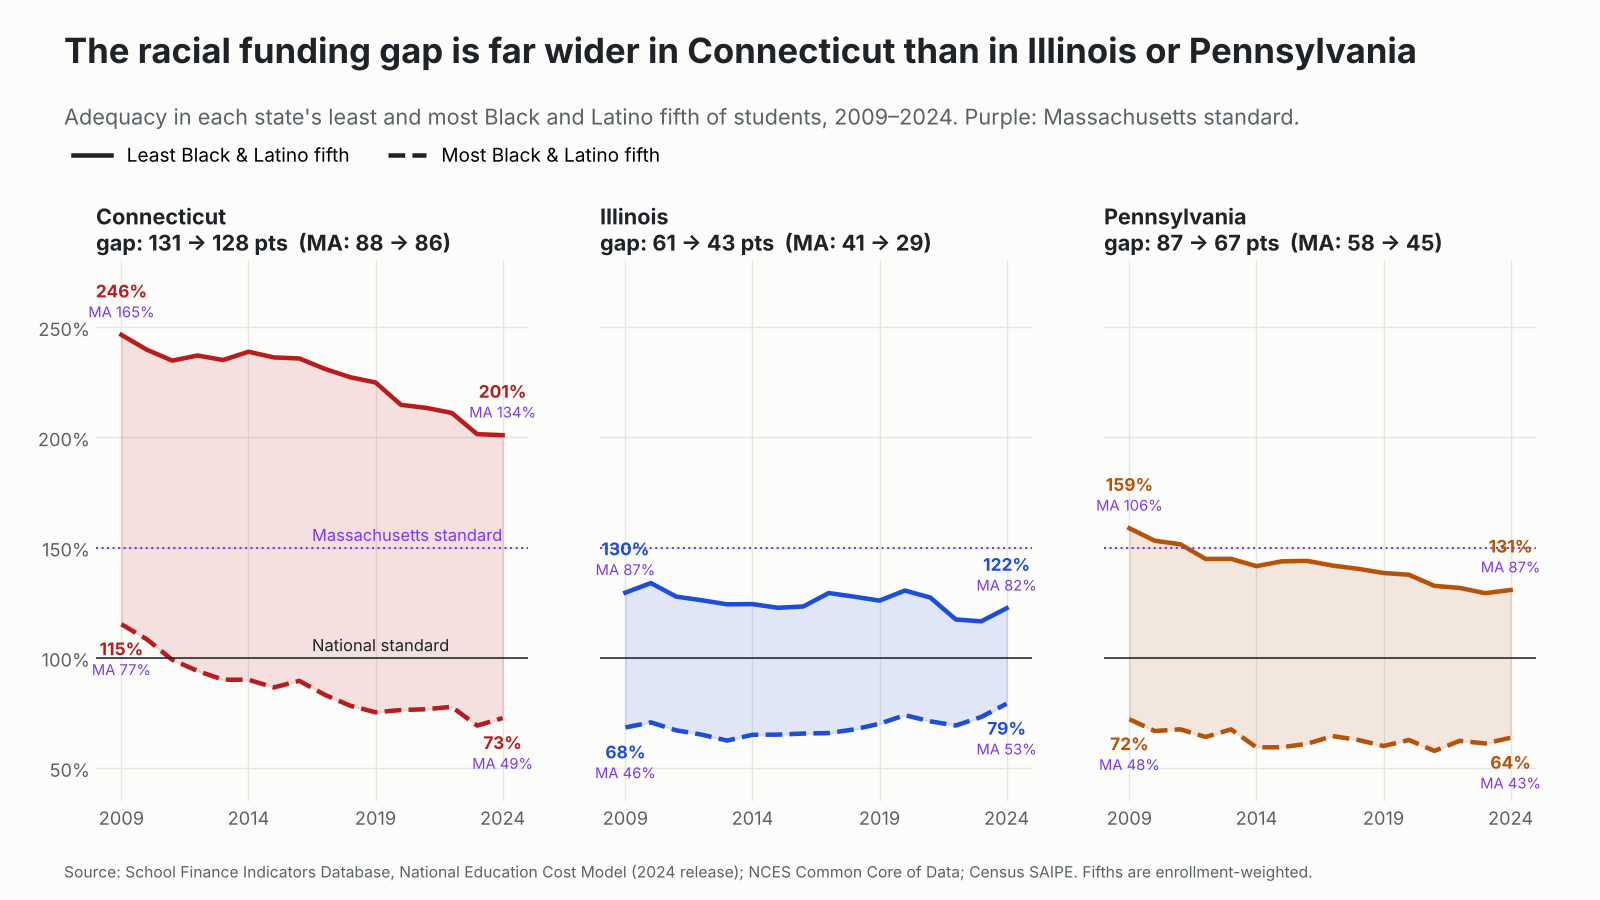
Not close. Connecticut’s gap between its least and most Black and Latino fifths of students was 131 points in 2009 and 128 in 2024. Pennsylvania’s is 67 points. Illinois’s is 43, down from 61. In Illinois and Pennsylvania the whitest districts are funded at 122% to 131% of adequate. In Connecticut, 201%. Against the Massachusetts standard, the gaps are 86 points in Connecticut, 45 in Pennsylvania and 29 in Illinois. The whitest districts in Illinois and Pennsylvania don’t even reach the Massachusetts standard (82% and 87%). Connecticut’s are at 134%.
Raise the bar to Massachusetts
I’ve been reporting both standards. Here’s the one that matters most for Connecticut. As I explained in my recent brief on Connecticut’s equal educational opportunity problem, the state’s real peers are Massachusetts and New Jersey, and Connecticut has been losing ground to both since the early 2010s. So who attends a district that spends less than it would cost to reach Massachusetts-average outcomes? (The dashed lines and inner bars in the chart below show the national standard.)
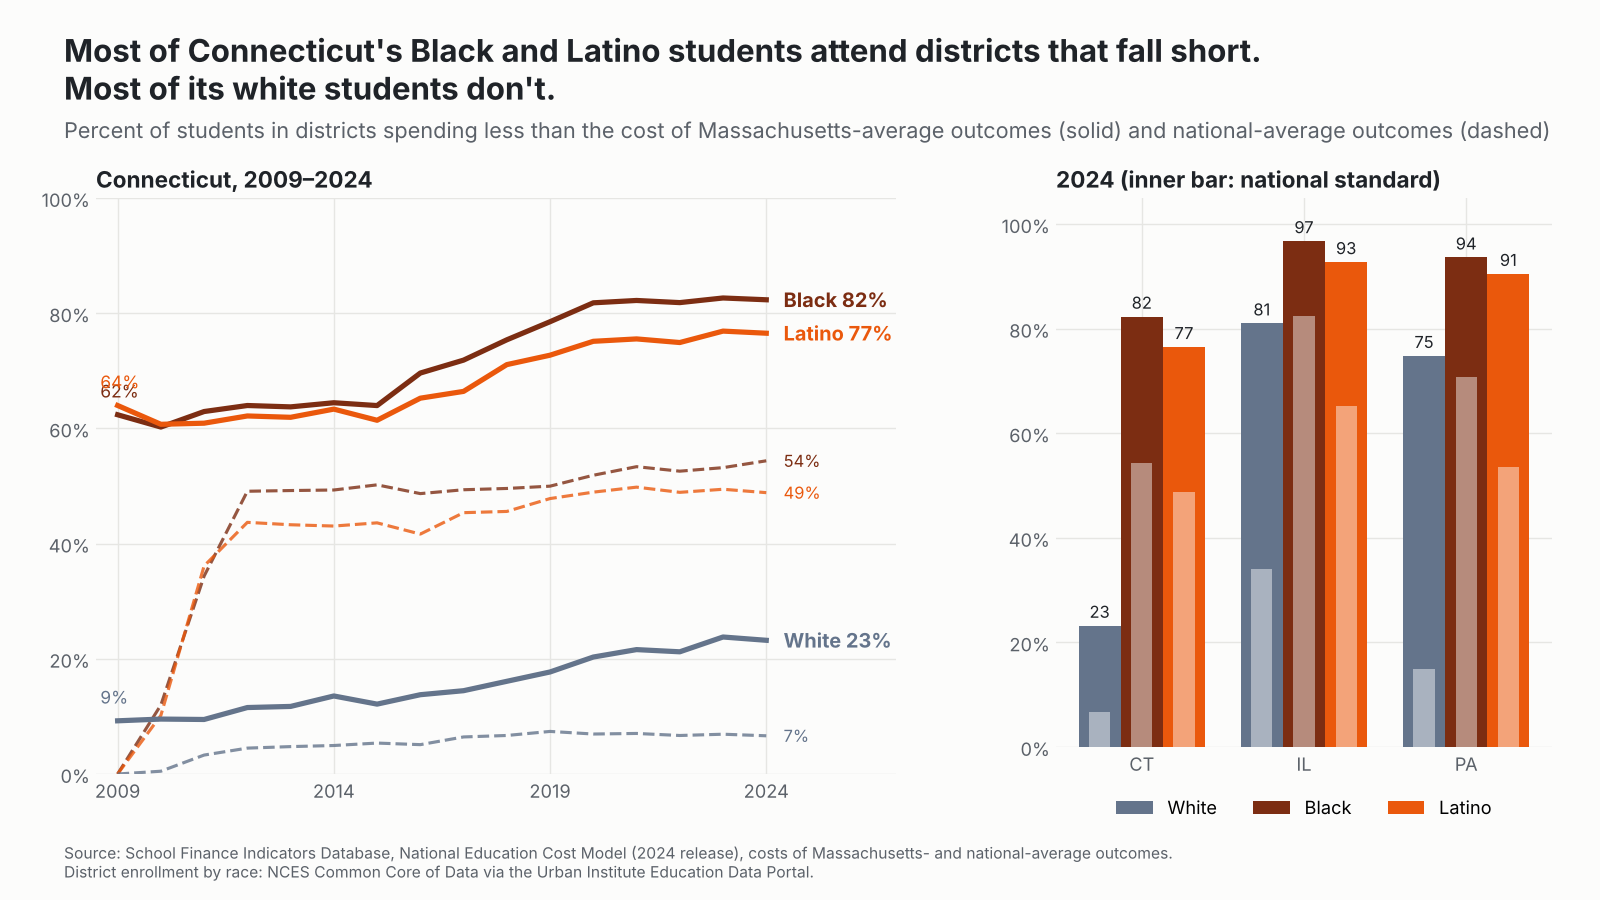
In 2024, 82% of Connecticut’s Black students and 77% of its Latino students attended districts spending less than it would cost to reach Massachusetts-average outcomes. For white students, 23%. In 2009 those figures were 62%, 64% and 9%. Against the national standard, it’s 54% of Black students, 49% of Latino students and 7% of white students, up from essentially zero for all three in 2009.
In one sense Illinois and Pennsylvania look worse: most of their white students fall short too (81% and 75%), because those states spend less overall. Connecticut’s distinction is the gap. Its white students mostly attend districts that can reach the Massachusetts bar; its Black and Latino students mostly do not. That’s a 53- to 59-point racial gap in who gets a real shot at the Massachusetts standard, compared with 16 to 19 points in Pennsylvania and 12 to 16 in Illinois. Against the national standard the racial gap is 42 to 47 points in Connecticut, 39 to 56 in Pennsylvania and 31 to 48 in Illinois. Connecticut’s white students are the least likely in the three states to fall short of either standard (7% national, 23% MA), compared with 15% and 75% in Pennsylvania and 34% and 81% in Illinois.
And the outcomes?
As I’m fond of saying, money isn’t everything, but you can’t do much of anything without it. Connecticut’s 8th-grade NAEP math gap between low-income and other students was 37 points in 2019, the last year before the pandemic, the third largest in the nation. Connecticut posts nice statewide averages because it has a lot of very well-off kids in very well-funded schools. The averages are doing exactly what averages do.
Courts, formulas and good intentions
None of this is a secret in Connecticut. In Sheff v. O’Neill (1996), the Connecticut Supreme Court held that the racial and ethnic isolation of Hartford’s schoolchildren violated the state constitution. Three decades of magnet schools and interdistrict choice followed, which helped some kids and left the underlying finance system intact. Then came CCJEF, where the same court decided that “minimal” was good enough. By that standard, I suppose Bridgeport at 61% of adequate (41% of the Massachusetts standard) is just fine. Good to know. Lawmakers certainly seem to think so.
To its credit, the legislature in 2023 accelerated the phase-in of its Education Cost Sharing formula, with underfunded towns reaching full formula funding in FY2026, after the 2024 data shown here. That’s worth watching. But “full funding” of a formula is only as good as the formula’s targets, and nearly a billion dollars a year (about $3.4 billion against the Massachusetts standard) is a big hole to fill with a phase-in. I’ll update when the 2026 data come in.
Governor Lamont’s commission should start where we started in 2021. Commission a rigorous, independent study of what it costs for every Connecticut child to reach a robust common standard, in 2027. Use it to overhaul or replace ECS in the 2028 session. Begin phasing in the new formula by fall 2028. Then fund it. It has now been 12 years since I first laid out the plight of Connecticut’s majority-Hispanic districts in a report for the Center for American Progress. A whole cohort of kids has gone from first grade to graduation since then.
There’s also a deeper problem that more state aid alone doesn’t fix. As I’ve written elsewhere (Baker, 2025), racial isolation itself raises the cost of providing equal educational opportunity. Connecticut has sorted its students sharply by race along the lines of its 169 towns. Then it funded the isolated districts least.
The bottom line
- Connecticut has the largest racial school funding gap in the nation. Its whitest fifth of students attend districts funded at 201% of adequate; its most Black and Hispanic fifth at 73%. Against the Massachusetts standard: 134% vs. 49%. First in the nation either way.
- Half of Connecticut’s Black and Hispanic students attend underfunded districts. For other students, it’s 9%. Against the Massachusetts standard: 78% vs. 26%.
- Thirteen districts, 124,000 students, about $931 million a year short, and 12 of the 13 are majority Black and Hispanic. Against the Massachusetts standard: 39 districts, 226,000 students, about $3.4 billion short.
- It got worse. In 2009 no Connecticut district was below national adequacy and 16 were below the Massachusetts standard. In 2024: 13 and 39. The real dollar gap between the whitest and most Black and Hispanic districts has roughly doubled under either standard.
- The system went regressive. From one of the more progressive states in the early 2000s to the fourth most regressive in 2024, now worse than Illinois and Pennsylvania.
- Against a Massachusetts bar, 82% of Black and 77% of Latino students attend districts that fall short, against 23% of white students. (National standard: 54%, 49% and 7%.)
- Challenge accepted. The state Supreme Court let Connecticut lawmakers off the hook in 2018. They used the freedom to make things worse for the kids the case was about. If you want one state to show what educational inequality looks like when a wealthy state chooses not to fix it, it’s Connecticut.
Data notes
All finance and adequacy measures come from the School Finance Indicators Database. Adequacy is district current spending per pupil divided by the National Education Cost Model’s estimated cost of national average outcomes (2024 release), aggregated as total spending over total cost (enrollment-weighted). The Massachusetts standard uses the NECM’s cost of Massachusetts-average outcomes, which in this release is a constant 1.4965 times the cost of national-average outcomes in every district. So rankings and ratios between groups are the same under both standards, but percentage-point gaps, counts of districts falling short and dollar shortfalls differ. Race groups divide each state’s students into five equal-sized groups by the combined Black and Hispanic share of their district’s enrollment (NCES Common Core of Data); poverty groups do the same by Census SAIPE child poverty. “Exposure” figures weight each district by its number of Black and Hispanic students, or other students. State rankings include 49 states with enough districts to form groups. Real-dollar comparisons use the CPI-U. Funding progressiveness is the SFID ratio of predicted state and local revenue per pupil at 30% vs. 0% child poverty. NAEP gaps compare students eligible and not eligible for subsidized meals. Shares of white, Black and Latino students below each standard use district enrollment by race (white, Black, Hispanic/Latino) from the NCES Common Core of Data via the Urban Institute Education Data Portal.
Sources
- School Finance Indicators Database: state panel and NECM district file (data behind all figures)
- Baker, B. D. (2025). How and why racial isolation affects education costs and the provision of equal educational opportunity. Education Policy Analysis Archives, 33(55).
- Baker, B. D., Weber, M., & Srikanth, A. (2021). Informing federal school finance policy with empirical evidence. Journal of Education Finance, 47(1), 1–25.
- Baker, B. D. (2026). Connecticut’s Equal Educational Opportunity Problem. School Finance 101 policy brief.
- Baker, B. D., Cotto, R., & Green, P. (2021). Now is the time to fix Connecticut school finance. CT Mirror.
- Urban Institute, Education Data Portal (NCES Common Core of Data, district enrollment by race).
- Sheff v. O’Neill, 238 Conn. 1 (1996).
- Connecticut Supreme Court deals severe blow to education justice, Education Law Center, January 2018 (on CCJEF v. Rell).
- Connecticut State Department of Education, Education Cost Sharing and Choice Grant Legislative Update, FY2024 and FY2025.
- The Red State Miracle That Wasn’t and Red State, Blue State, Round Two, schoolfinance101.


