
Or: two states that pay for public schools, two states that would rather pay for Cave Creek’s private school tuition, and a modest proposal for anyone trying to decide where to raise a kid.
In my last round of this, I lined up the two biggest blue states against the two biggest red states. This time let’s give the voucher crowd the matchup they’ve been begging for. In one corner, New Jersey and Massachusetts, the bloated, overtaxed, union-captured, “throwing money at the problem” hellscapes of the Northeast. You’ve read the op-eds. In the other corner, Arizona and Florida, the shining cities on the hill of “education freedom,” the two states that have gone furthest in turning public school money into private school coupons. Arizona went universal in 2022. Florida followed in 2023. Surely this is where the free market finally delivers.
Same yardstick as always: the National Education Cost Model for adequacy, the Education Comparable Wage Index for spending, state and local school spending relative to the economy for effort, and NAEP for outcomes, 2009 through 2024. Then a look at where the voucher money is going, and where it might have done more good.
Round 1: Adequacy
| All districts, 2009 → 2024 | Highest-poverty fifth, 2009 → 2024 | Students in underfunded districts, 2024 | |
|---|---|---|---|
| New Jersey | 178% → 136% | 139% → 110% | 11% |
| Massachusetts | 174% → 133% | 137% → 109% | 12% |
| Arizona | 87% → 72% | 64% → 64% | 98% |
| Florida | 94% → 70% | 83% → 63% | 98% |
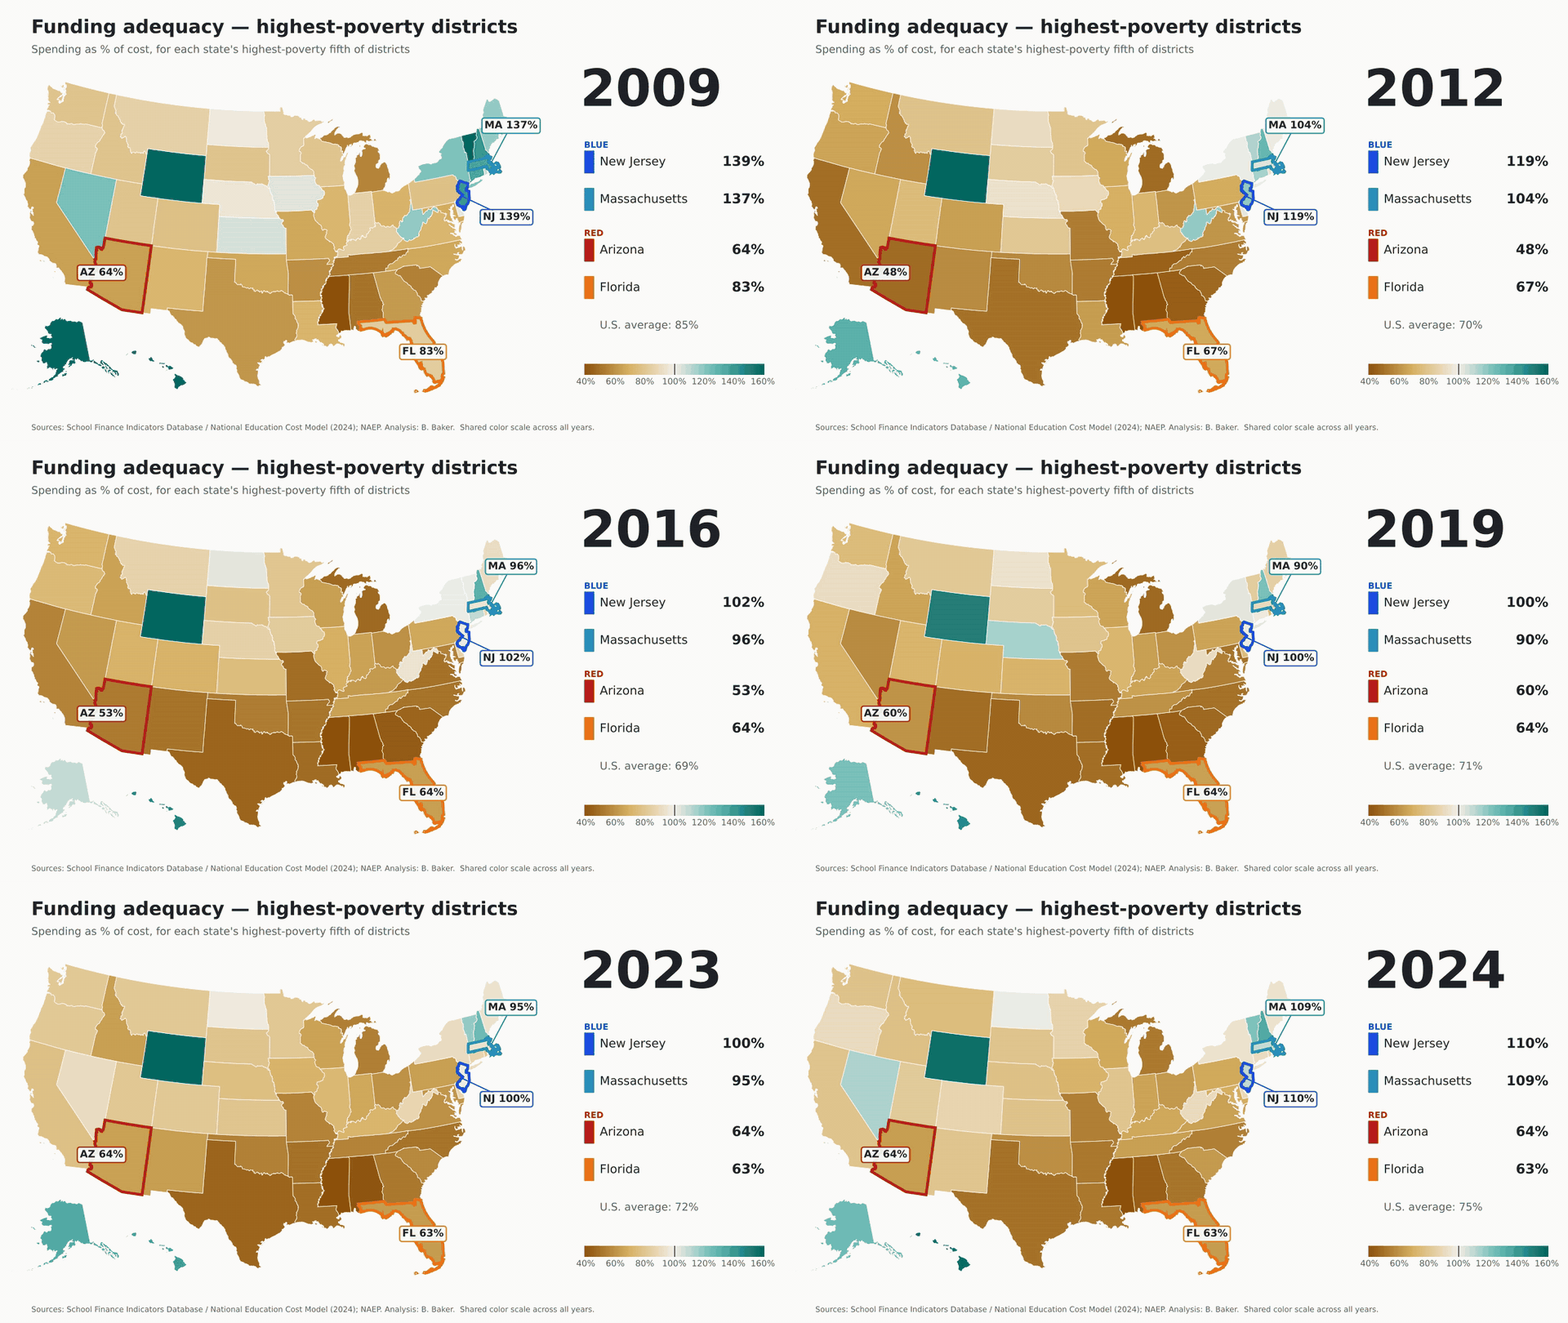
This isn’t close. It isn’t even in the same zip code (and as we’ll see, zip codes matter a lot in Arizona). Even the highest-poverty districts in New Jersey and Massachusetts are funded above the cost of national average outcomes, at 110% and 109%. In Arizona and Florida, the highest-poverty districts sit at 64% and 63%. Ninety-eight percent of students in both red states attend districts funded below adequate levels. In New Jersey and Massachusetts it’s 11% and 12%. But sure, tell me again about the Northeast’s efficiency problem.
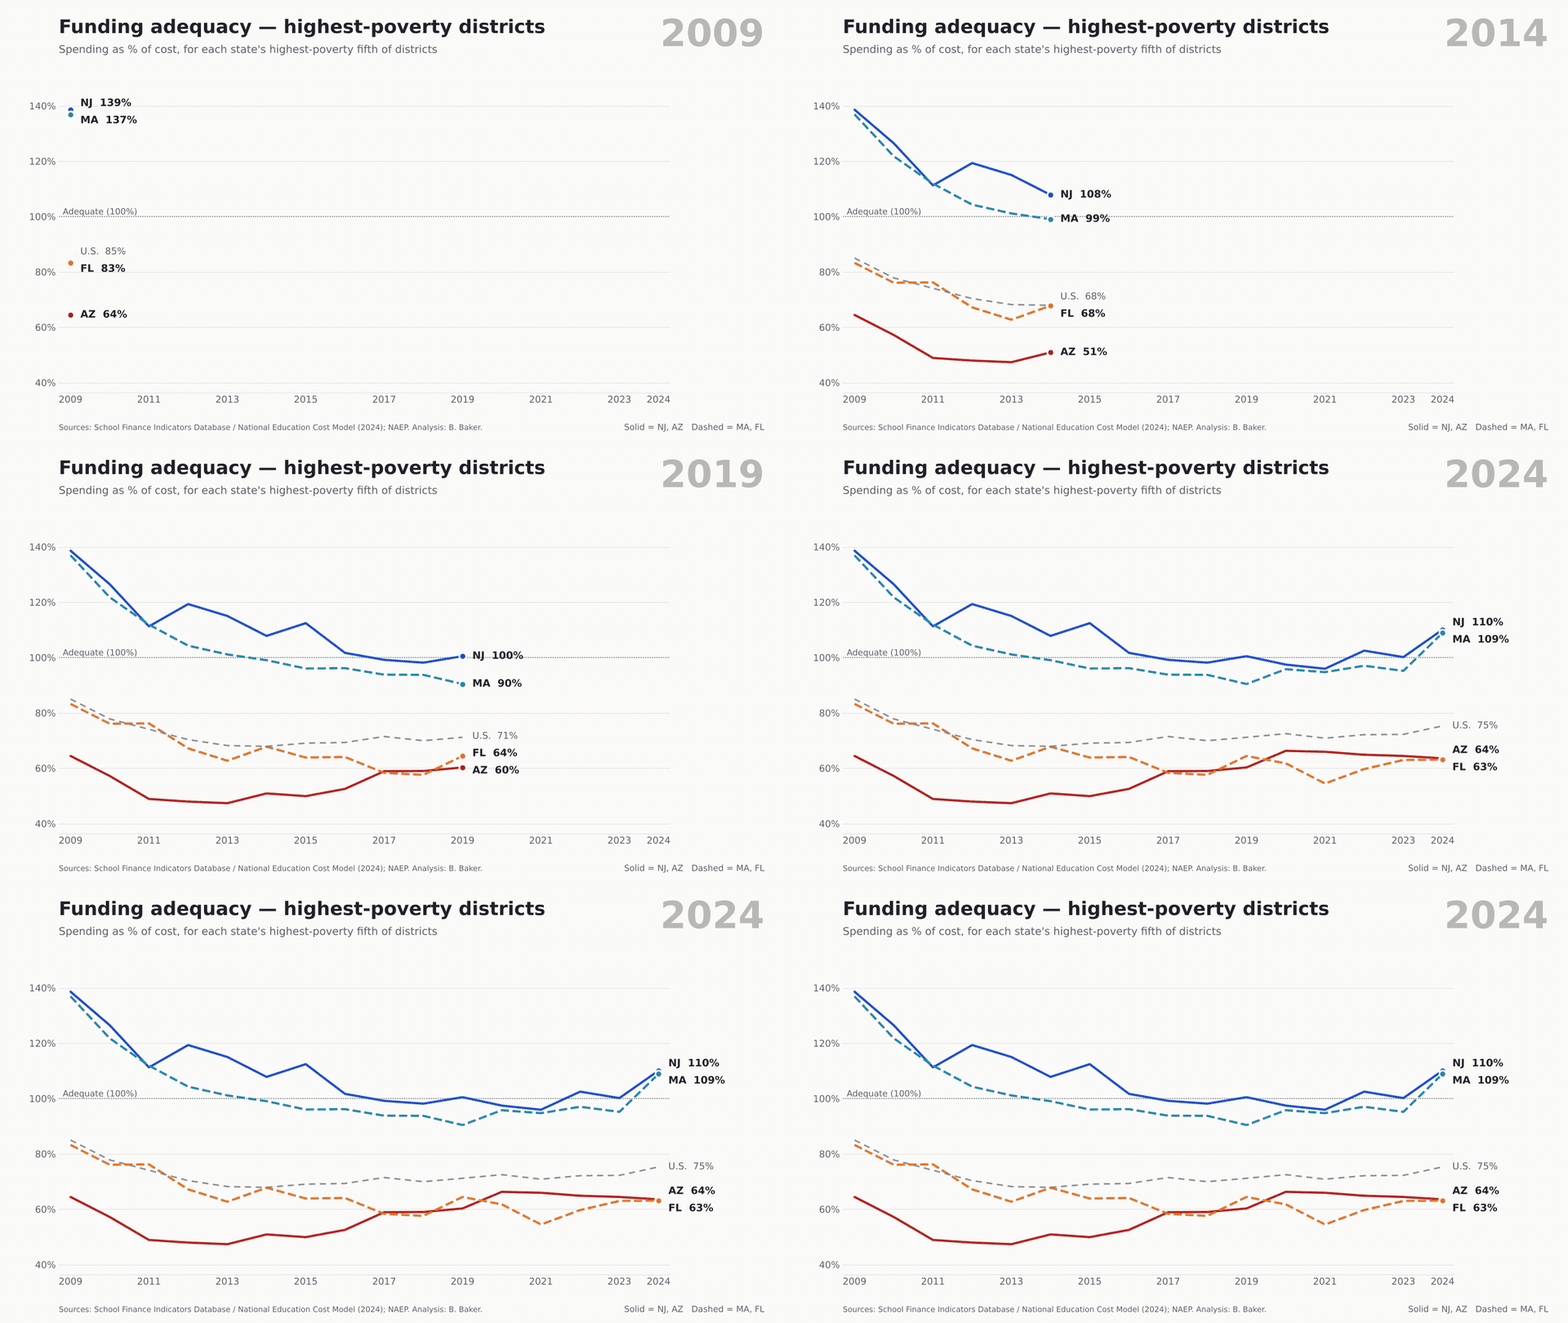
Now, to be fair, New Jersey and Massachusetts slipped too. Both started the period well above adequate everywhere and have drifted down toward the line. But the floor in the blue states is above the ceiling in the red ones.
Round 2: Spending and effort
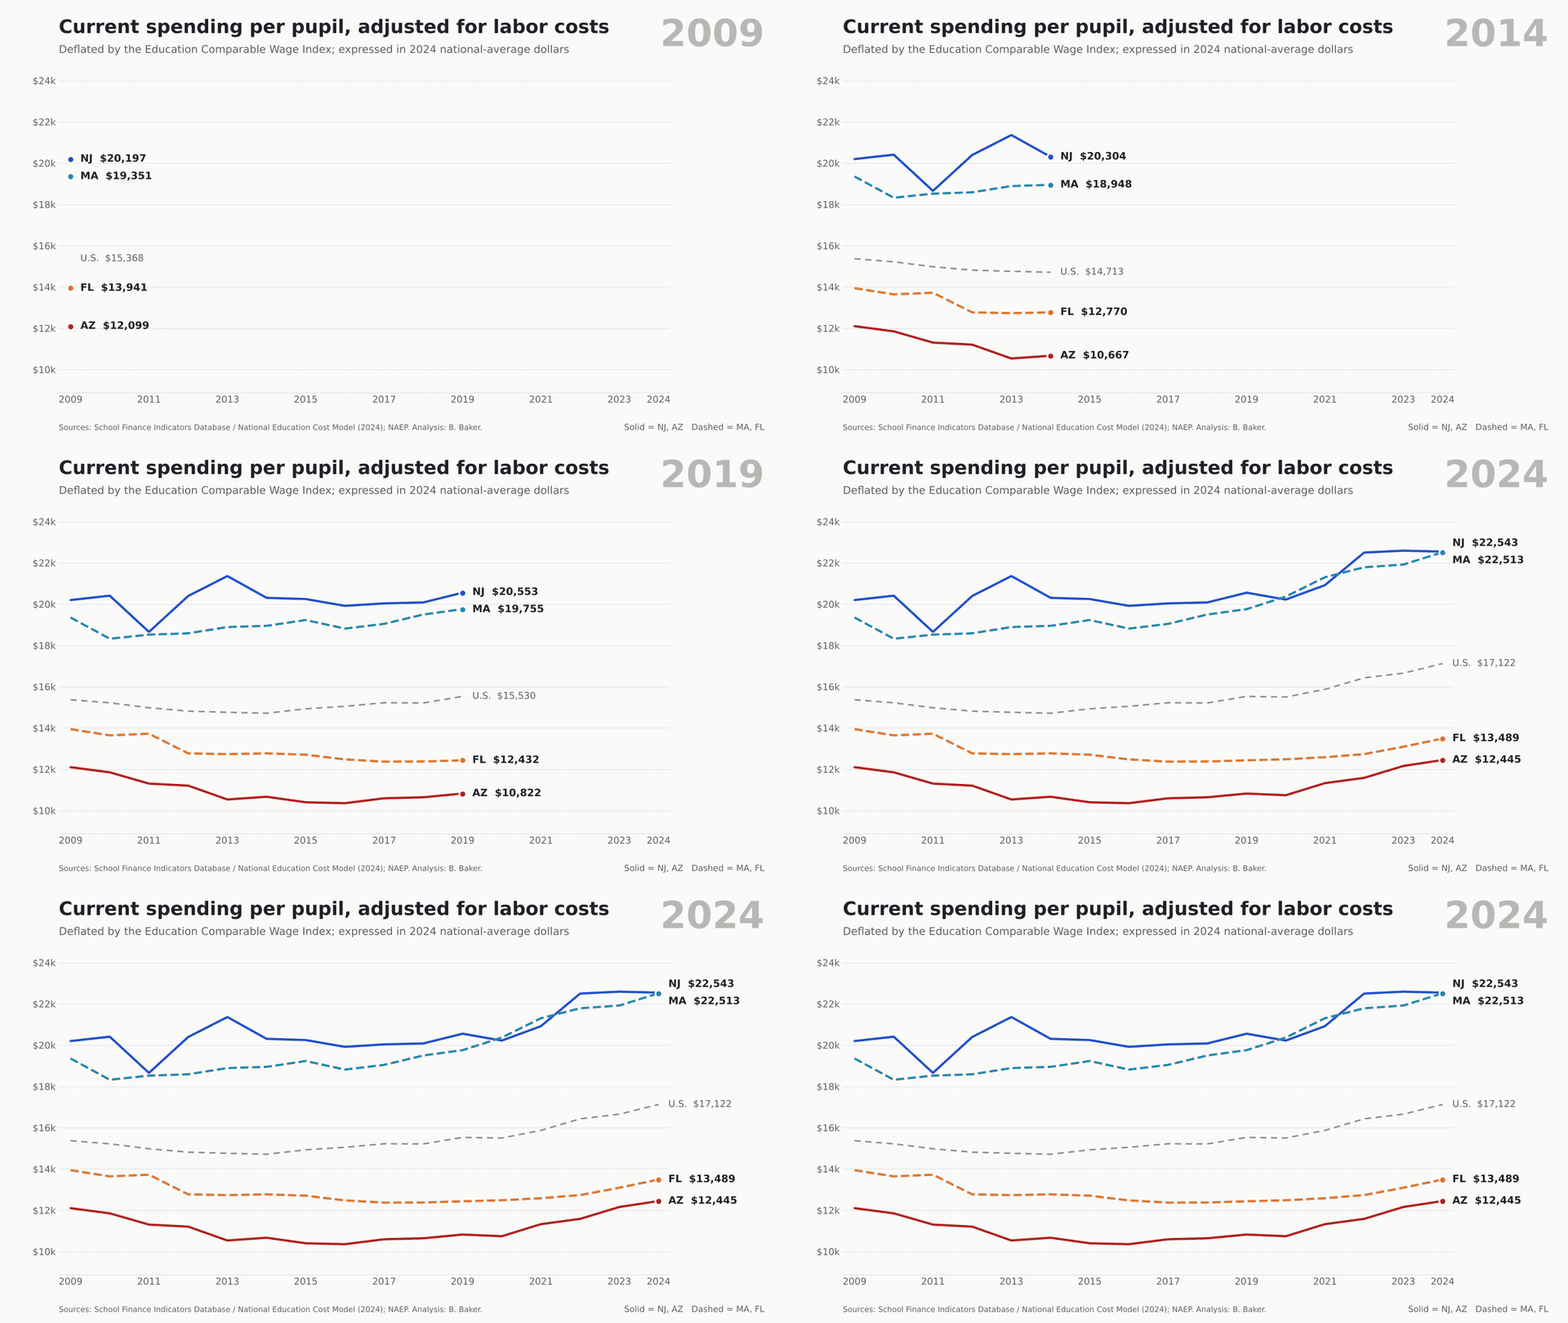
Adjusted for labor costs, New Jersey and Massachusetts each spent about $22,500 per pupil in 2024, up 12% and 16% since 2009. Arizona spent $12,445 (up 3%) and Florida $13,489 (down 3%). The U.S. figure was $17,122. That’s a gap of roughly $9,000 to $10,000 per child, every year, in teacher time the blue states can buy and the red states can’t. Turns out you can’t freedom your way into a chemistry teacher.
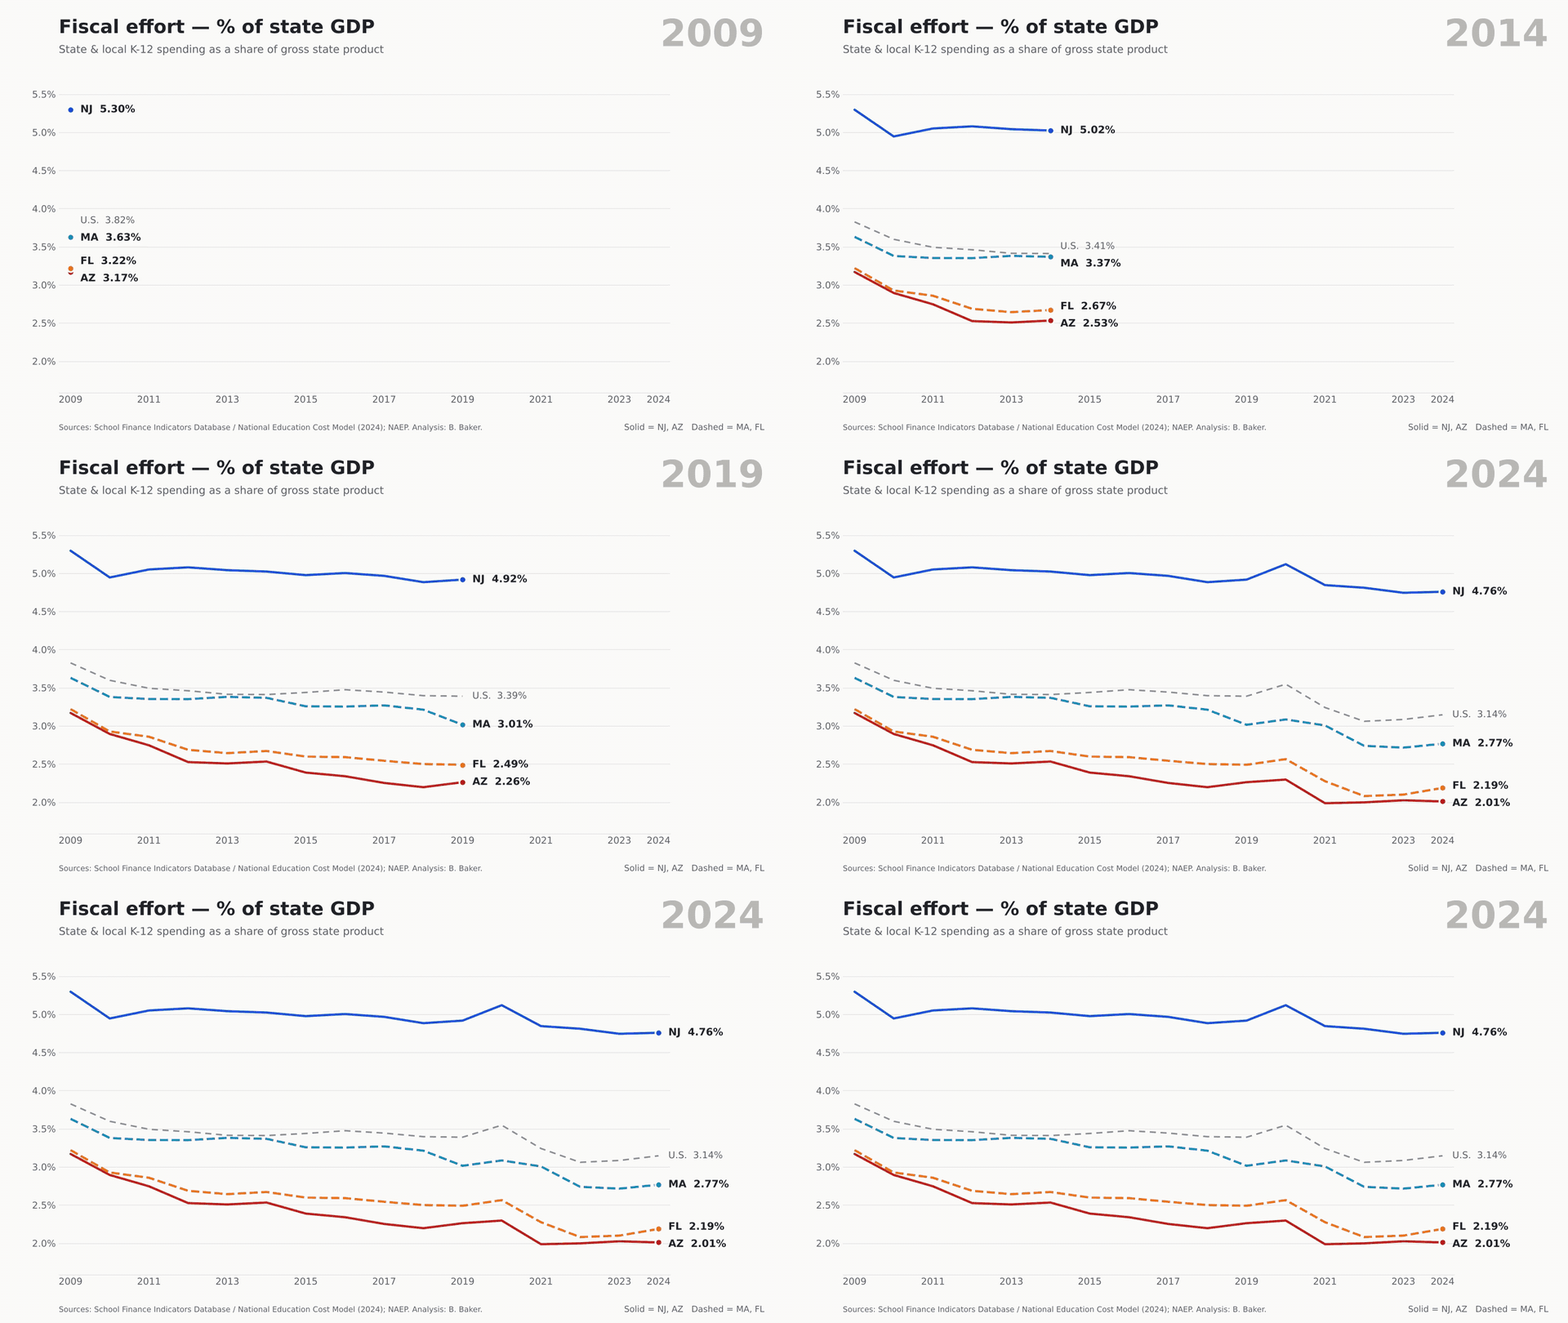
Here’s where nobody looks great. Effort fell in all four states. New Jersey went from 5.3% of GDP to 4.8%, still by far the highest of the four. Massachusetts fell from 3.6% to 2.8%, which should worry folks in Boston more than it seems to. But Arizona (3.2% to 2.0%) and Florida (3.2% to 2.2%) fell furthest and landed lowest. By 2024 Arizona ranked second-lowest in the country on this measure, and Florida third-lowest. And that’s before most of the voucher bills came due.
Round 3: Outcomes
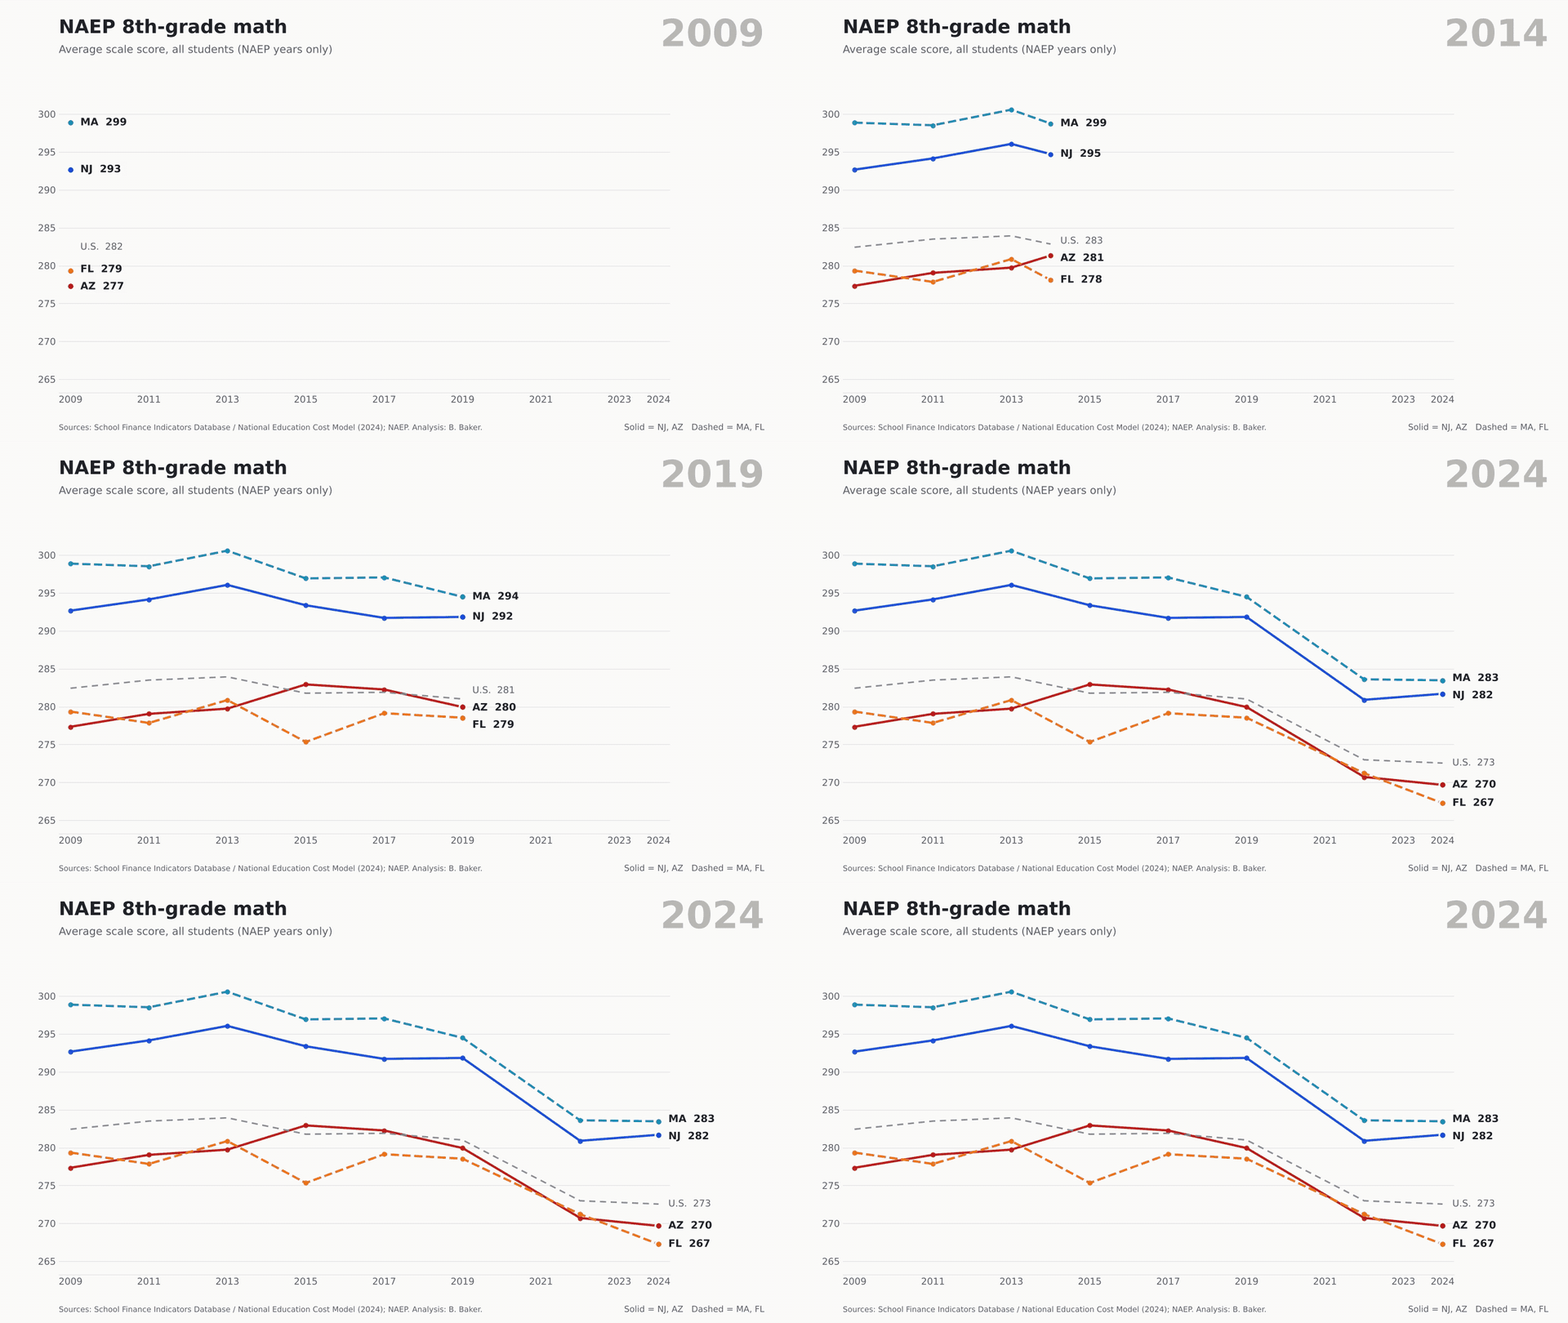
| Math, 2009 → 2024 | Change | Reading, 2009 → 2024 | Change | |
|---|---|---|---|---|
| Massachusetts | 299 → 283 | −15 | 274 → 268 | −6 |
| New Jersey | 293 → 282 | −11 | 273 → 266 | −7 |
| Arizona | 277 → 270 | −8 | 258 → 254 | −3 |
| Florida | 279 → 267 | −12 | 264 → 253 | −12 |
| Average state | 282 → 273 | −10 | 263 → 257 | −6 |
Now, unlike the people who write those op-eds, I’m going to show you the inconvenient numbers too. This round is not a blowout on trends. Massachusetts lost 15 points in 8th-grade math, more than any of the other three. Arizona lost the least in both subjects. Credit where it’s due? Not so fast.
As I’ve been pointing out since at least the great Mis-NAEP-ery of 2013, NAEP gains and losses are highly correlated with where you start. It’s harder to gain, and easier to lose, when you’re already scoring high. It’s easier to gain, and harder to lose, when you’re scoring low. Across the 50 states and D.C., a state’s 2009 8th-grade math score correlates at −0.63 with its change through 2024 (−0.68 in reading). Start 10 points higher and you can expect to lose about 4 more points in math and 5 more in reading. So the fair comparison is against what each state’s starting point predicts. Massachusetts lost 15 points in math, but a state starting at 299 would be expected to lose about 17. New Jersey beat its expected change by about 3 points in math and 4.5 in reading; Massachusetts by about 1 in math and 6 in reading. Arizona landed right about where its low starting point predicted, within half a point in both subjects. Florida did worse than its starting point predicted, by about 3.5 points in math and 4.5 in reading. So Arizona’s “smallest loss” is mostly the luck of starting low. And Florida, which also started low, couldn’t even manage that.
But levels matter. In 2024 New Jersey and Massachusetts still scored 12 to 16 points higher in 8th-grade math than Arizona and Florida, and 12 to 15 points higher in reading. Florida’s 8th-grade reading average fell 12 points, from 264 to 253, landing below Arizona. The Florida Reading Miracle™ appears to have been recalled by the manufacturer.
And a caution I’ll repeat until I’m blue in the face: NAEP 2024 came only a year or two after these states went universal. Nothing here tells you what vouchers did to test scores. For that, we have other research. Lots of it.
Where the voucher money goes
Arizona’s Empowerment Scholarship Account program had about 97,000 students by late 2025, and the governor’s office projected ESA spending would hit about $1 billion in the fiscal year that began July 2025. Florida’s voucher programs cost about $3.9 billion in state funds in 2024–25, about 23% of the state’s public education funding, up from 12% three years earlier.
So who’s getting it?
- Mostly kids who were already in private school. In Florida, 69% of the roughly 123,000 new voucher students in fall 2023 were already enrolled in private school, per Step Up for Students’ own numbers. Only 13% came from public schools. In Arizona, the state’s own superintendent says 80% of new recipients were already in private school or homeschooling when the program expanded. Josh Cowen’s review of nine states finds about 70% of voucher users had never attended public school. That’s not expanding choice. That’s a coupon for a purchase families had already made. Imagine a “school choice” program where the main choice being subsidized is the one people made before the program existed.
- Disproportionately higher-income families. An Associated Press analysis of Arizona ZIP code data found about 11% of school-age children in high-income ZIP codes use ESAs, against about 4% in low-income ZIP codes. Jennifer Jennings’ analysis of Arizona’s second year found the highest take-up in some of the state’s wealthiest districts, about 13% in Cave Creek, 12% in Scottsdale and 10% in Catalina Foothills, places with plenty of highly rated public schools. She calls it a Matthew effect: to those who have, more shall be given. Cave Creek thanks you, Arizona taxpayers. In Florida, once the 2023 law lifted income limits, 56% of new private-school voucher recipients came from households above 185% of the poverty line or didn’t report income, including 27% above 400% of poverty or unreported.
- Higher tuition. When you hand families a few thousand dollars earmarked for private school, private schools notice. The Hechinger Report found that of 55 Arizona private schools that posted rates, nearly all raised prices after 2022, about half by 10% or more in at least some grades, against inflation of about 6%. Nationally, Douglas Harris and Gabriel Olivier find private school tuition rose 5% to 10% more in states that expanded vouchers than in states that didn’t, with the largest increases at lower-priced, non-religious schools. Some share of every voucher dollar simply evaporates into higher sticker prices. The free market works! Just not for you.
And the kids who do switch?
This is where I’d point you to Josh Cowen’s work, including his recent book The Privateers (Harvard Education Press, 2024). Cowen spent two decades evaluating voucher programs, including as part of the official evaluation team for Milwaukee’s voucher program, and he’s now firmly opposed. The reason is the evidence. The large statewide programs studied in the last decade, in Louisiana, Indiana, Ohio and Washington, D.C., have produced academic losses for students who used vouchers to leave public schools. In Louisiana, Abdulkadiroğlu, Pathak and Walters found math scores fell by about 0.4 standard deviations after one year. Cowen notes these losses rival or exceed what we saw after Hurricane Katrina and during COVID. Add high attrition among the most disadvantaged voucher users and frequent private school closures (41% of participating schools in Milwaukee eventually closed), and you have a policy that’s costly, regressive and, on the evidence, educationally harmful for the kids it claims to rescue. Other than that, Mrs. Lincoln, how was the play?
What that money could have done
Here’s the question I actually care about. What if Arizona and Florida had put that money into the high-poverty public districts the cost model says are most underfunded?
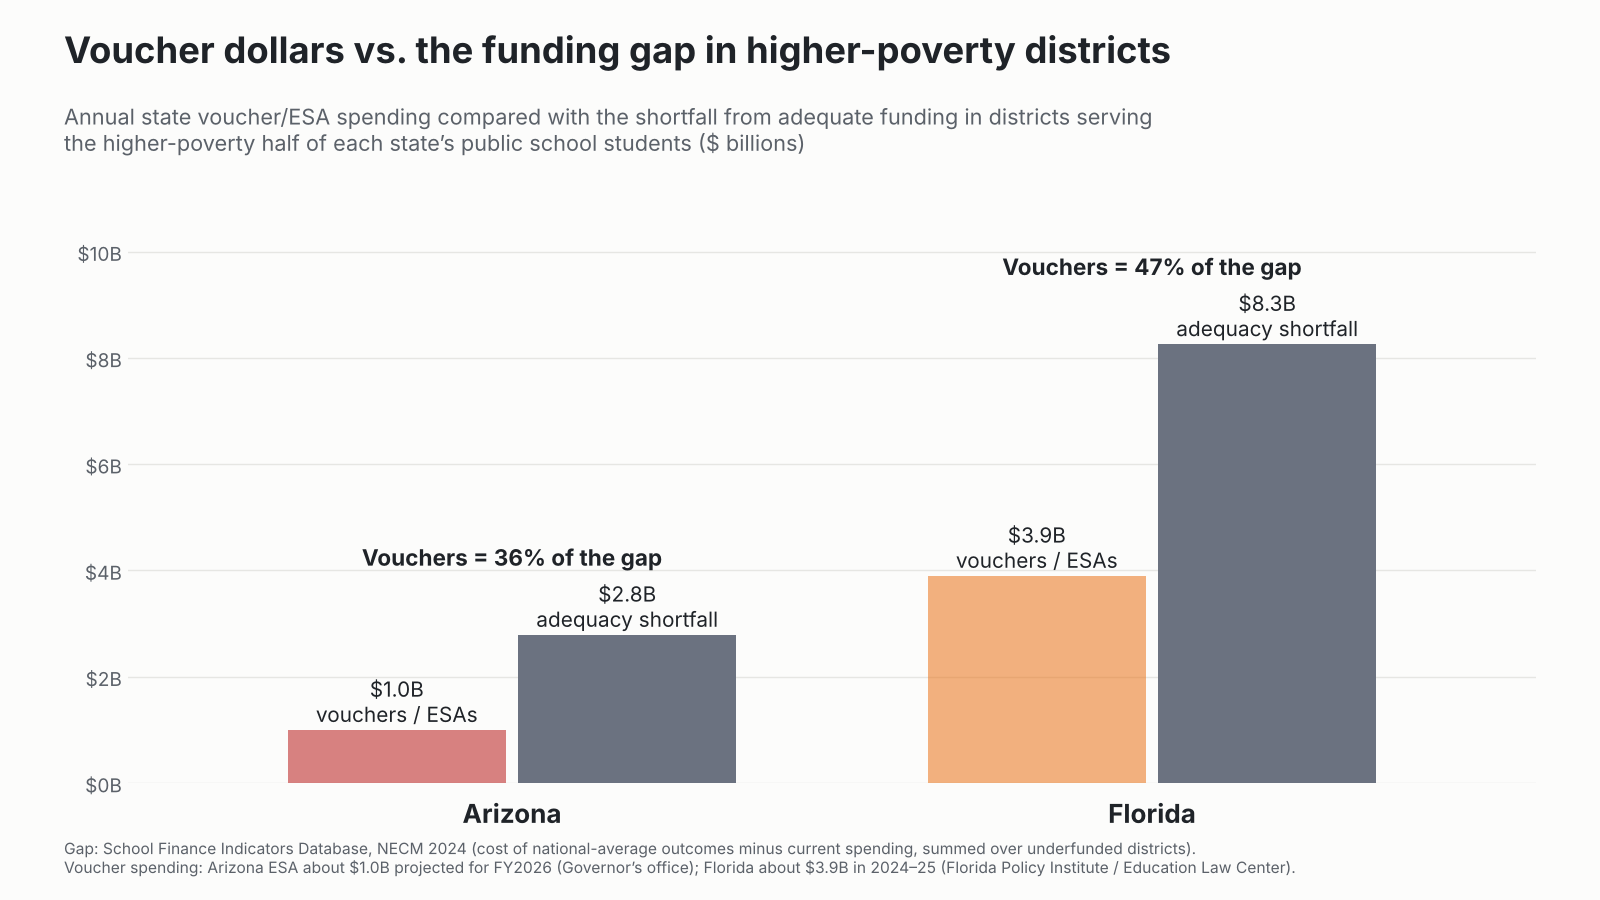
Take the districts serving the higher-poverty half of each state’s public school students. In 2024 those districts in Arizona were about $2.8 billion short of what the cost model says it would take to reach national average outcomes. Arizona’s ESA program now costs about a billion dollars a year, or roughly 36% of that gap. In Florida the shortfall in the higher-poverty half was about $8.3 billion, and voucher spending of $3.9 billion would cover nearly half of it. Statewide, Florida’s total adequacy shortfall was about $15.7 billion; Arizona’s about $4.2 billion. Annually.
Would that money have done more good in those districts? The best recent evidence says yes, and by a lot. Emily Rauscher and Yifan Shen find that the returns to school spending are highest in places with low prior investment and high child poverty, and essentially null elsewhere. Their title says it plainly: progressive spending is efficient. In other words, targeting money to underfunded, high-poverty districts isn’t just the fair thing to do, it’s the efficient thing to do. In follow-up work with Greer Mellon, Susanna Loeb and Carolyn Abott, Rauscher and colleagues find returns to spending are significantly larger in low-resource districts, including for Black, Latinx and low-income students, with teacher salaries and counselors standing out as especially productive uses.
So compare the two bets. Bet one: send money to the districts with the lowest prior investment and highest need, where the research says each dollar has the highest return. Bet two: send money mostly to families already paying private tuition, disproportionately in affluent places, a chunk of which is absorbed by tuition increases, and for the kids who do switch, accept the risk of the large negative effects found in Louisiana, Indiana, Ohio and D.C. That’s not a close call. It’s not even a call. It’s a dial tone. As I’ve argued before, Arizona and Florida are very good at being efficiently mediocre. Vouchers are a way of spending more to be less efficient, which takes a special kind of talent.
So where would you rather raise a kid?
Let’s zoom out. Schools aren’t the only thing a state does for kids and families, and families with options don’t pick a state by NAEP alone. So here’s a broader scorecard. Some of these measures come from other folks’ rankings, and you can quibble with any one of them. Good luck quibbling with all of them.
| New Jersey | Massachusetts | Arizona | Florida | |
|---|---|---|---|---|
| Public education | ||||
| Adequacy, highest-poverty districts (2024) | 110% | 109% | 64% | 63% |
| Adjusted spending per pupil (2024) | $22,543 | $22,513 | $12,445 | $13,489 |
| NAEP 8th-grade math (2024) | 282 | 283 | 270 | 267 |
| State pre-K: share of 4-year-olds served, state $ per child (2024–25) | 35% (21st); $18,848 (2nd) | 30% (25th); $3,046 (43rd) | 2% (last); $8,723 | 63% (7th); $2,946 (44th) |
| Children’s well-being and services | ||||
| KIDS COUNT overall rank (2026) | 6th (1st in education) | 2nd | 40th (50th in education) | 35th |
| State paid family & medical leave | Yes, up to 12 weeks | Yes, up to 12 weeks | No | No |
| Children’s health | ||||
| Uninsured children (2024) | 4.7% (21st) | 2.1% (1st) | 9.3% (49th) | 8.5% (45th) |
| Medicaid expansion | Yes | Yes | Yes | No |
| Women’s health | ||||
| Women’s health & reproductive care rank (2024) | 19th | 1st | 44th | 39th |
| Abortion access | Protected | Protected | Protected to viability (Prop 139, 2024) | Banned after 6 weeks |
| Quality of life, arts and culture | ||||
| Life expectancy at birth (2022) | 79.6 (3rd) | 79.8 (2nd) | 76.7 (30th) | 77.9 (19th) |
| State arts agency funding per capita (FY2026) | $3.73 (7th) | $3.78 (6th) | $0.26 (47th) | $1.71 (19th) |
| Arts & culture share of state GDP (2023) | 3.6% (11th) | 4.0% (6th) | 3.0% (19th) | 3.2% (17th) |
| Safety and public health | ||||
| Firearm deaths per 100,000 (2023) | 4.6 (2nd lowest) | 3.9 (lowest) | 19.1 (38th) | 14.4 (25th) |
| Violent crime per 100,000 (2024) | 218 | 315 | 422 | 267 |
| Measles cases, 2026 (through early October) | 3 | 2 | 36 | 67 |
| Kindergartners with vaccine exemptions (2025–26) | 5.7% | 1.8% | 10.6% | 5.9% |
A few things jump out. Arizona has the worst rate of uninsured children of the four, second-worst in the nation behind only Texas, and serves 2% of four-year-olds in state pre-K. Two percent. Florida, to its credit, reaches a lot of four-year-olds with its pre-K program, then spends about $2,946 per child on it, which buys roughly what you’d expect $2,946 to buy. Florida also never expanded Medicaid, bans abortion after six weeks, a point at which many people don’t yet know they’re pregnant, and ranks 39th in women’s health. Arizona voters, to their credit, restored abortion rights to viability in 2024, which is a big part of why I wouldn’t lump the two red states together on every line. Neither offers paid family leave. Both New Jersey and Massachusetts do. (And before anyone in Boston gets smug: Massachusetts spends about $3,046 per child on state pre-K, 43rd in the nation, right down there with Florida. New Jersey spends $18,848, second only to D.C. Not all blue states are created equal.)
And then there’s arts and culture. Massachusetts and New Jersey fund their state arts agencies at about $3.75 per resident. Arizona manages 26 cents. Florida was at least in the middle of the pack, until Governor DeSantis vetoed roughly $32 million in arts and culture grants in 2024, later explaining that a fringe theater festival was “an inappropriate use of taxpayer dollars.” Nothing says “family-friendly” like zeroing out the state’s arts grants because of a festival you didn’t want to attend. (Private school tuition at Cave Creek’s finest, on the other hand, is apparently an appropriate use of taxpayer dollars.)
Then there’s the matter of whether your kid makes it home. Arizona’s firearm death rate is nearly five times Massachusetts’; Florida’s is more than three times. Arizona also has the highest violent crime rate of the four. In fairness (I keep doing that, it’s a character flaw), Massachusetts’ violent crime rate runs higher than Florida’s, and New Jersey’s is the lowest of the bunch. But on guns, it’s not close.
And then measles, a disease the United States declared eliminated in 2000. So far in 2026, Florida has logged 67 cases and Arizona 36. New Jersey has 3. Massachusetts has 2. Arizona now exempts 10.6% of its kindergartners from school vaccine requirements. Florida’s surgeon general has been campaigning to end school vaccine mandates altogether. The legislature hasn’t gone along, yet, but the state’s kindergarten vaccination completion rate has already slid to 88.9%. Nothing says “family values” like a measles outbreak in the kindergarten wing.
a) Where to raise a child
If you’re picking a place to raise a kid, this isn’t a hard call. Massachusetts and New Jersey offer adequately funded public schools even in their poorest districts, near-universal children’s health coverage, paid leave when the baby arrives, protected reproductive health care for the mother, longer life expectancies, and a public sector that thinks the arts are worth a few bucks per resident. Arizona and Florida offer lower taxes, sunshine, schools funded at about two-thirds of adequate if you’re poor, roughly a 1-in-11 chance your kid is uninsured, three to five times the firearm death rate, a front-row seat to the measles comeback, and a voucher if you were already paying private school tuition. Pick your poison. Actually, don’t. Pick Massachusetts or New Jersey.
b) Where to recruit young, educated families
Now put on your HR hat. You’re trying to recruit a 32-year-old engineer with a spouse, a toddler and another on the way. Housing will cost them more in Boston or northern New Jersey than in Phoenix or Tampa, and their tax bill will be higher. That’s real, and I won’t pretend otherwise. But here’s what that money buys: a public school they don’t have to flee, twelve weeks of paid leave, pediatric coverage that isn’t a coin flip, classmates who are vaccinated, an OB-GYN who doesn’t have to consult a lawyer before treating a miscarriage, and a cultural life that isn’t subject to gubernatorial veto. Families who can choose, choose that. The ones you’re trying to recruit can choose.
But wait, says the Florida recruiter, our engineer doesn’t need the public schools. He can use the voucher! Let’s do the math. Say our family makes $200,000 a year and has two kids, and they want the full Florida elite-private experience. Ransom Everglades in Miami runs $57,300 a year. Times two, that’s $114,600. Florida’s now-universal scholarship averages roughly $8,000 per student, so knock off about $16,000. That leaves about $98,600 a year, out of pocket, in after-tax dollars.
Now, what does Florida save that family by not having an income tax? In New Jersey, $200,000 of joint income with two kids runs about $8,400 in state income tax. In Massachusetts, it’s about $9,500 at the flat 5% rate (a bit less after the state’s child credit). And that’s before the federal SALT deduction gives some of it back. So the family “saves” about $9,000 a year in Florida, plus $16,000 in vouchers. Call it $25,000 in Florida perks to put toward a $114,600 tuition bill. In New Jersey or Massachusetts, the same family sends both kids to a public school funded at better than 130% of adequate (and still above 100% even in the highest-poverty districts), and pays $0 in tuition. Even if you go modest, at a $30,000-a-year private school, the Florida family is out about $44,000 a year after the voucher, five times the income tax it “saved.” Yes, New Jersey property taxes are steep. Part of what they buy is a school you don’t have to pay $57,300 to escape. The low-tax Florida deal works beautifully for one family: the one that was already going to pay private tuition anyway, and now gets $16,000 back from the state for doing it.
Arizona and Florida are betting that young professionals will trade all of that for lower taxes and a voucher. Some will. But the rest are going to look at those uninsured-kid numbers, those gun death rates, those adequacy numbers in the districts they can afford to live in, and that six-week ban, and quietly accept the offer from the firm in Cambridge.
The bottom line
- The blue states fund adequacy. The red states don’t. Highest-poverty districts: about 110% of adequate in NJ and MA, about 63–64% in AZ and FL. 98% of AZ and FL students attend underfunded districts.
- About $9,000–10,000 more per pupil in the blue states, adjusted for labor costs. Arizona and Florida rank 2nd- and 3rd-lowest in the nation on effort.
- Outcomes: everyone lost ground after 2019. Raw losses were largest in Massachusetts math and smallest in Arizona, but NAEP changes track starting levels. Measured against what their 2009 scores predicted, New Jersey and Massachusetts did better than expected, Arizona did about as expected, and Florida did worse. The blue states still lead by 12–16 points. Florida’s reading miracle is over.
- Vouchers: billions a year, mostly to families already in private school, disproportionately affluent, partly eaten by tuition hikes, with large negative effects in the best studies of statewide programs.
- Opportunity cost: the same money in underfunded high-poverty districts would likely have bought far more, per Rauscher’s work on progressive spending.
- Beyond schools: on children’s health, women’s health, paid leave, life expectancy, gun deaths, measles, and arts and culture, Massachusetts and New Jersey come out ahead. (Violent crime is the one place Florida edges Massachusetts.) Arizona is the clear laggard on kids’ coverage and pre-K; Florida on reproductive health and Medicaid.
Arizona and Florida chose to spend billions on private tuition while leaving their highest-poverty public districts at two-thirds of adequate, their kids under-insured and their arts councils on a diet. That’s a choice. It’s not an efficient one, it’s not a family-friendly one, and it’s certainly not a miracle.
Data notes
Finance measures are from the School Finance Indicators Database. Adequacy uses the National Education Cost Model (2024 release): current spending per pupil divided by the modeled cost of national average outcomes, aggregated to states as total spending over total cost (enrollment-weighted). Highest- and lowest-poverty districts are the top and bottom fifths of each state’s districts by Census child poverty. Adequacy shortfalls sum enrollment times the gap between cost and spending across underfunded districts; the “higher-poverty half” is the set of districts serving the half of public school students in the highest-poverty districts. Labor-cost adjusted spending divides by the Education Comparable Wage Index, rescaled to 2024 national-average wage levels. Effort is state and local K-12 spending as a share of gross state product. NAEP figures are 8th-grade state averages for all students in test years. Expected NAEP changes come from a simple cross-state regression (50 states and DC) of each state’s 2009–2024 change on its 2009 level; “better or worse than expected” is the residual from that regression. Voucher cost and enrollment figures come from the sources linked in the text, and reported figures differ somewhat by source and year.
Sources
- School Finance Indicators Database: state panel and NECM district file
- Baker, B. D., Weber, M., & Srikanth, A. (2021). Informing federal school finance policy with empirical evidence. Journal of Education Finance, 47(1), 1–25.
- Baker, B. D. (2025). How and why racial isolation affects education costs and the provision of equal educational opportunity. Education Policy Analysis Archives, 33(55).
- A few quick thoughts and graphs on Mis-NAEP-ery (2013), schoolfinance101
- Rauscher, E., & Shen, Y. (2022). Variation in the Relationship between School Spending and Achievement: Progressive Spending Is Efficient. EdWorkingPaper 22-593.
- Rauscher, E., Mellon, G., Loeb, S., & Abott, C. (2024). When Money Matters Most: Unpacking the Effectiveness of School Spending. EdWorkingPaper 24-1016.
- Cowen, J. (2024). The Privateers: How Billionaires Created a Culture War and Sold School Vouchers. Harvard Education Press. See also Quick Hits of Voucher Research and “After two decades of studying voucher programs, I’m now firmly opposed to them” (Hechinger Report).
- Abdulkadiroğlu, A., Pathak, P., & Walters, C. (2018). Free to Choose: Can School Choice Reduce Student Achievement? American Economic Journal: Applied Economics, 10(1).
- Jennings, J. Arizona’s school vouchers are helping the wealthy and are widening educational opportunity gaps. Arizona Mirror, January 2024.
- Harris, D., & Olivier, G. (2025). The Effects of Universal School Vouchers on Private School Tuition and Enrollment: A National Analysis.
- Arizona gave families public money for private schools. Then private schools raised tuition. Hechinger Report, November 2023.
- AP analysis of Arizona ESA use by ZIP code income, KTAR, June 2026; ESA program cost dispute, KTAR, November 2025.
- Arizona governor releases budget update amid ‘dramatic spike’ in ESA spending, KOLD, March 2025.
- Florida private education vouchers cost $4 billion this school year, Education Law Center, January 2025; Florida’s growing school voucher program has a high price tag, WUSF, January 2025.
- New report shows nearly 123,000 new students received Florida school vouchers in 2023, NBC Miami / News Service of Florida, September 2023.
- NIEER, State of Preschool 2025: Florida, Arizona, New Jersey and Massachusetts releases.
- Annie E. Casey Foundation, 2026 KIDS COUNT Data Book: Arizona, Florida, national coverage.
- America’s Health Rankings, uninsured children (ACS 2024).
- Commonwealth Fund, 2024 State Scorecard on Women’s Health and Reproductive Care.
- Arizona Proposition 139 (2024); Florida Amendment 4 (2024).
- AARP, state paid family leave laws.
- CDC/NCHS, U.S. State Life Tables, 2022.
- NASAA, FY2026 State Arts Agency Revenues; BEA, Arts and Cultural Production Satellite Account, 2023.
- The Art Newspaper and Fox 4 on Florida’s 2024 arts veto.
- Tuition: Ransom Everglades School, 2026–27. Florida FTC/FES-EO average award: Step Up For Students, 2025–26. State income tax at $200,000 joint income with two dependents: author’s calculation from 2025 New Jersey brackets and the 5% Massachusetts rate with Massachusetts exemptions.
- America’s Health Rankings (CDC WONDER), firearm deaths, 2023.
- FBI Uniform Crime Reports, 2024, as compiled in violent crime rates by state.
- CDC, measles cases and outbreaks, and Johns Hopkins state measles tracking, as of October 8, 2026.
- KFF, vaccination exemption rates among kindergartners; Jax Today on Florida’s mandate push.


