School funding is set in state capitols, and governors write the first draft. Over three decades of school finance data, states’ standing on how hard they try to fund schools rose and fell with the people they elected.
Public schooling is, in most states, the largest single expense and responsibility of state government. It is also the only state function with consistent constitutional standing as a positive right: every state constitution obligates the state to provide a system of public schools. So we can reasonably judge state political leaders by how well they do on public education.
This post uses the School Finance Indicators Database to rank the 48 contiguous states on spending, fairness, effort, wages, adequacy and outcomes in 2024. It then asks a narrower question: in each state, whose watch saw the steepest drop in fiscal effort for schools?
Where states stand in 2024
Democratic-leaning states average an overall rank of about 18th; Republican-leaning states average about 28th. I ranked states on seven groups of indicators: (a) wage-adjusted current spending per pupil, (b) progressiveness of spending and of state and local revenue, (c) fiscal effort, (d) teacher wage competitiveness, (e) adequacy overall and in high-poverty districts, (f) equal opportunity, and (g) NAEP outcomes adjusted for family income and for starting point.
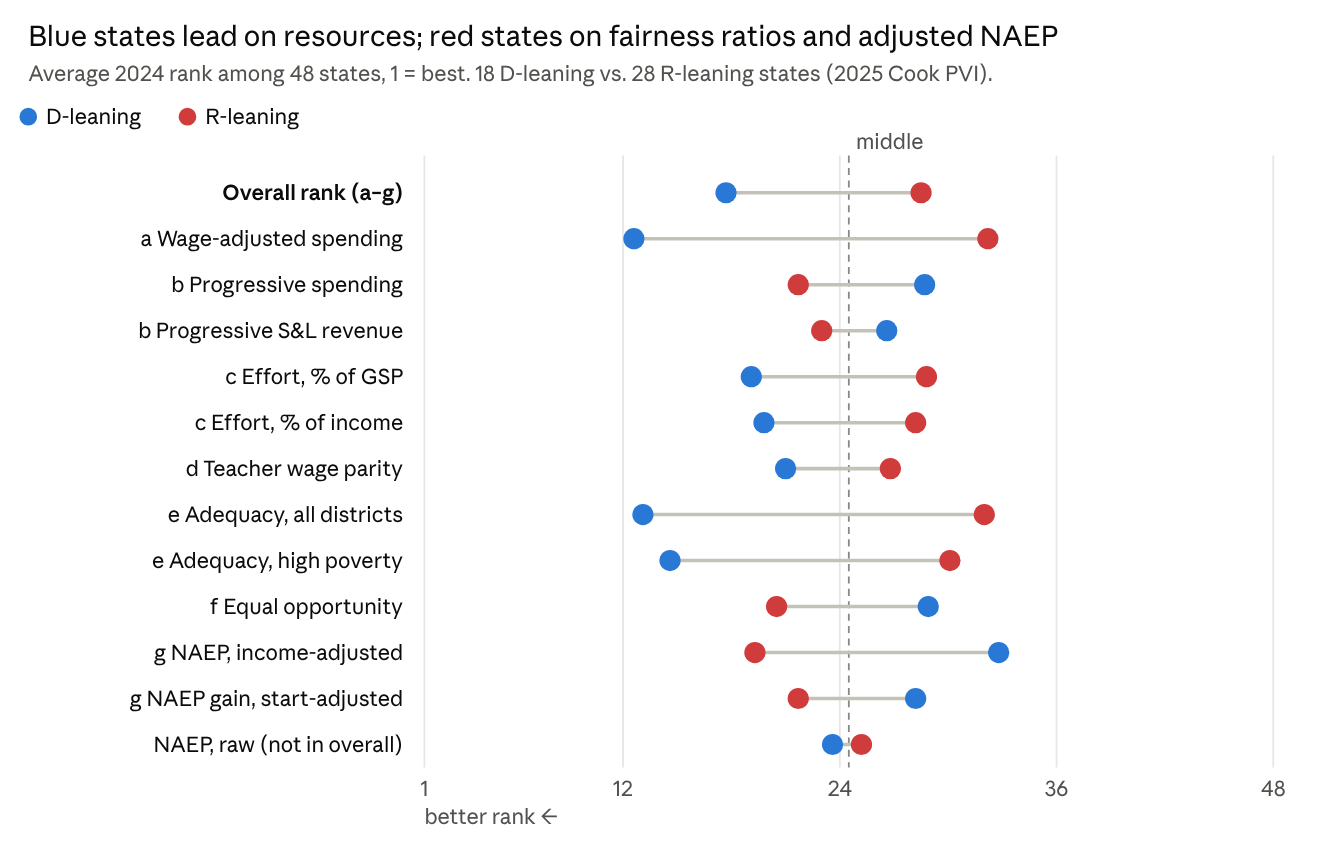
The split is not one-sided. Blue states lead by wide margins on spending, effort, wages and adequacy, including adequacy in the highest-poverty districts. Red states rank better on the progressiveness ratios and on equal opportunity, but much of that edge comes from underfunding low-poverty districts too: median adequacy in their lowest-poverty quintile is 0.88, against 1.25 in blue states. Red states also do better on income-adjusted NAEP levels and on NAEP gains since 2003, led by Mississippi, Tennessee and Louisiana.
Why effort is the place to look
Effort is the indicator elected leaders control most directly. It measures how much of a state’s economy goes to its schools: state and local education spending as a share of gross state product, and state and local revenue as a share of personal income. In 2024 the 48 states ranged from 2.2% to 5.6% of personal income, with a median of 3.6%.
Effort is not destiny, but it sets the ceiling. Across states in 2024, effort as a share of income correlates at 0.66 with wage-adjusted spending per pupil and at 0.45 with overall adequacy. It correlates only 0.22 with adequacy in the highest-poverty districts, because how a state distributes its money matters as much as how much it raises. Still, a state that lets effort slide has few ways to keep spending, wages and adequacy from sliding with it.
Effort is also a choice in a way that spending levels are not. A wealthy state can spend a lot while trying little; a poor state can try hard and still spend little. Effort asks what a state chooses to do with what it has, and that choice runs through governors’ budgets and the tax policy they sign.
Whose watch saw effort fall
In 16 states, effort rank fell 13 or more places across a single governor’s budgets, and 13 of those 16 governors were Republicans. I credited each year’s change to the governor in office when that year’s budget was adopted. I used rank, not raw effort, because recessions and booms move every state’s effort at once.
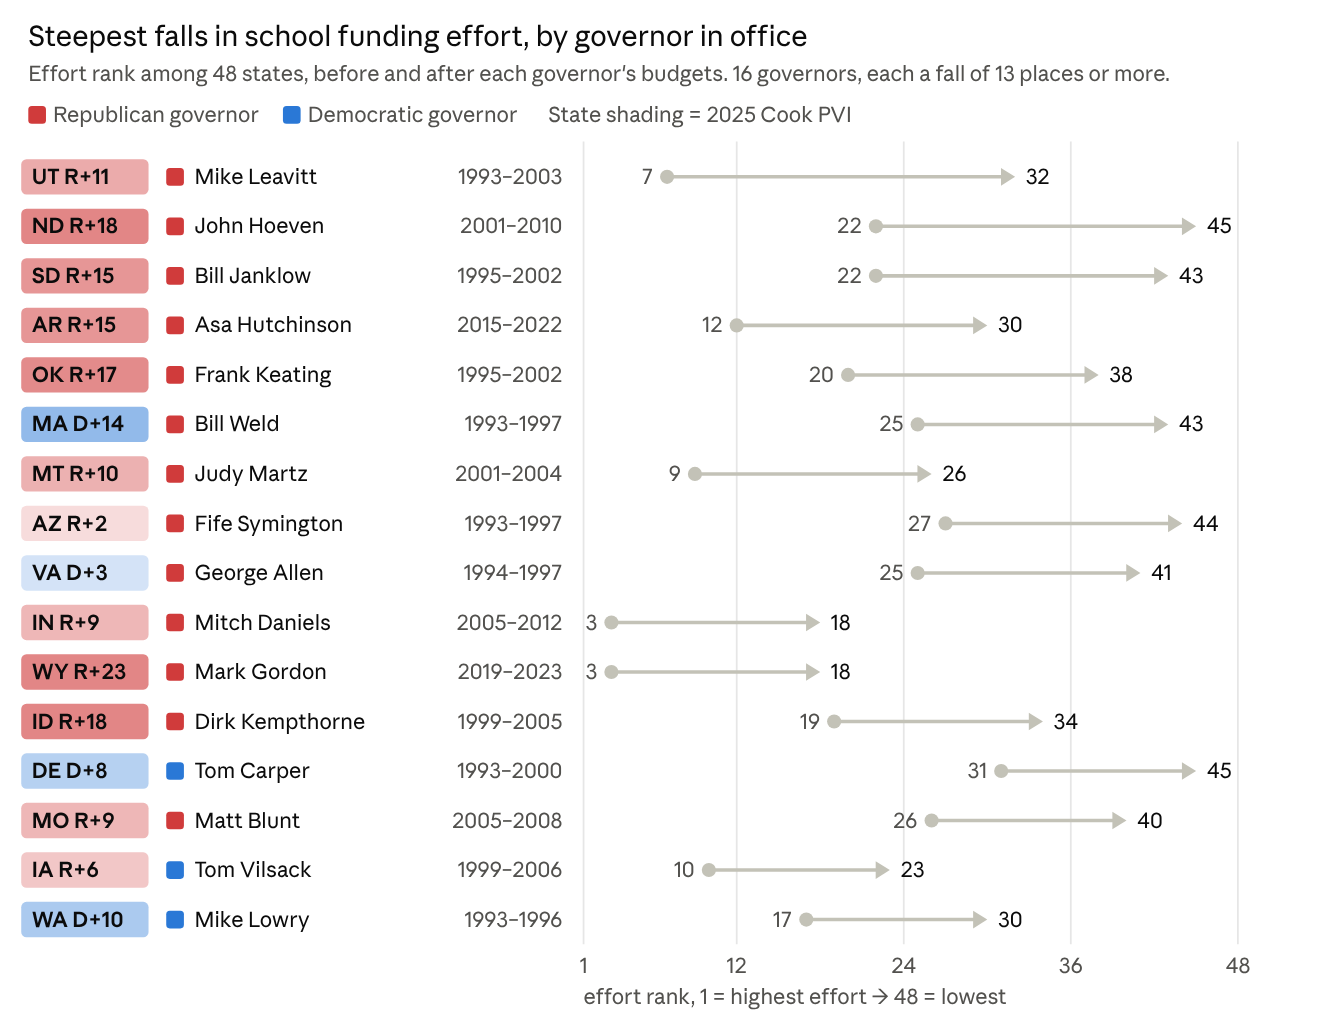
Some of the falls were steep in raw terms too. Under Mitch Daniels, Indiana went from 5.56% to 4.34% of personal income. Under Mark Gordon, Wyoming went from 4.68% to 3.53%. Under Asa Hutchinson, Arkansas went from 4.05% to 3.23%.
This is not a one-party story. Tom Carper in Delaware, Tom Vilsack in Iowa and Mike Lowry in Washington all presided over double-digit drops. Across all 48 states, the steepest decline came under a Republican in 29 states, a Democrat in 17 and an independent in 2. Republicans held 136 of the 262 governorships in the period, so they are overrepresented, but many of these states had few Democratic governors to compare.
A few states held their ground. No governor in Illinois, New Jersey, Vermont, Tennessee or California saw the state lose more than two places in effort rank.
The last eight years
Recent budgets show both directions. Ranking states on effort and adequacy combined, and crediting each change to the governor whose budget it was, 2016–2023 budgets produced these falls and gains.
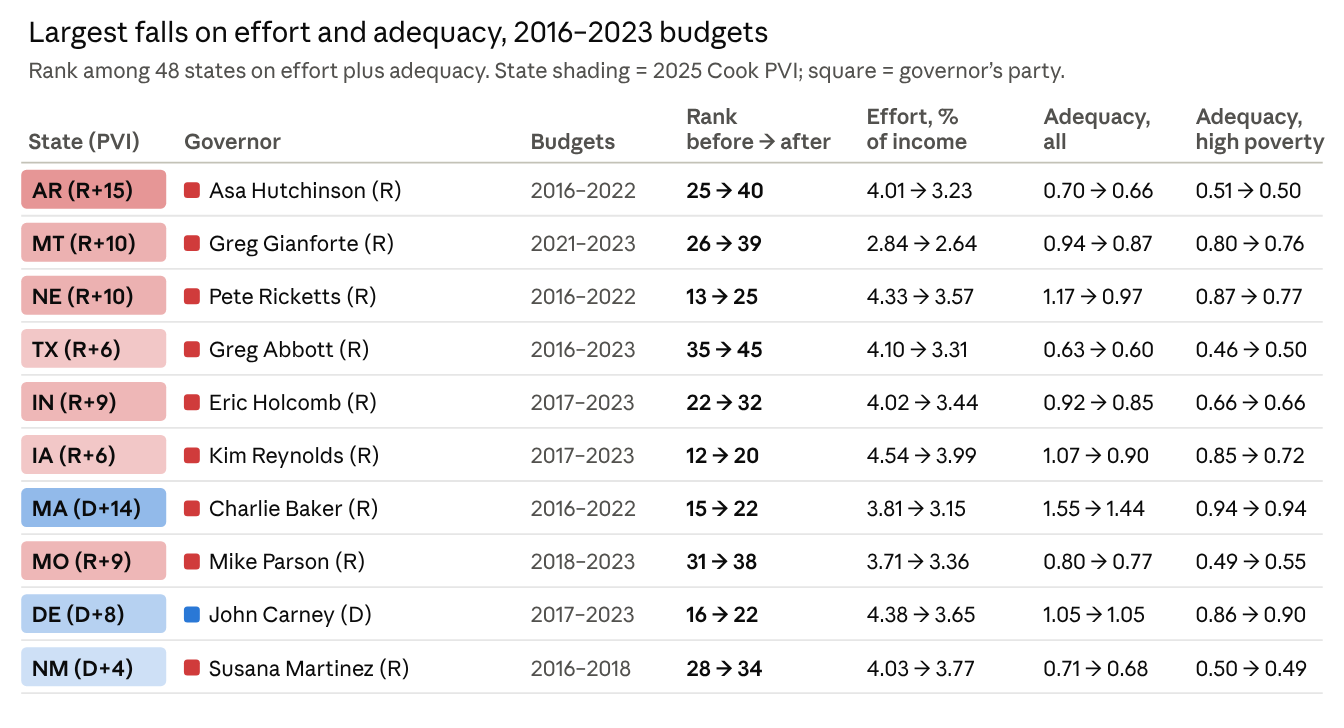
Nine of the ten largest falls came under Republican governors; Republicans held 57 of the 97 tenures in the window. Iowa under Kim Reynolds and Nebraska under Pete Ricketts lost the most on adequacy, with overall adequacy down 0.17 and 0.20. In Arkansas, Texas and Delaware the decline was mostly effort.
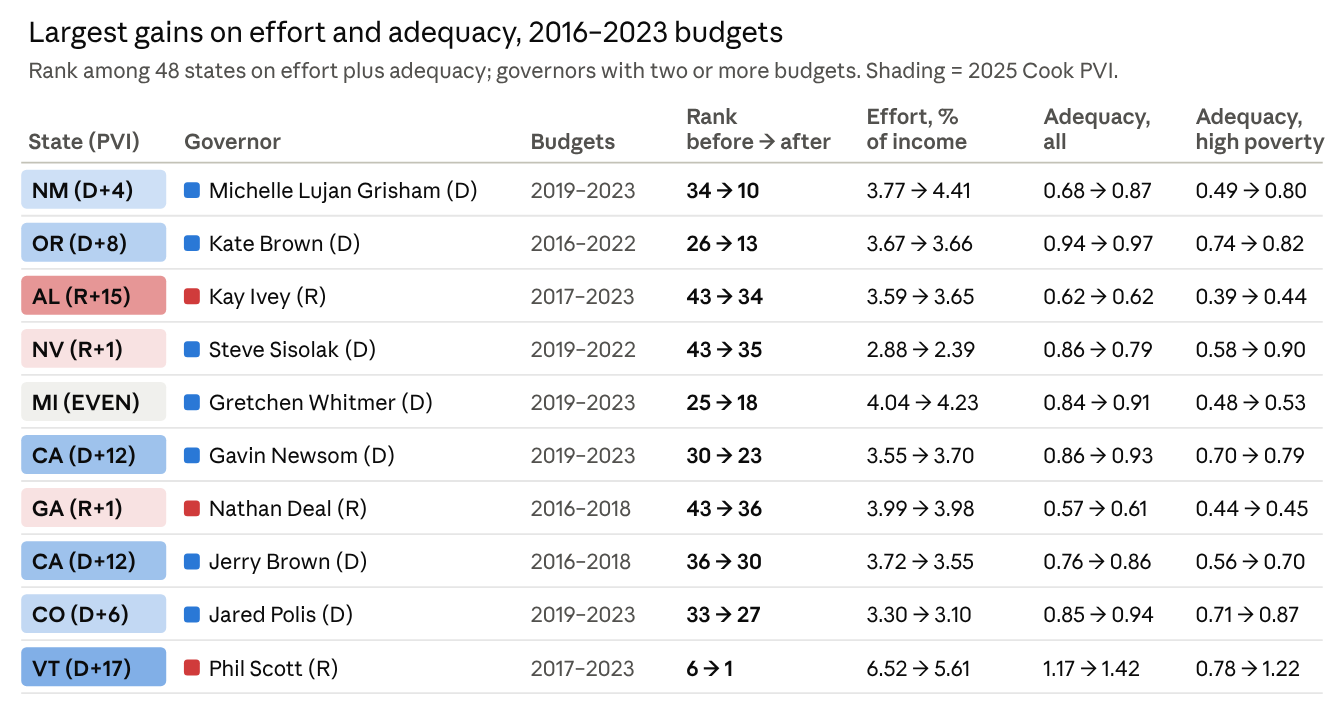
Seven of the ten largest gains came under Democratic governors, three under Republicans. New Mexico under Michelle Lujan Grisham stands out on every measure: effort rose 0.64 points of income and high-poverty adequacy went from 0.49 to 0.80. Those budgets followed the 2018 Yazzie/Martinez ruling, so the court shares the credit. In Nevada, Colorado and Vermont, adequacy rose even as effort as a share of income fell.
On the ballot Tuesday
Thirty-four of the 48 states in this analysis elect a governor on November 3. Alaska and Hawaii also vote but are outside the data. In 16 states the incumbent is running, and the record shown is theirs. In the other 18, the seat is open, and the record is the departing governor’s: the record of the party now holding the office. Rhode Island is listed as open because Gov. Dan McKee lost his primary.
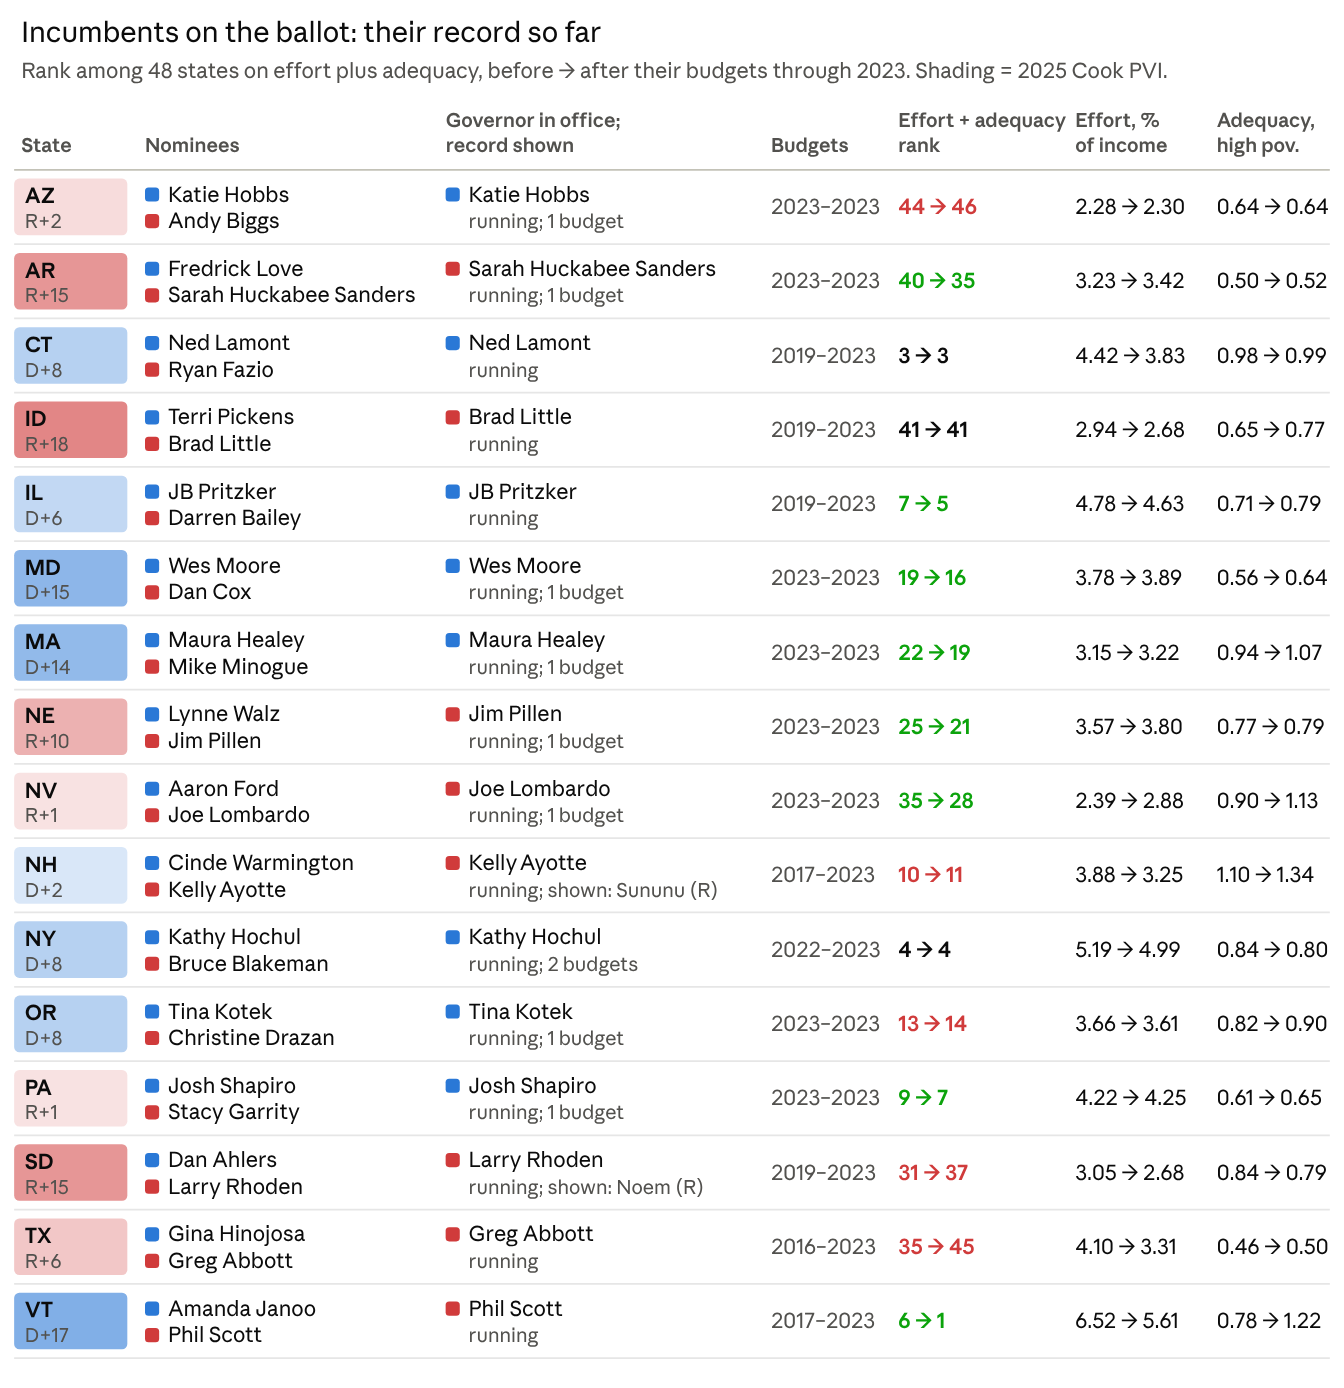
Governors first elected in 2022 have only one budget in the data, too few to judge. Among incumbents with longer records, Phil Scott (R, Vermont) took his state from 6th to 1st, and JB Pritzker (D, Illinois) from 7th to 5th. Greg Abbott (R, Texas) shows the largest fall among incumbents on the ballot, from 35th to 45th. Ned Lamont (D, Connecticut) and Brad Little (R, Idaho) held their states’ rank. Kelly Ayotte (R, New Hampshire) and Larry Rhoden (R, South Dakota) took office after 2023, so their predecessors’ records are shown.
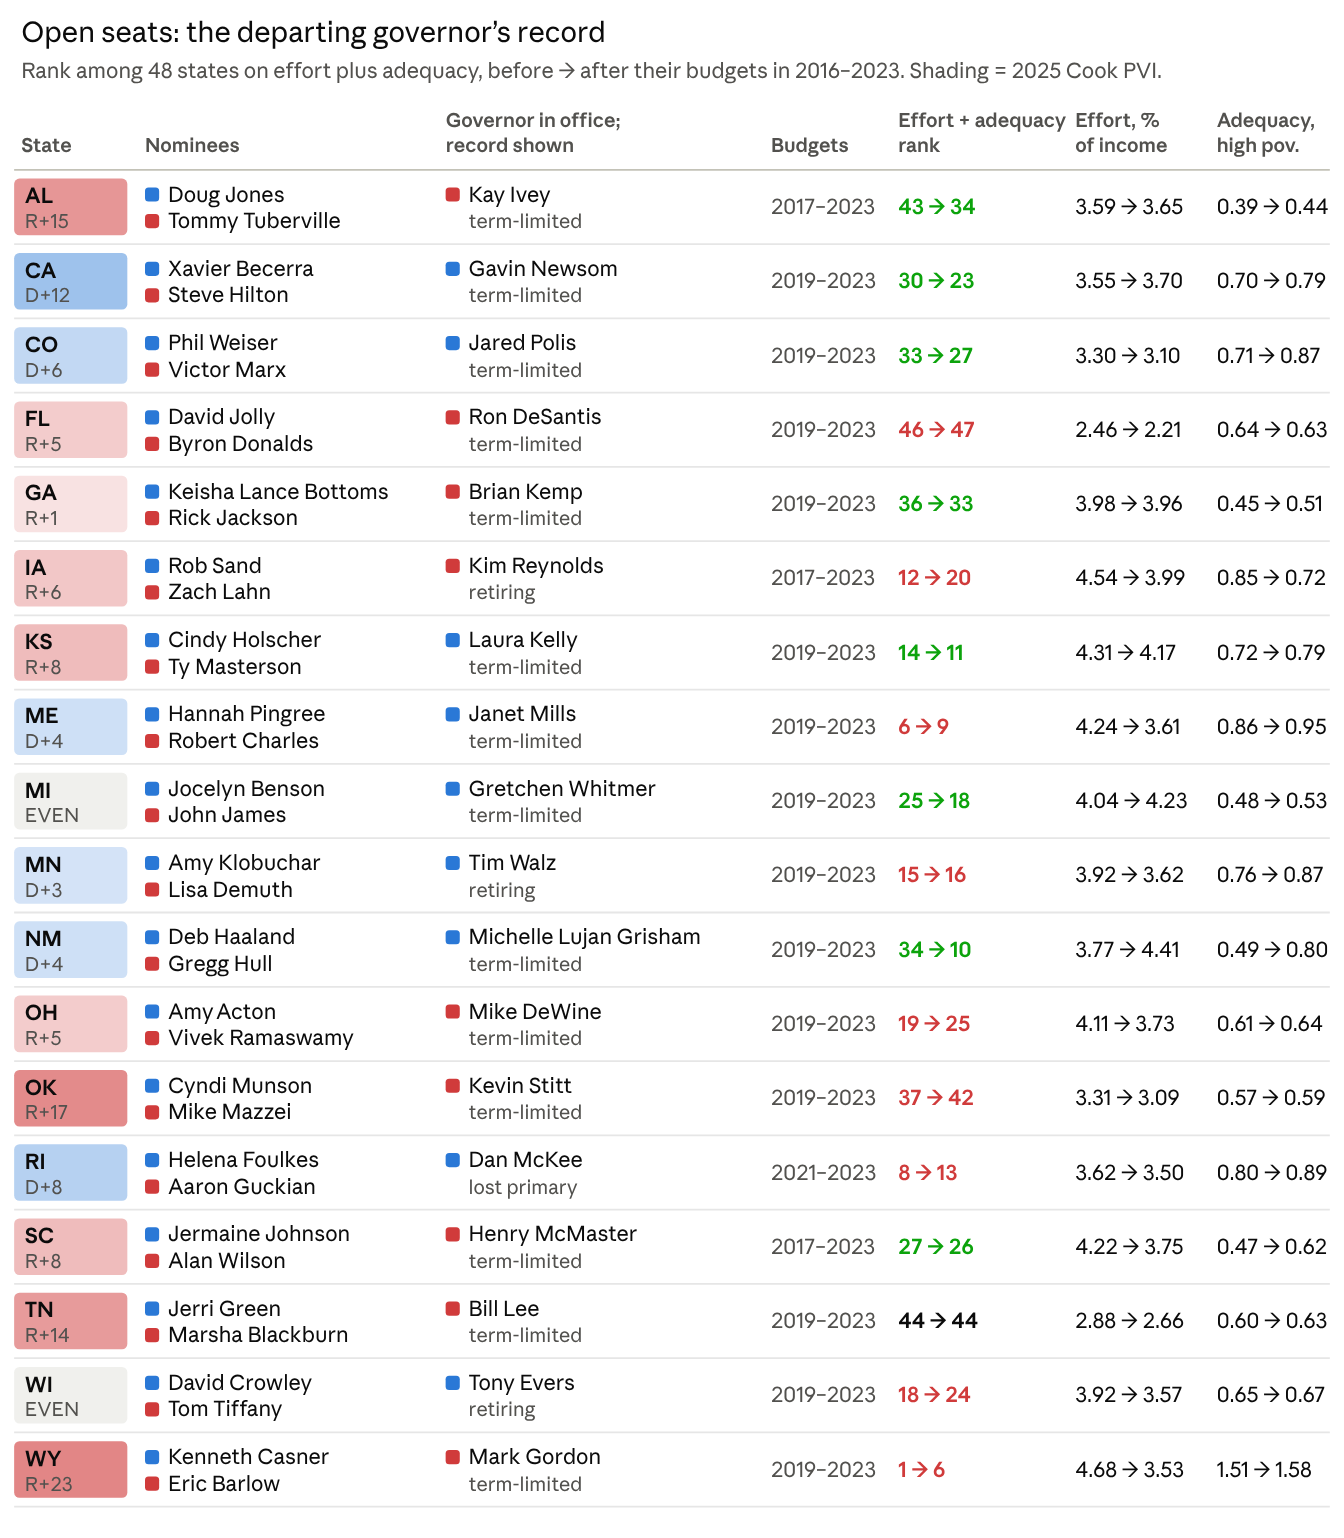
Among open seats, the largest gains came under Michelle Lujan Grisham (D, New Mexico, 34th to 10th), Kay Ivey (R, Alabama, 43rd to 34th), Gretchen Whitmer (D, Michigan) and Gavin Newsom (D, California). The largest falls came under Kim Reynolds (R, Iowa, 12th to 20th), Mike DeWine (R, Ohio), Tony Evers (D, Wisconsin), Mark Gordon (R, Wyoming) and Kevin Stitt (R, Oklahoma).
A departing governor’s budgets say something about the party that wrote them, not about the nominee who would inherit the job. Nominees who have not served as governor have no record in this data. Rhode Island’s Republican nominee is shown as Aaron Guckian, who led a close September primary.
What this does and does not show
These are associations in time, not proof that any one governor caused a decline. Four things deserve weight before anyone reads too much into a single name:
- Governors share the pen. Legislatures write and pass budgets, and in some states the legislature is the stronger hand. Courts also order or block funding changes.
- The economy moves the denominator. Effort is spending relative to income or GSP, so an energy boom (North Dakota in the 2000s, Wyoming more recently) can push effort down even when spending holds steady. Rank nets out national cycles, not state-specific ones.
- Ranks are relative. A state can lose places because others raised effort, not because it cut.
- Short and partial terms. Governors in office before 1993 are judged only on later budgets, and a few tenures cover just one or two budgets.
What the pattern does show is that effort is not fixed. It moves, sometimes sharply, within a single administration. That makes it something voters can hold leaders to.
Elections matter
When a governor’s budgets let effort slide, the state gives up the main lever it has over spending, teacher pay and adequacy. Indiana under Mitch Daniels and Wyoming under Mark Gordon each fell from 3rd to 18th in effort.
Voters can ask concrete questions of anyone running for governor or the legislature. Will they hold or raise the share of state income going to schools? Will new money go first to the districts furthest from adequate? Will tax cuts be paid for by cutting school funding effort?
Public education is the largest thing most states do and the one their constitutions promise. How leaders treat it is a fair test of how they govern.
Data and methods
- Data. School Finance Indicators Database state panel, 1993–2024, for the 48 contiguous states (Alaska, Hawaii and DC excluded). Adequacy uses the National Education Cost Model; NAEP covers grades 4 and 8 reading and math.
- 2024 ranks. Each indicator is ranked 1–48. The overall rank averages within-year percentiles across groups a–g. NAEP enters as scores adjusted for family income (non-linear where cross-validation favored it) and gains since 2003 adjusted for starting score.
- Political lean. 2025 Cook Partisan Voting Index; D-leaning means D+1 or more, R-leaning R+1 or more.
- Effort and governors. Effort rank averages within-year percentiles of state and local education spending as a share of GSP and of state and local revenue as a share of personal income. The change into data year t is credited to the governor in office on July 1 of year t−1. Governor terms come from Jacob Kaplan’s governors dataset, extended through 2023 and corrected for December inaugurations and mid-year transitions.
- Interactive version. Rank tables, state best years and every governor’s effort record are on the Red-Blue School Finance Ranks dashboard.


