Abbott Elementary plays it for laughs. Janine Teagues hunts for a working rug, a functioning copier, a single extra aide. Barbara Howard has seen every reform come and go. Gregory Eddie inherits a classroom with no curriculum. Melissa Schemmenti knows a guy who can get the supplies the district can’t.
The show is entertaining. The damage is real. Behind every running gag is a funding gap that has been measurable, year after year, for at least fifteen years, and that has landed on real children in real Philadelphia classrooms.
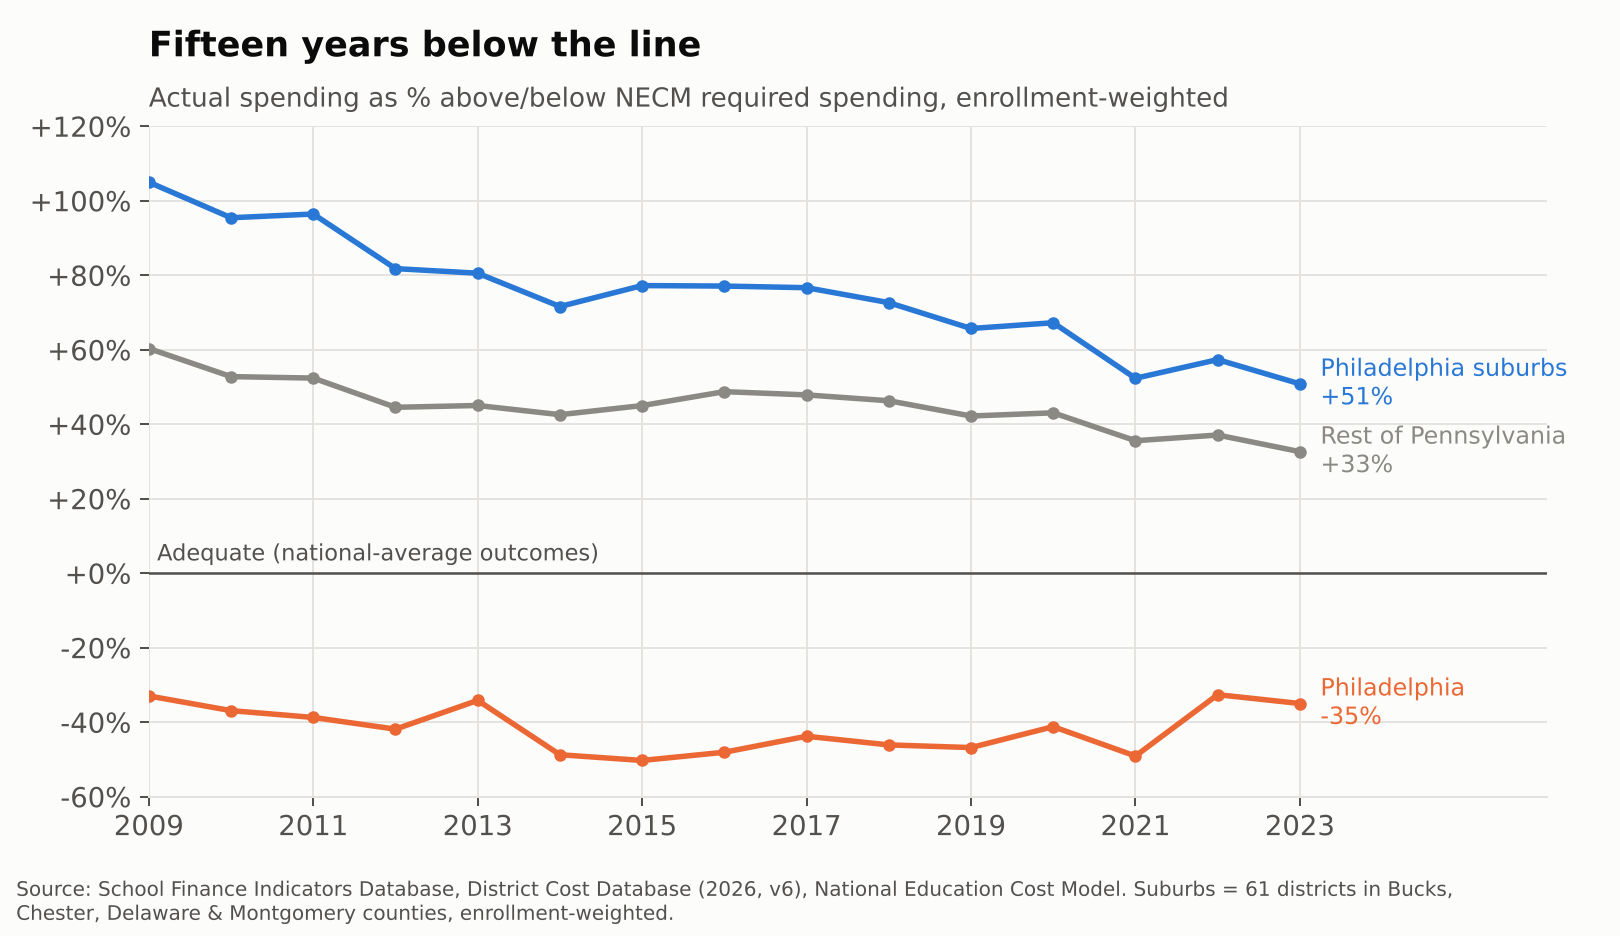
Philadelphia’s district schools have spent between a third and a half less than what it would cost to get their students to national-average outcomes in every year from 2009 to 2023. Over the same years, the 61 suburban districts in Bucks, Chester, Delaware and Montgomery counties spent between half again and twice what their own students needed. We laugh at the broken boilers, missing counselors and teachers buying their own supplies. The kids living it don’t get a laugh track.
What follows walks from the money to the classroom: first the adequacy gap, then the simple “screwed city” picture, then teachers per child, teacher pay, and finally who is actually standing in front of the kids.
Fifteen years below the line
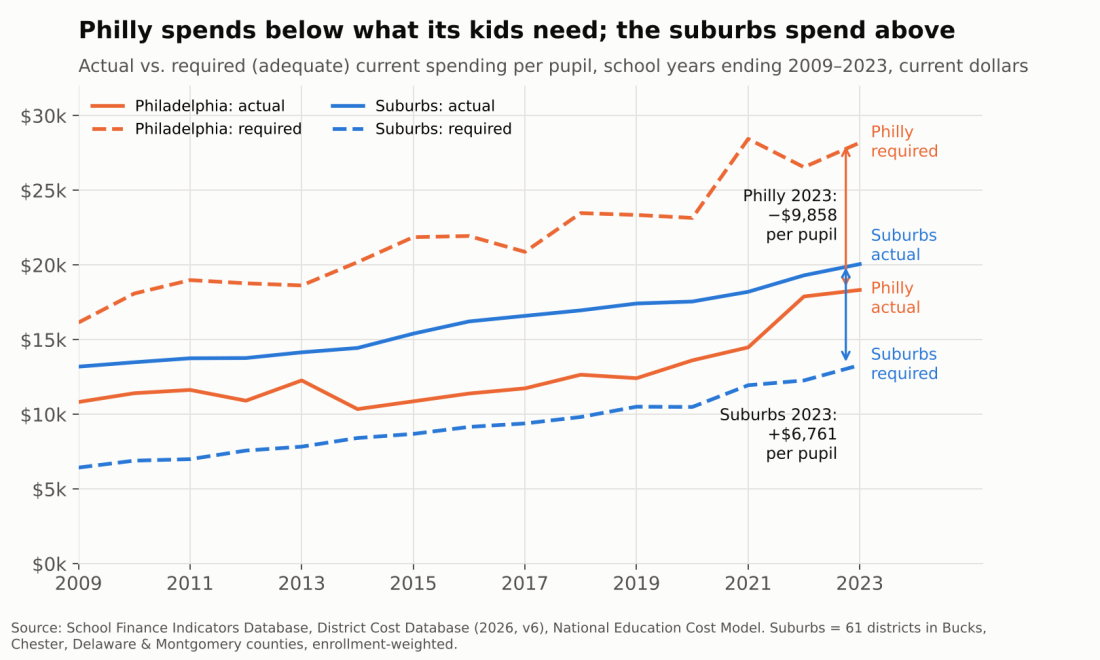
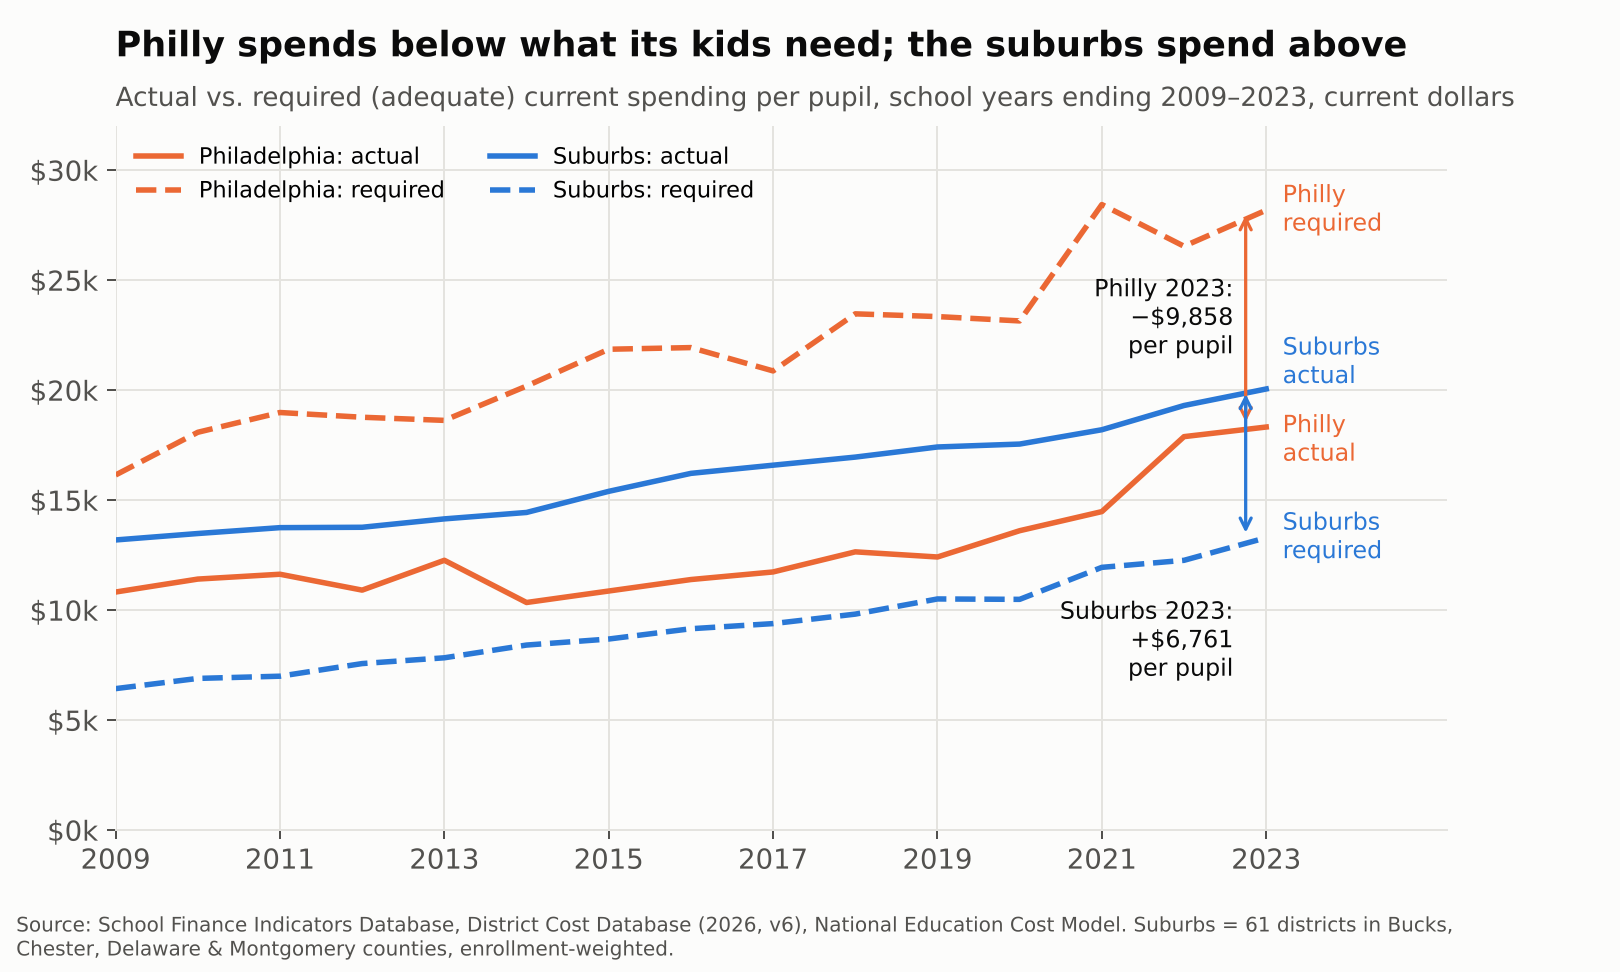
In 2022-23, the School District of Philadelphia spent $18,329 per pupil. Our National Education Cost Model estimates it would have needed $28,187 to give its students a shot at national-average test scores. That is a gap of $9,858 per child, or roughly $1.2 billion across 118,000 students, in a single year.
The suburbs face the mirror image. Their enrollment-weighted average spending was $20,059 against a required $13,298, a surplus of $6,761 per child. Same metro, same labor market, same state constitution.
This is not a recent dip. Philadelphia sat 33% below its adequacy target in 2009, sank to 50% below in 2015 in the wake of the “doomsday” budgets, and was still 35% short in 2023, even with federal pandemic aid in the mix. The suburbs started out spending more than double their target and have drifted down to about 51% above it. The rest of Pennsylvania sits in between, about a third above.
The outcome side tells the same story. Philadelphia’s students scored roughly 0.8 standard deviations below the national average in 2022-23, while suburban students scored about 0.2 above. Abbott’s students are not falling short because nobody cares. They are falling short where the money falls short.
The simple version: a “screwed city”
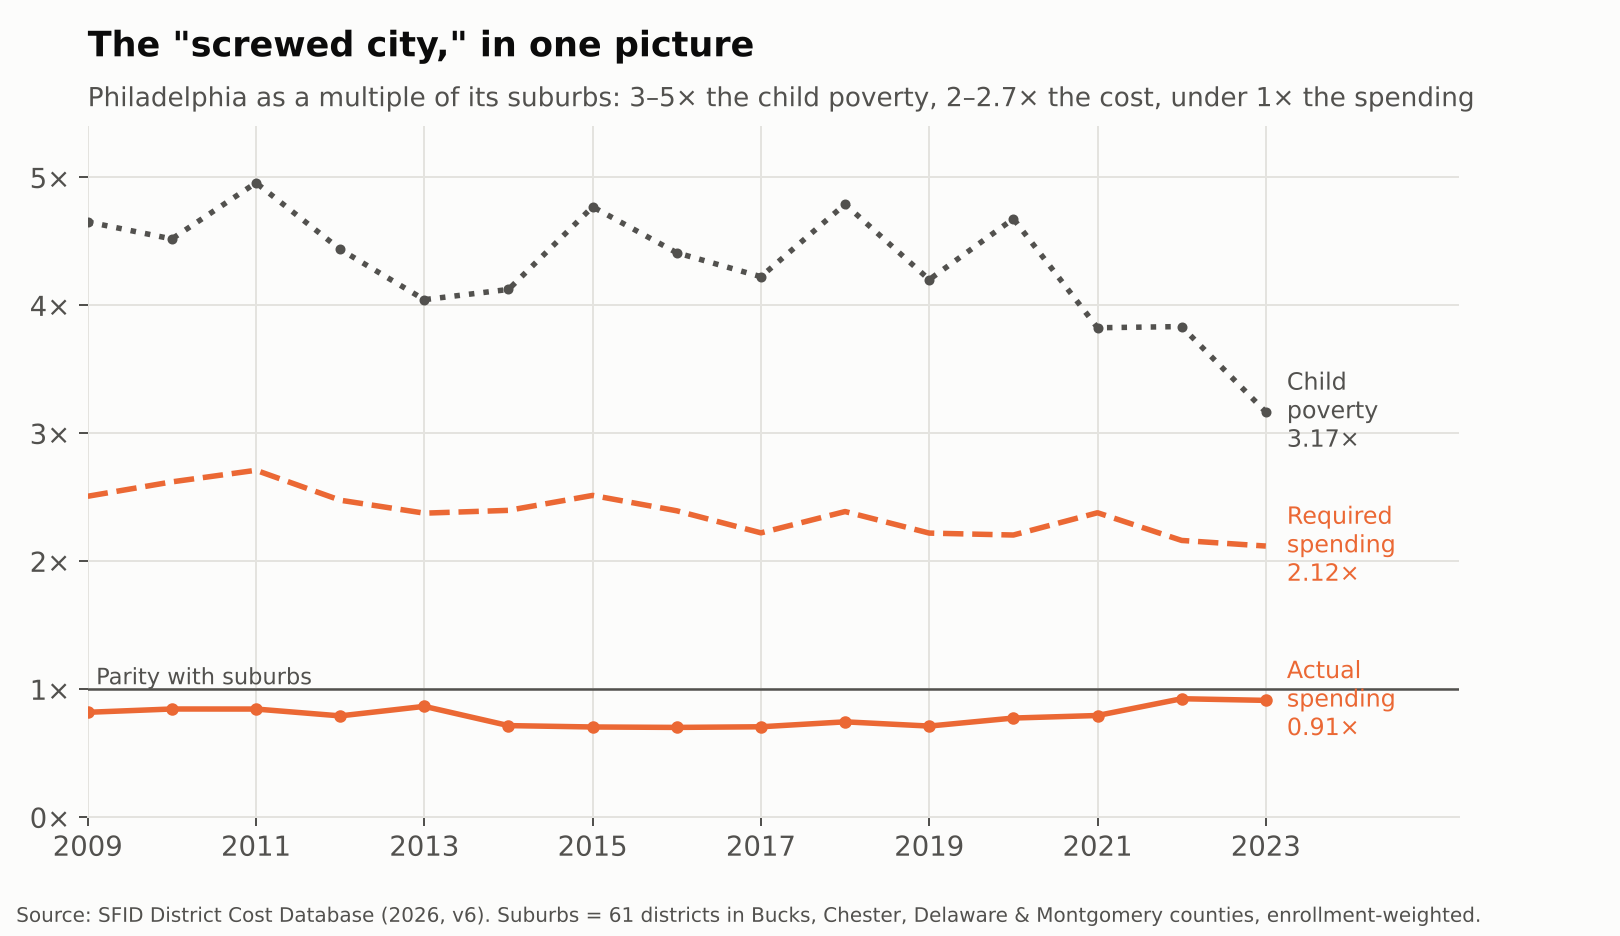
You don’t need a cost model to see the problem. Divide Philadelphia by its suburbs. In 2022-23, the city had 3.2 times the suburban child poverty rate. Under the NECM, that translates into 2.1 times the cost of reaching national-average outcomes. And the city spent 0.91 times what the suburbs spent.
That pattern has held every year since 2009. Philly’s poverty rate has run 3 to 5 times the suburban rate, its costs 2 to 2.7 times, and its spending has never once caught up to the suburbs, let alone exceeded them.
That is what it means to be a screwed city. Not just underfunded relative to need, but outspent outright by the comfortable districts a short SEPTA ride away.
Even in Pennsylvania, Philadelphia is not alone
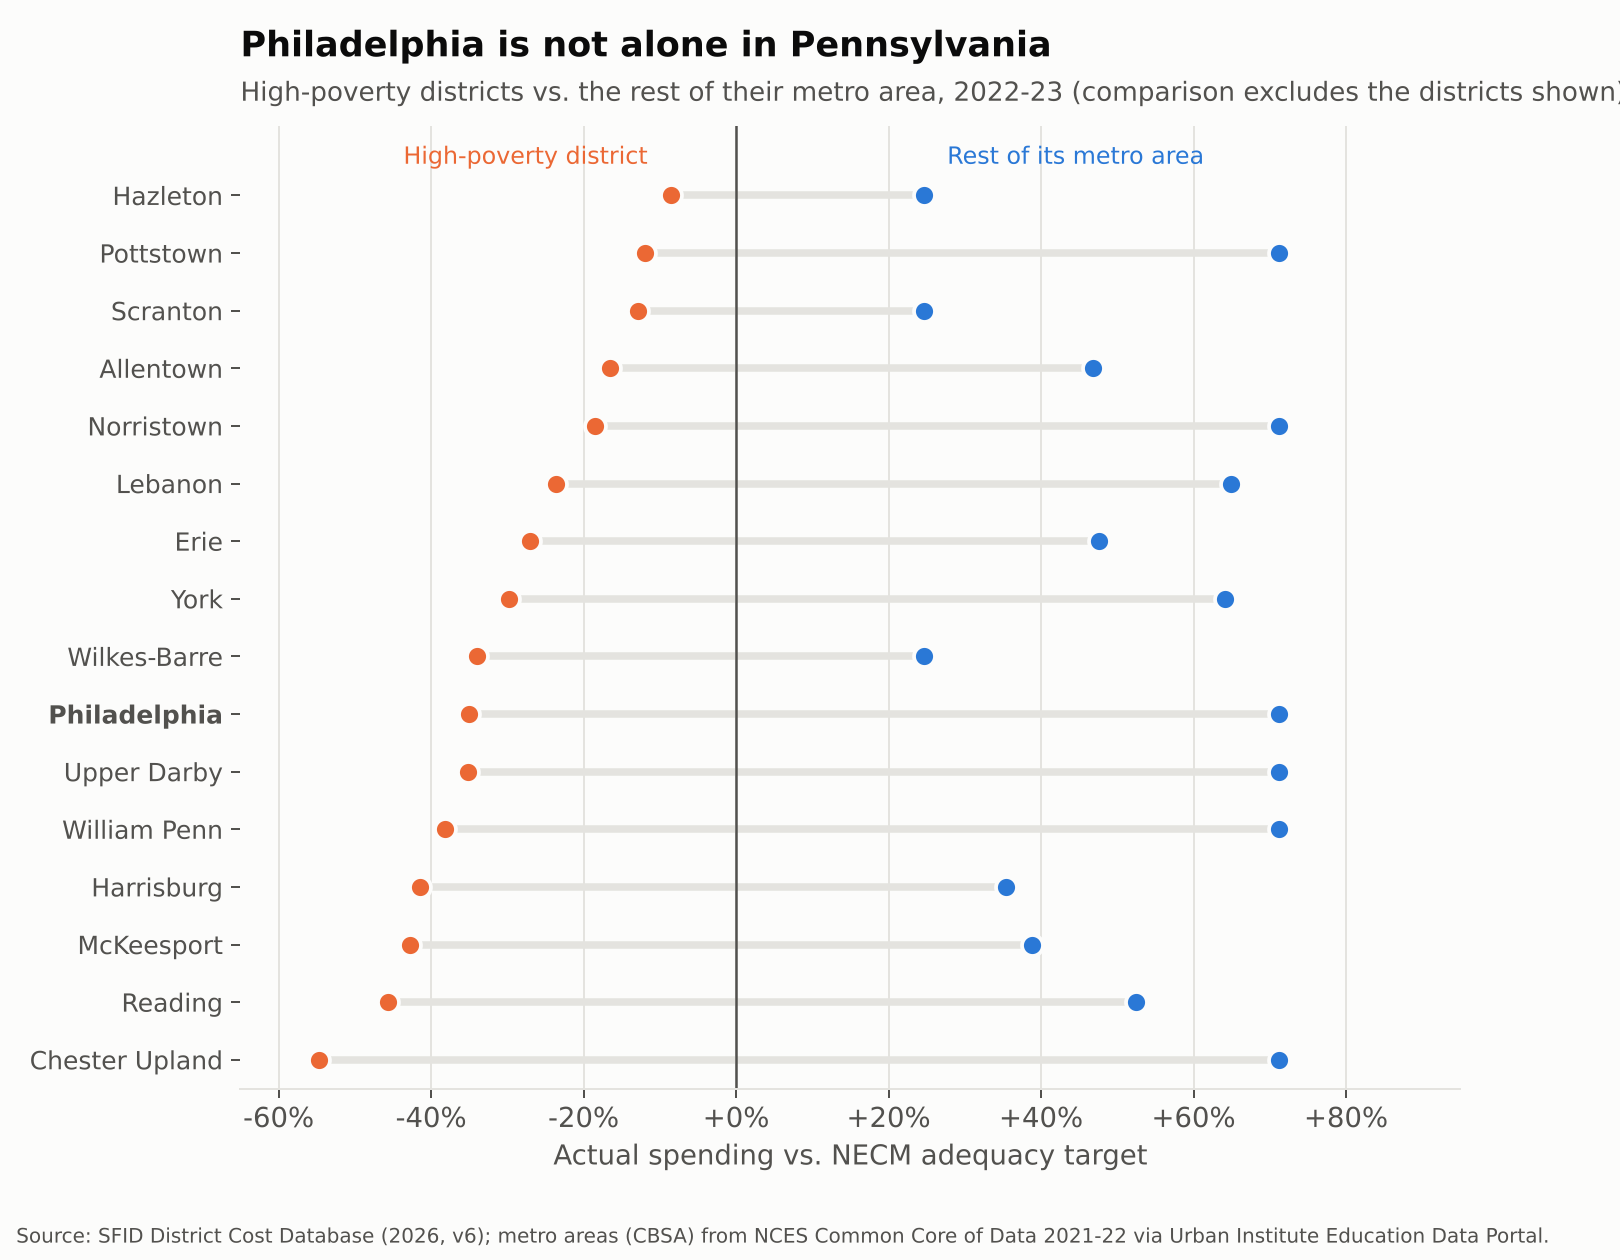
Philadelphia is the biggest case, not the only one. Reading spent 46% below its adequacy target in 2022-23, while the rest of the Reading metro spent 53% above. Allentown was 17% short while its Lehigh Valley neighbors were 47% over. Harrisburg, York, Lebanon, Erie, Wilkes-Barre and Chester Upland tell the same story.
The pattern reaches into Philly’s own suburbs. Chester Upland, Upper Darby, William Penn, Norristown and Pottstown are all below adequacy, surrounded by districts in the same four counties that spend about 71% above theirs.
Across the state, 56 of 497 districts spent below their adequacy targets in 2022-23. They enroll 23% of Pennsylvania’s students, but 67% of its Black students and 49% of its Hispanic students, compared to 8% of its white students. Philadelphia accounts for about a third of the students in those districts. Fixing Philly alone would not fix Pennsylvania.
This is the system the Commonwealth Court found unconstitutional in William Penn School District v. Pennsylvania Department of Education in February 2023. The state has since begun phasing in adequacy aid, including $565 million statewide in the 2025-26 budget (WHYY). The gaps above are what that aid is chasing.
From dollars to classrooms: fewer adults per child
School money is mostly people. When a district is short a third of what it needs, the shortfall shows up as fewer teachers, larger classes and missing specialists.
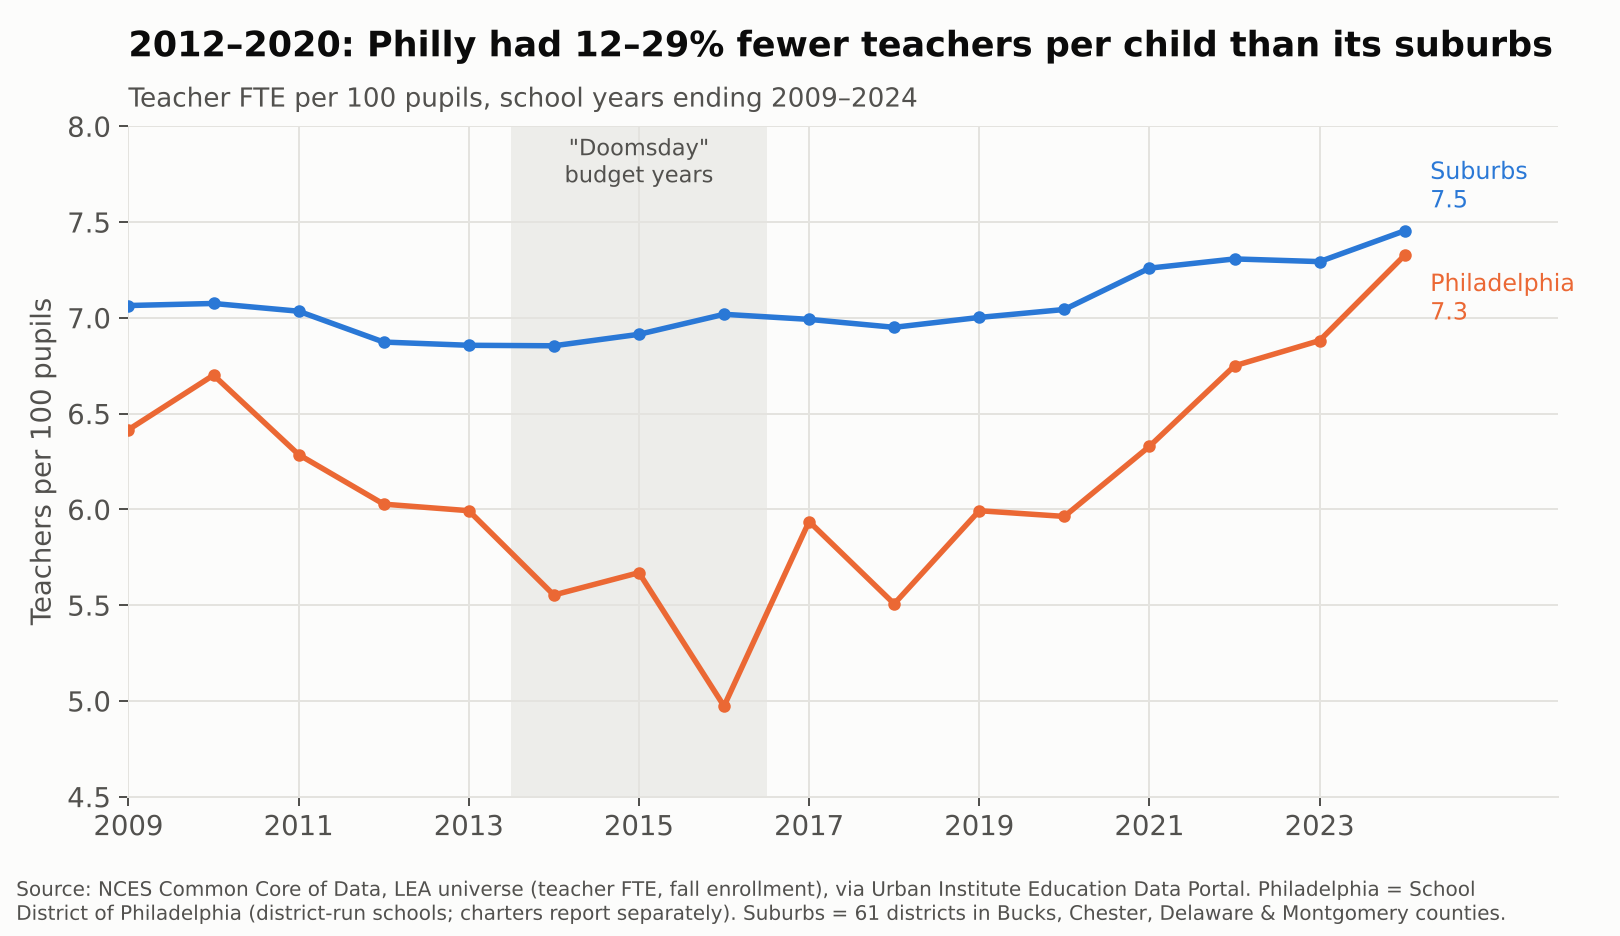
Philadelphia reported 11,103 teachers in 2009-10. By 2013-14 it had 7,645, a 31% cut, while enrollment fell only 17%. From 2012 through 2020, the district ran between 12% and 29% fewer teachers per 100 pupils than its suburbs. That is Gregory Eddie’s world: a full roster of kids, and not enough colleagues to share them with.
The gap has nearly closed since 2021, to 7.3 teachers per 100 pupils in Philadelphia vs. 7.5 in the suburbs in 2023-24, helped by federal pandemic aid and new state money. But parity is not adequacy. A district whose students cost twice as much to serve, by the NECM’s estimate, does not get there with the same staffing ratio as Lower Merion.
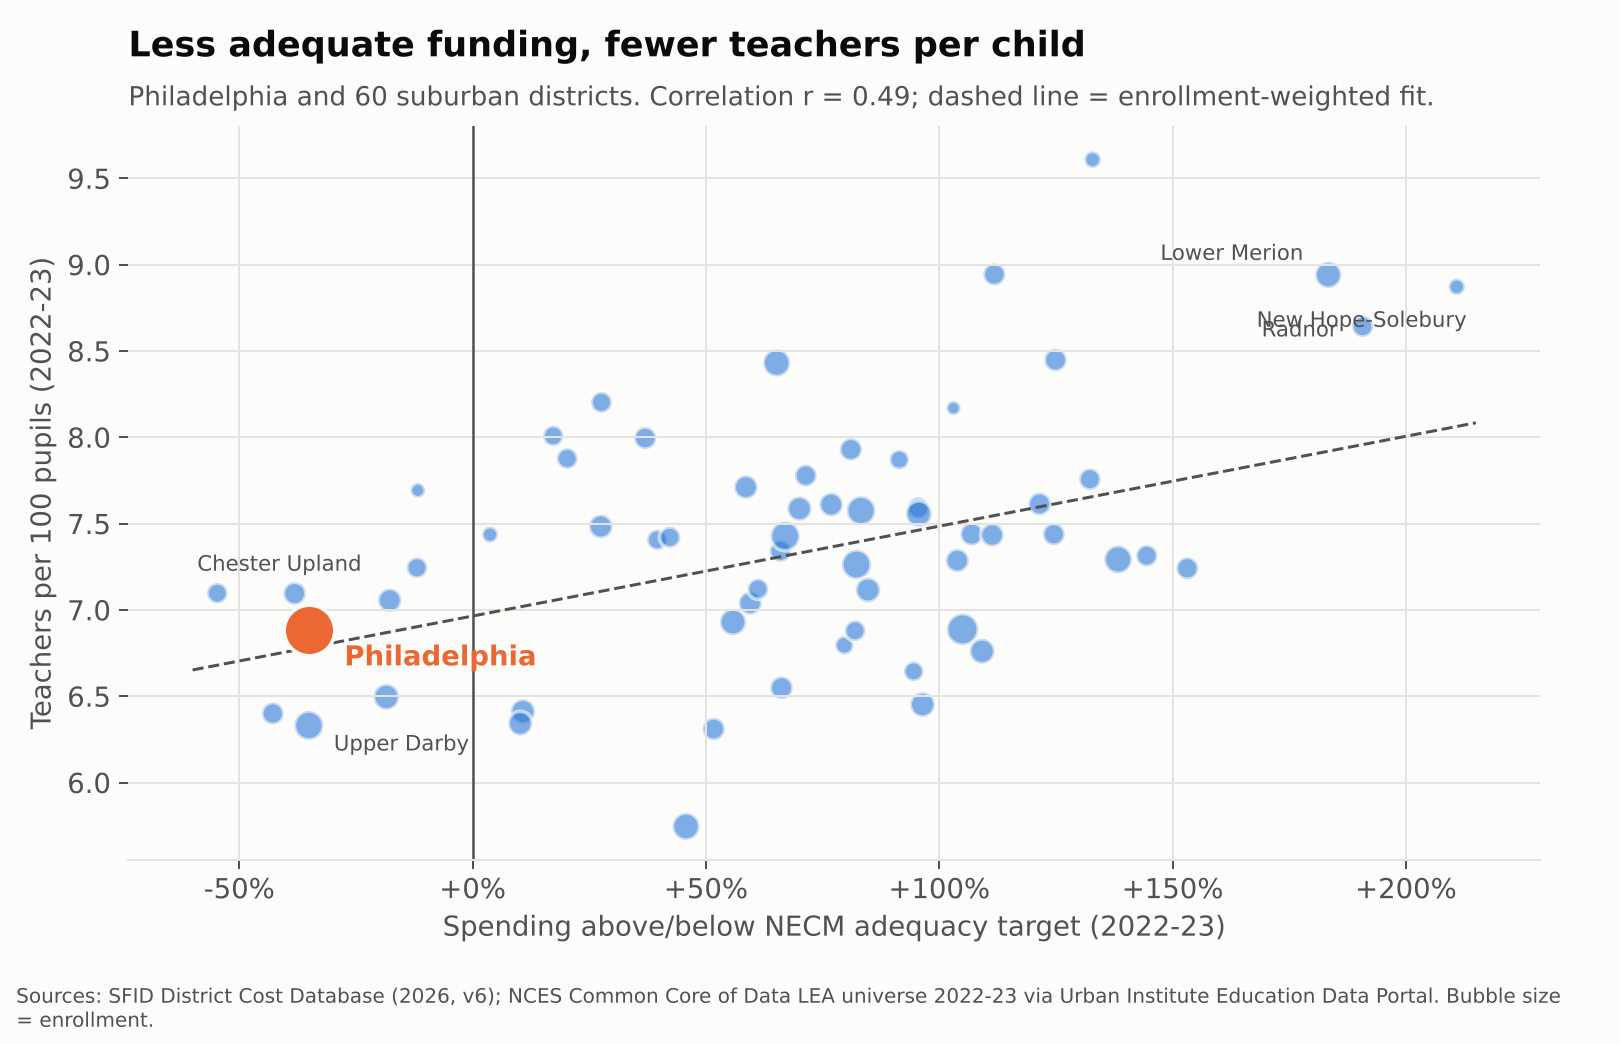
Across Philadelphia and its suburbs, adequacy and staffing move together. Districts further above their adequacy targets employ more teachers per child (r = 0.49 in 2022-23). The fitted line implies that if Philadelphia were funded like the average suburb, it would have roughly 0.45 more teachers per 100 pupils, or about 500 more teachers, before accounting for its higher needs at all.
Teacher pay: same labor market, different paychecks
Philadelphia and its suburbs hire from the same pool of teachers, often the same graduating classes. So pay comparisons here need no regional cost adjustment. They are apples to apples.
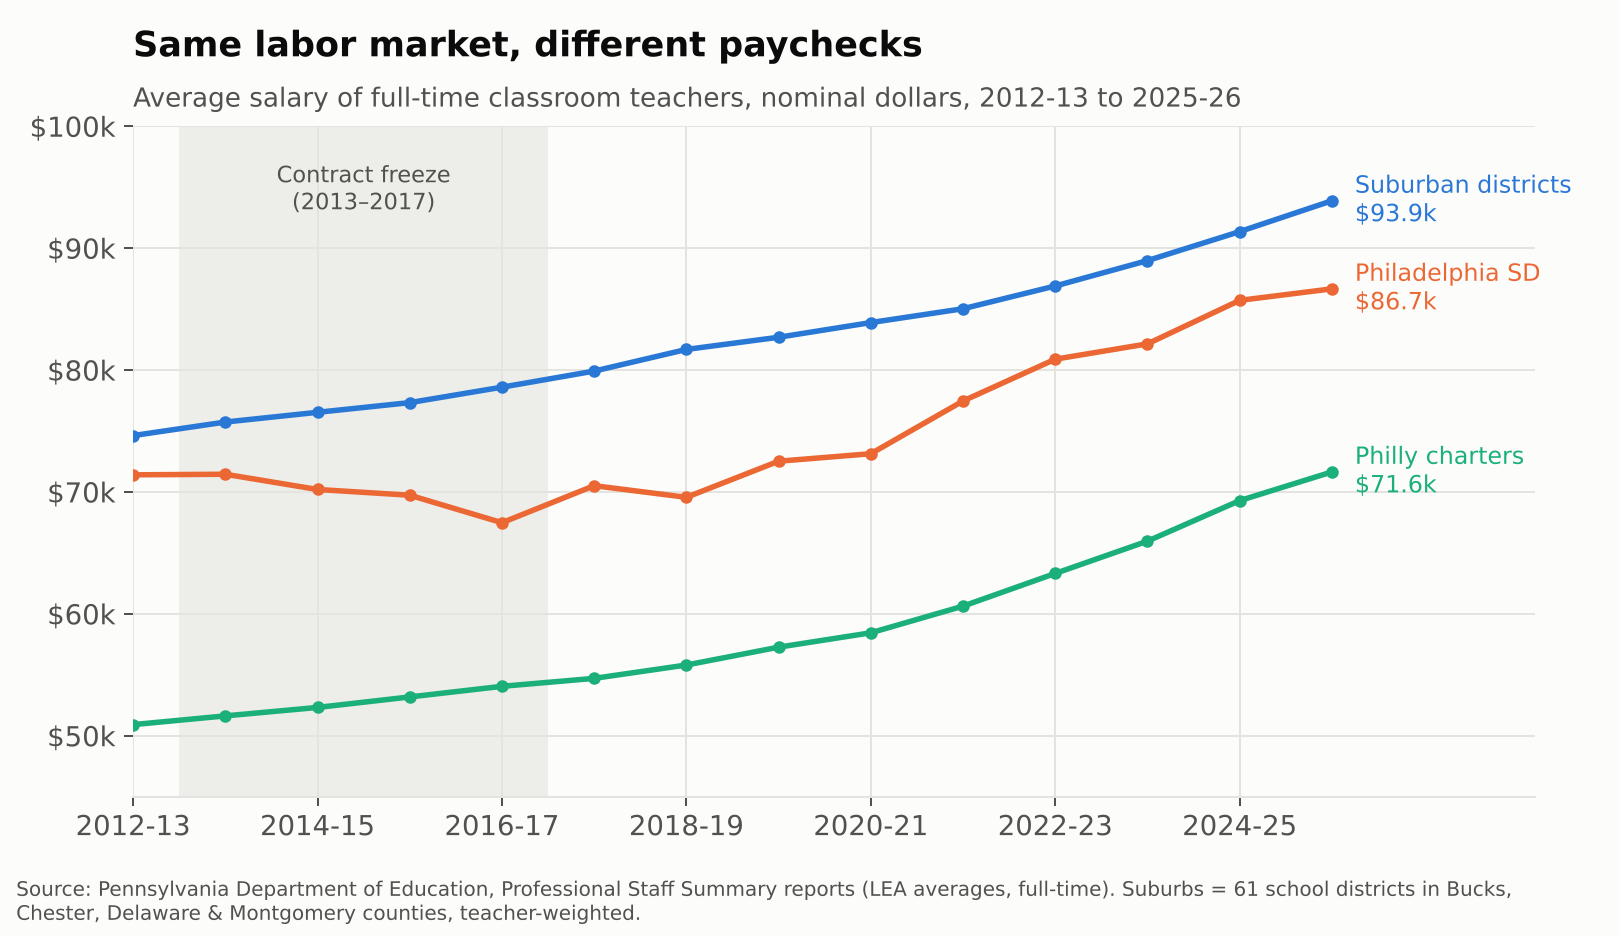
In 2012-13, the average full-time Philadelphia district teacher earned $71,407, about 96% of the suburban average. Then came four years without a contract. By 2016-17, Philly’s average had actually fallen to $67,479 while the suburbs rose to $78,598, a gap of more than $11,000. The district has climbed back since, to $86,664 in 2025-26, but that is still about $7,200 behind the suburbs. Teachers in the city’s charter schools averaged $71,644, roughly three quarters of the suburban figure.
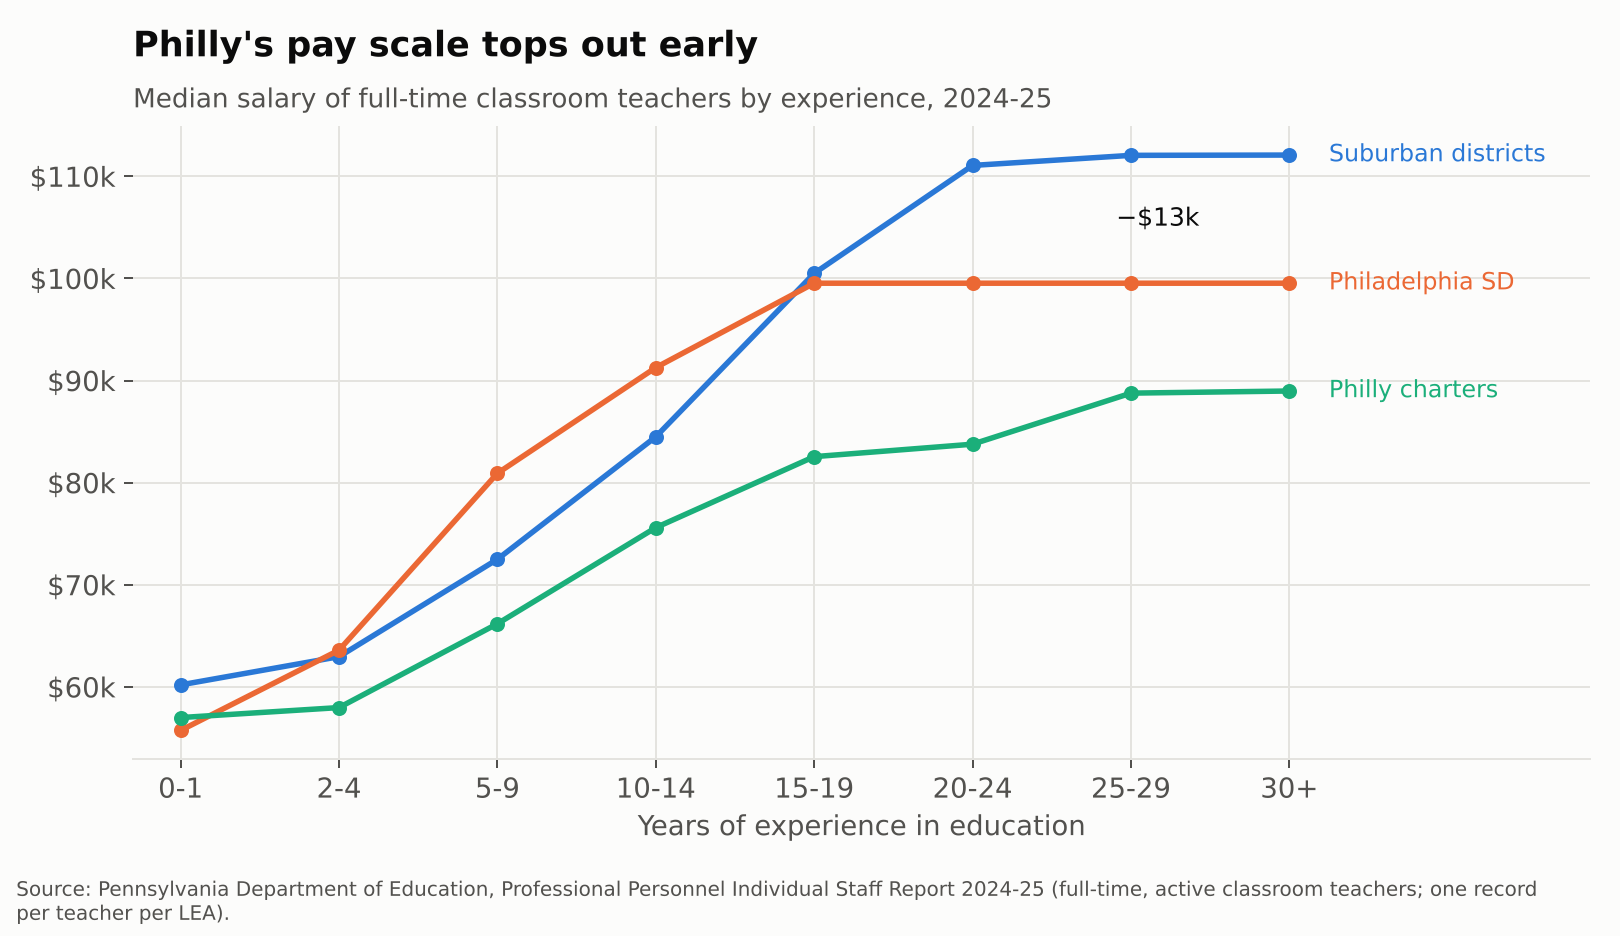
The averages hide where the gap bites. Philadelphia’s current salary scale is competitive in the middle years. Teachers with 5 to 14 years of experience actually earn more than their suburban peers. But the scale flattens at $99,534 after about 15 years. Suburban veterans keep climbing, to a median of about $112,000. A 25-year Philly veteran makes roughly $12,500 less than one in the suburbs.
That matters for who stays. Philadelphia district teachers average 13.7 years of experience, vs. 15.6 in the suburbs. Charter teachers average 8.9. Every school needs its Barbara Howards. An underfunded system has the hardest time keeping them.
Inside the building: who is actually in front of the kids
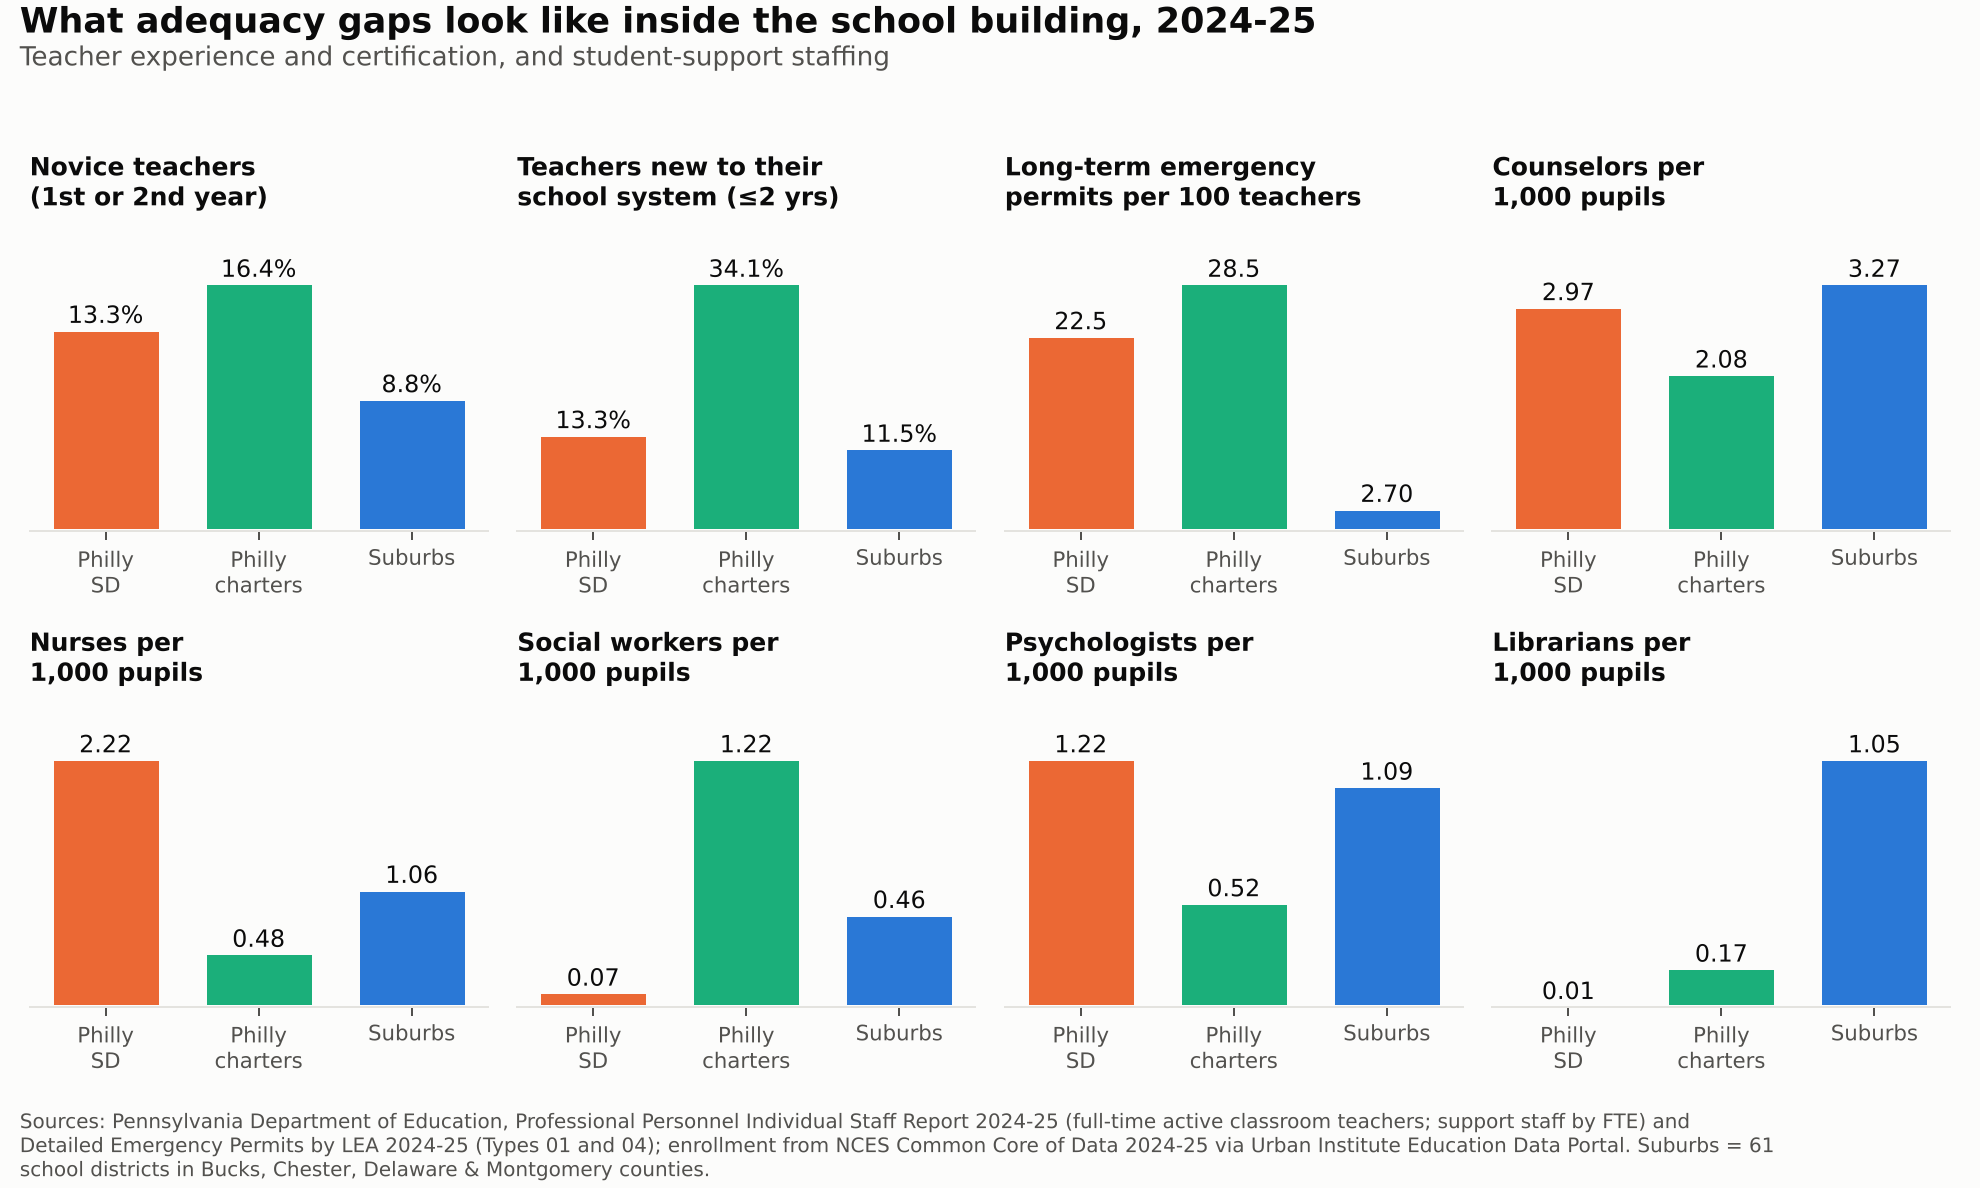
Pennsylvania’s own staff records let us look at who is actually in the classroom, through 2024-25. Janine is not the exception at Abbott. In 2024-25, 13.3% of district teachers were in their first or second year in education, vs. 8.8% in the suburbs. In the city’s charters it was 16.4%, and more than a third of charter teachers had been with their school system for two years or less.
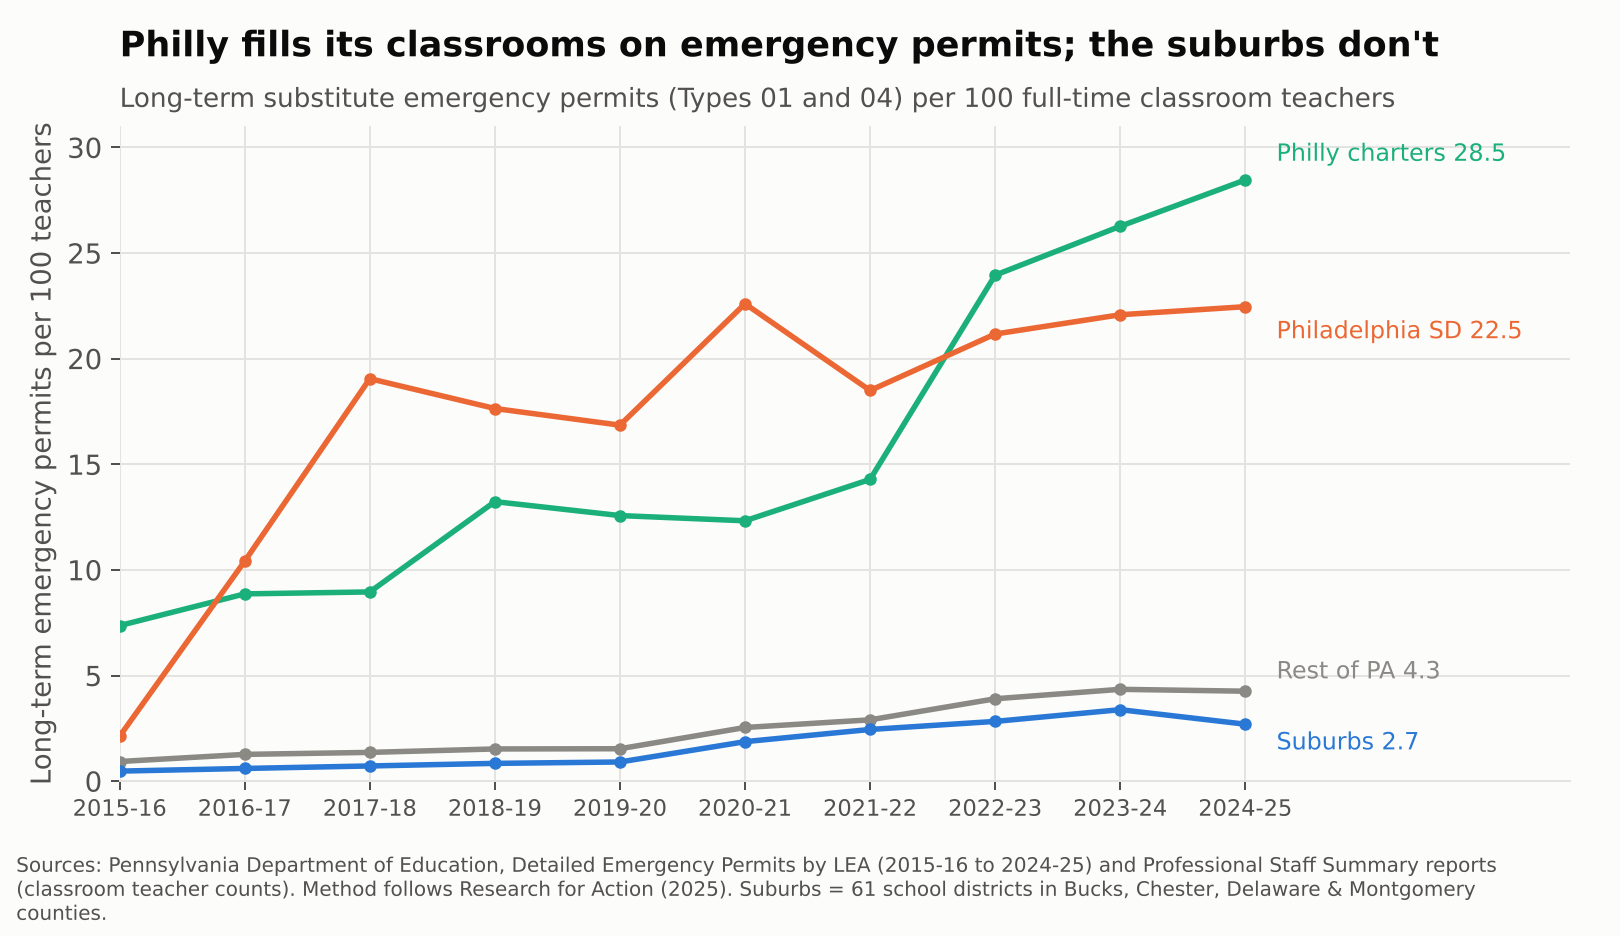
The starkest gap is certification. Pennsylvania lets districts fill vacancies with long-term substitutes on emergency permits when they can’t hire a certified teacher. In 2024-25 the School District of Philadelphia held 22.5 of those permits for every 100 classroom teachers. Philly charters held 28.5. The suburbs held 2.7, and the rest of the state 4.3. Philadelphia’s rate jumped from about 2 to 19 per 100 between 2015-16 and 2017-18, during and right after the contract freeze, and has never come back down.
Support staff tell a more complicated story. After the 2013 layoffs left many schools without counselors or nurses, the district rebuilt. In 2024-25 it reported more nurses and psychologists per 1,000 pupils than the suburbs, and nearly as many counselors (3.0 vs. 3.3). That is what recent money bought. But it is rough parity for students with three times the poverty, and some positions never came back. The district reported 9 social worker FTE and 1 librarian for about 120,000 students. The suburbs had about 148 social workers and 342 librarians for 325,000.
Teachers are also absent more. In the most recent federal data with that measure, 2017-18, 46% of district teachers missed 10 or more days, vs. 38% in the suburbs.
The show is entertaining. The damage is real.
Abbott Elementary works because its teachers are heroic and funny and stubborn. Real Philadelphia teachers are too. But heroism is not a funding formula. Year after year, the data show the same chain: Pennsylvania’s system leaves Philadelphia, Reading, Allentown, Harrisburg and their peers far below what their students need. That shortfall becomes fewer teachers per child, a pay scale that stops rewarding veterans, more novices and uncertified teachers, and libraries with no librarians.
The Commonwealth Court said in 2023 that this system violates the state constitution. The new adequacy aid is a start, and the recent staffing gains show money does show up in classrooms when it arrives. But a district still roughly $10,000 per child short of adequacy in 2022-23 will not close that gap with a few hundred million dollars spread across the state.
Janine shouldn’t have to fix the copier herself. And the kids in her class shouldn’t have to be in a sitcom for anyone to notice.
Bonus track: “Below the Line (Philly’s Song)”
Some things are easier to sing than to chart. Here is the same story as an a cappella ballad, with the numbers from this post rising out of the horn.
Below the Line (Philly’s Song). Figures in the video come from the analysis above.
Data notes and sources
Adequacy: School Finance Indicators Database, District Cost Database 2026 (v6), National Education Cost Model estimates of required spending to reach national-average outcomes. Spending is current spending per pupil, direct to elementary and secondary education, in current dollars. Years are school years (2023 = 2022-23).
Suburbs: the 61 regular school districts in Bucks, Chester, Delaware and Montgomery counties, enrollment-weighted unless noted. Metro comparisons for other Pennsylvania cities use Census CBSAs from the NCES Common Core of Data.
Staffing: teachers per pupil from the NCES Common Core of Data LEA universe; teacher absences from the Civil Rights Data Collection; both via the Urban Institute Education Data Portal. Philadelphia SD figures cover district-run schools; charters report separately.
Caveats: NECM estimates are model-based and benchmarked to grade 3–8 math and reading outcomes. Emergency permit rates count long-term substitute permits (Types 01 and 04) per full-time classroom teacher, following Research for Action (2025); a permit is not an FTE, so read them as rates of reliance, not exact shares of classrooms. Teacher absences come from the 2017-18 Civil Rights Data Collection, the latest year with that item.
Related: Rachel Wessler’s earlier Shanker Institute reflection on the show, Heartwarming or Heartbreaking; state budget coverage from WHYY.
Economists around the world treat schooling as an investment in human capital: the skills and knowledge that make people, and economies, productive. The international evidence that this investment pays is about as settled as anything in the field. Yet here in the U.S., we keep having the same argument about whether school money matters.
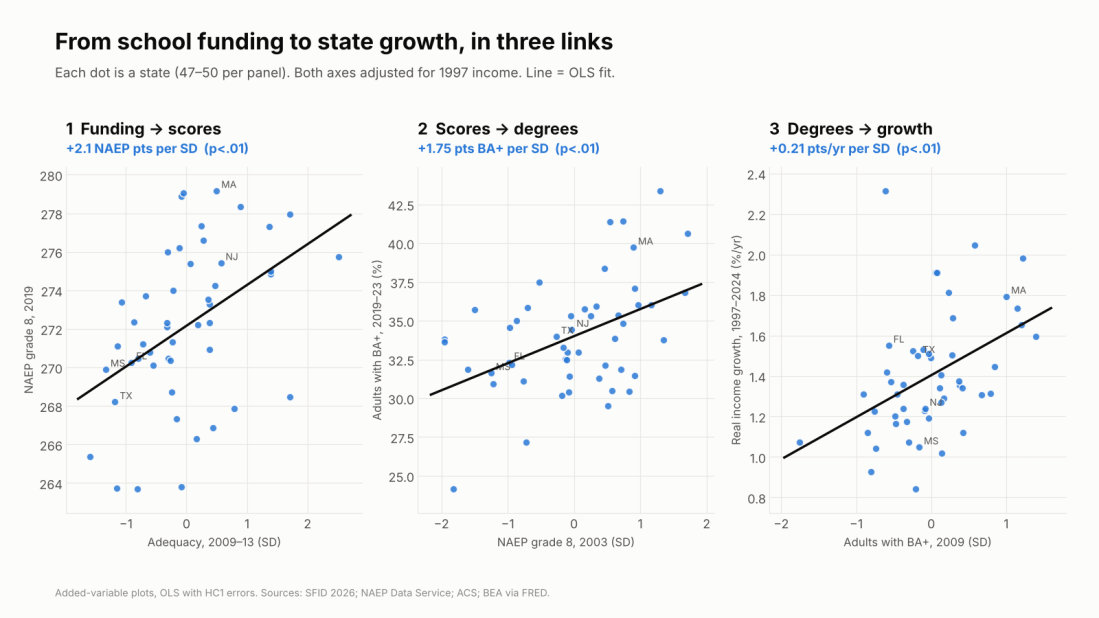
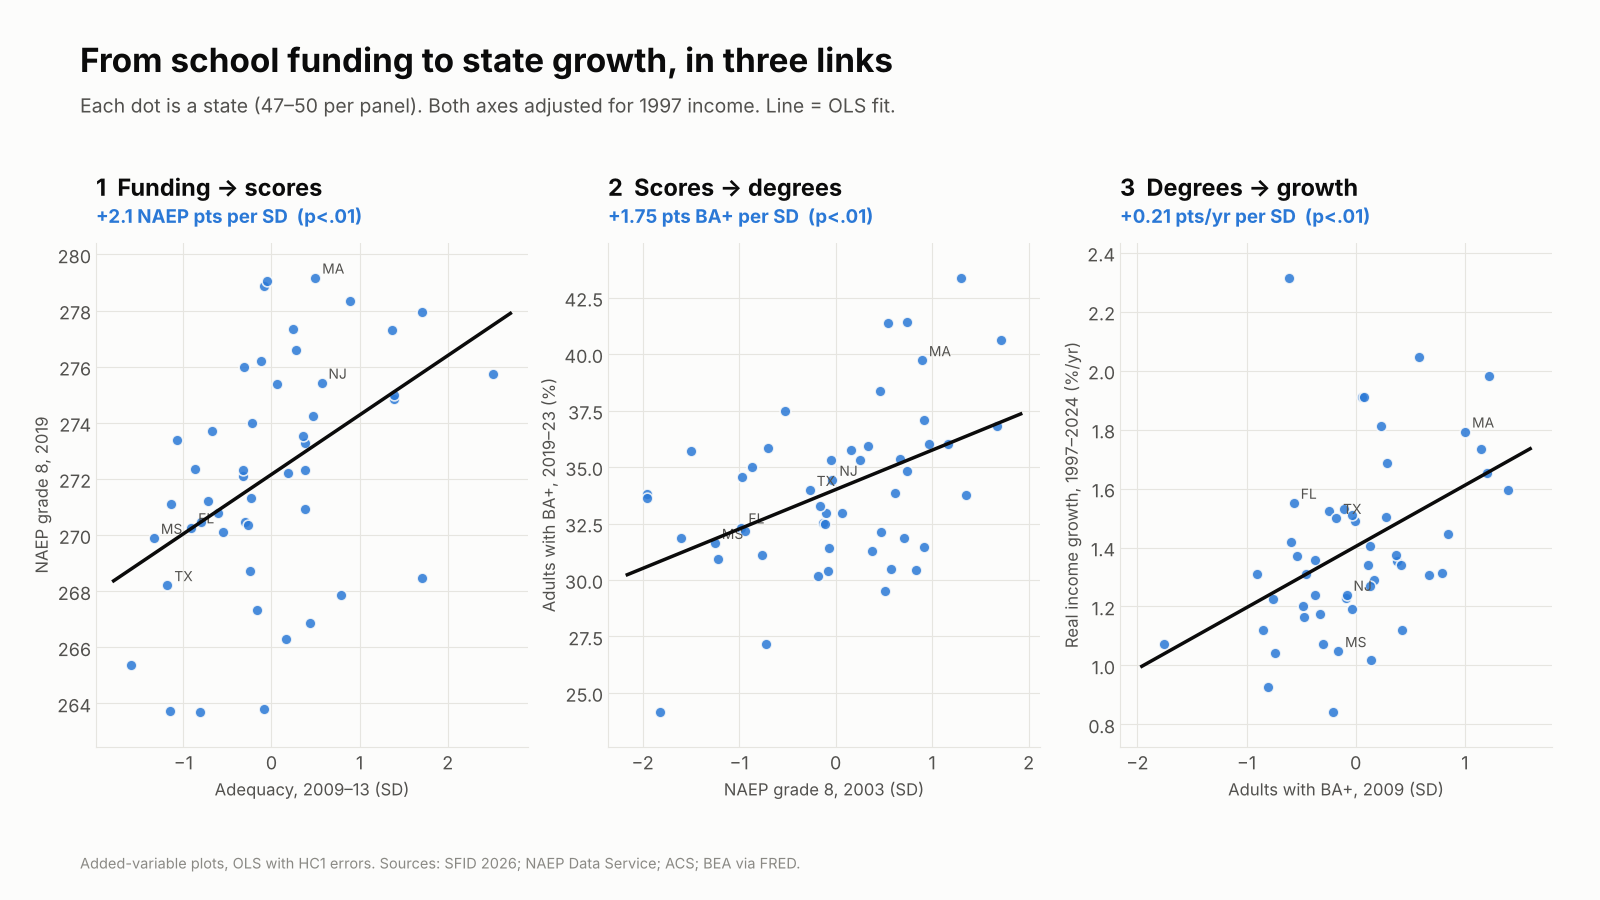
Here’s what I find across the 50 states. Count the school dollar the usual way, adjusted only for teacher wages, and it tells you nothing useful about economic growth since the 1990s. If anything, it points the wrong way. Count it against what it actually costs to build skills, given the kids a state serves, and the human capital chain appears: adequate funding goes with higher 8th-grade scores, higher scores with more college-educated adults, and more college-educated adults with faster income and GDP growth.
The numbers, per standard deviation across states, holding 1997 income constant:
Funding → skills: about +2 NAEP points in 8th grade (2019), +1.2 for low-income students, and a 1.5-point smaller gap between them and their peers.
Skills → degrees: +1.75 points more adults with a BA in states that scored higher in 2003.
Degrees → growth: +0.21 points a year faster real income growth and +0.43 points a year faster GDP per capita growth over 1997–2024.
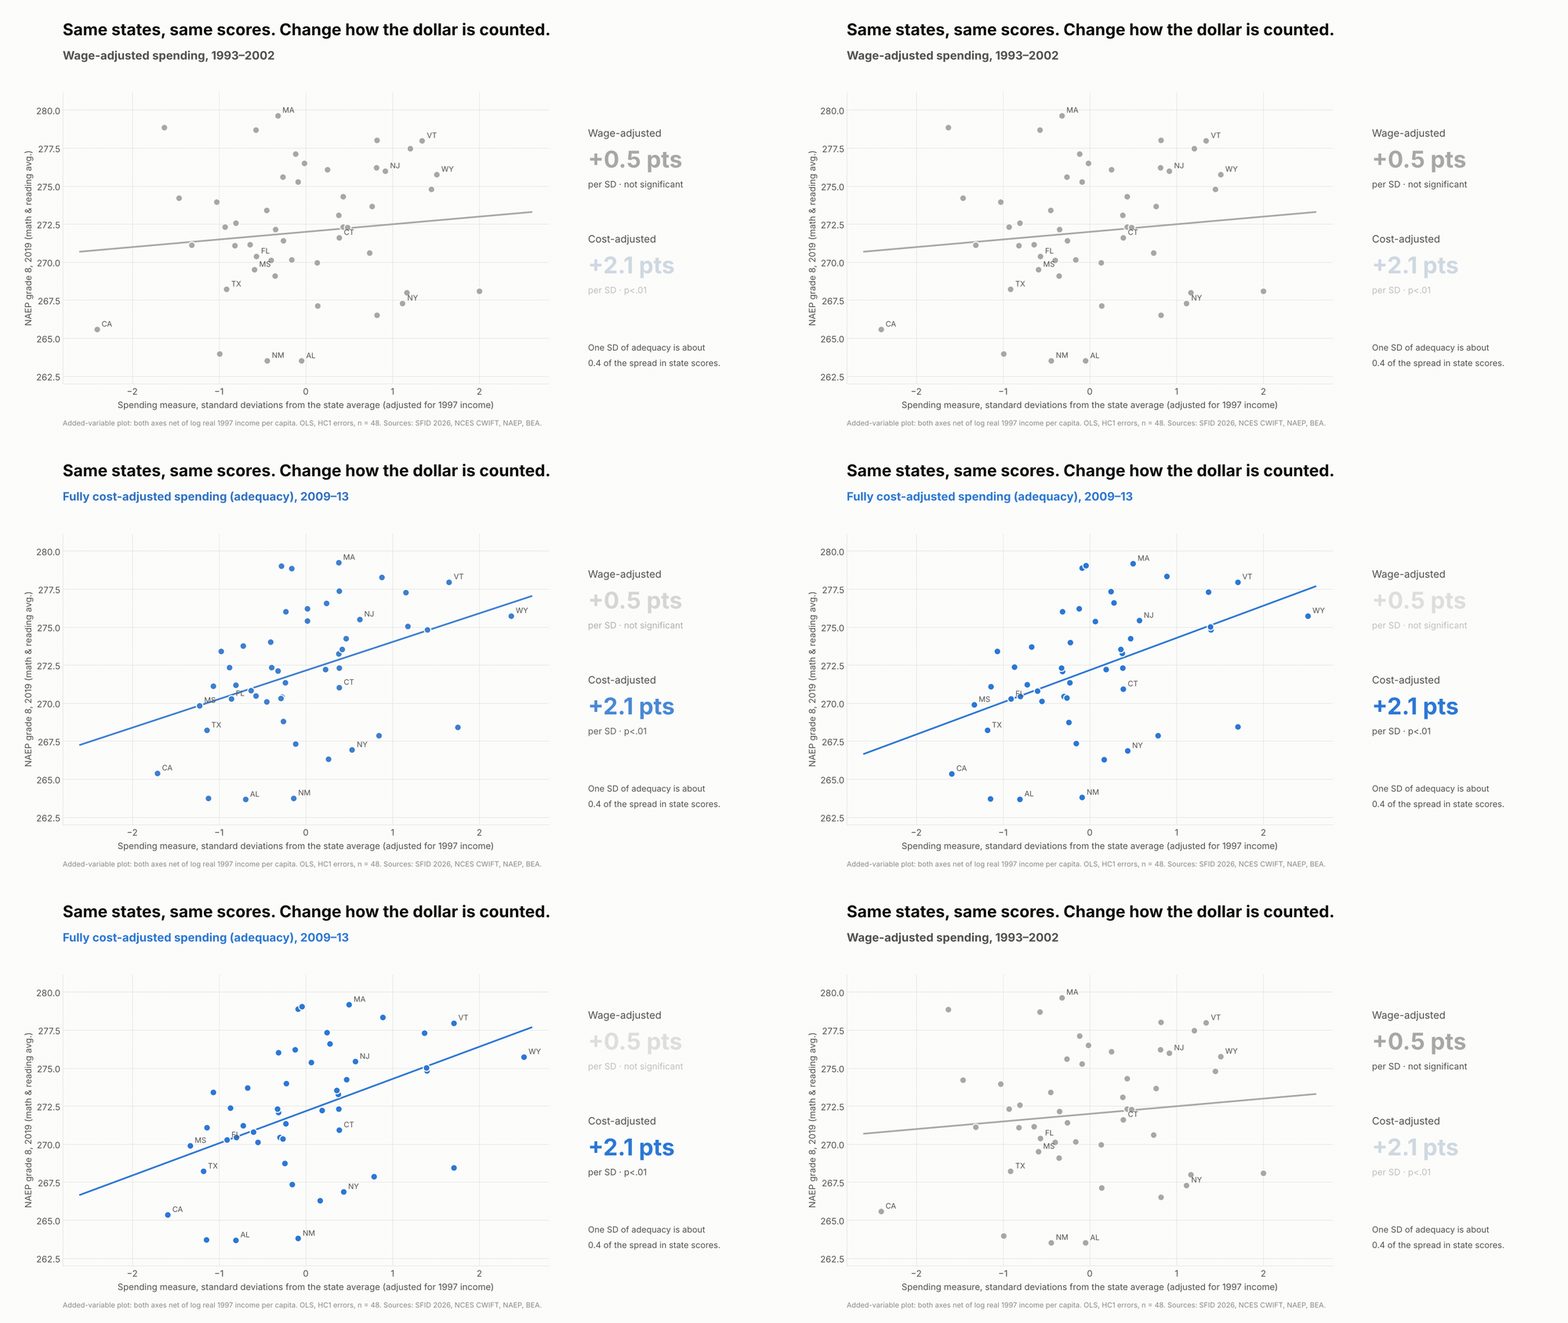
Put the wage-adjusted dollar and the cost-adjusted dollar in the same model and they split: adequacy predicts +0.39 points a year faster income growth, wage-adjusted spending −0.31. Same states, same years, opposite answers. The difference is whether you counted cost.
Schools are a human capital investment, and the world knows it pays
Years of school pay. Harry Patrinos and George Psacharopoulos have spent decades compiling returns to schooling. Their 2018 review pulls together 1,120 estimates from 139 countries and finds an average private return of about 9% per year of schooling (Psacharopoulos & Patrinos, 2018). Their 2025 follow-up looks only at causal estimates, 182 of them from 55 countries, and the return goes up, to 9.7%, about 38% higher than the correlational estimates (Patrinos & Psacharopoulos, 2025).
Learning pays more. One standard deviation higher test scores raises earnings about 15%, roughly one and a half times the value of an extra year of school (Patrinos & Psacharopoulos, 2025). Among adults in 23 countries, a standard deviation of numeracy is worth 18% in wages, and the U.S. pays the most for skills, at 28% (Hanushek et al., 2015). With harmonized learning data for 164 countries, human capital explains one-fifth to one-half of income differences across countries (Angrist, Djankov, Goldberg & Patrinos, 2021).
And it can be lost. Pandemic closures cost students about 0.17 of a standard deviation, half a year of learning (Patrinos, Vegas & Carter-Rau, 2022). The World Bank’s new Human Capital Index Plus puts the U.S. at 252 out of 325, below the high-income average and well behind Australia’s 270 (World Bank, 2026).
Here’s the gap. This literature measures human capital outputs with great care. Its school inputs are usually just spending per pupil, adjusted at most for prices. If schooling is an investment, the right question is whether a state spends enough to produce a given level of skills with the students it actually has. That is a cost question.
Four ways to count a school dollar
There are four common ways to count a school dollar, each correcting for more than the last: nominal; inflation-adjusted; labor-cost-adjusted, using a wage index like NCES’s CWIFT; and fully cost-adjusted, comparing spending with what it would cost to reach a common outcome goal given wages, scale and, above all, student needs. Only the fourth asks whether the money is enough for the job. That is what the School Finance Indicators Database’s National Education Cost Model measures. I’ve made this case in Why “Cost” Matters and Efficiently Mediocre.
Brookings’s state-level report (Reber & Goodman, 2025) stops at number three. Student need goes in as a control variable, not as a cost. That treats a dollar spent on a high-poverty student body as worth the same as a dollar spent on a low-poverty one, then controls away the very poverty that makes those dollars unequal. (See Mark Weber’s NEPC review.)
Same states, same scores. Change how the dollar is counted. Both axes adjusted for 1997 income.
The human capital chain: investment → skills → degrees → growth
The setup is simple. Take state economic outcomes over 1997–2024 from BEA, and compare them with K-12 conditions earlier in the period: wage-adjusted spending from 1993–2002, NECM adequacy from 2009–13, NAEP from 2003, and adult BA attainment. Control for each state’s real income in 1997 so rich states don’t win just for starting rich. Everything is per standard deviation across states, with robust standard errors.
Link 1: investment → skills. A standard deviation of adequacy goes with about 2.1 NAEP points on the 2019 state average, +1.2 for low-income students, and a 1.5-point smaller gap. Wage-adjusted spending: +0.5, not significant. The adequacy link holds with the Northeast dropped (+2.2).
Link 2: skills → degrees. States whose 8th graders scored a standard deviation higher in 2003 have 1.75 points more adults with a BA today, and they added about half a point more BA holders between 2009 and 2024 as those kids grew up.
Link 3: human capital → growth. A standard deviation more BA holders in 2009 goes with 0.21 points a year faster real income growth and 0.43 points faster GDP per capita growth. Higher 2003 NAEP goes with +0.12 and +0.23. Low-income students’ scores predict growth just as well (+0.14 and +0.21), and those estimates survive dropping the energy and resource states.
Each dot is a state. Both axes adjusted for 1997 income; lines are OLS fits.
How the state numbers stack up against the world
States differ far less than students do. A standard deviation across states on 2003 NAEP is 6.5 points, about a sixth (0.17) of a student-level standard deviation. Scale the international estimates by that and the state results land right where you’d expect:
Global benchmark, per student SD
Implied for 1 state SD
What I find
Skills → GDP per capita growth
+1.3 to +1.86 pts/yr
+0.22 to +0.31 pts/yr
+0.23 pts/yr
Skills → earnings
+15% (Patrinos & Psacharopoulos); +28% in the U.S. (Hanushek et al.)
The growth estimate sits inside the range the cross-country studies predict; +0.23 points a year compounds to a GDP per capita level about 6% higher over 27 years. The funding estimate, per dollar, is about a third of the causal estimate from U.S. school finance evaluations: modest, not inflated. These are rough conversions across different tests, but nothing here is out of line with what the human capital literature would lead you to expect.
Diverging states, diverging futures
Here’s where I want to be blunt. The United States does not have one human capital system. It has fifty, and they are sorting into leaders and laggards.
Attainment is diverging. States with more college graduates in 2009 added more of them by 2024. The five most-educated states went from 36% to 46% of adults with a BA; the five least-educated went from 20% to 27%. The gap widened from 16 to 19 points.
The economic extremes are pulling apart. Massachusetts’s GDP per capita was 1.6 times Mississippi’s in 1997 and 2.2 times in 2024. For most of the twentieth century, poorer states caught up with richer ones; Ganong and Shoag show that convergence has slowed dramatically over the past three decades.
The skills gap between states is an international-scale gap. In the most recent state-by-country comparison, the 2011 NAEP–TIMSS linking study, Massachusetts’s 8th graders scored 561 in math, behind only five of 47 education systems, the closest being Japan. Alabama scored 466, statistically tied with Turkey and Armenia. That 95-point spread is close to a full international standard deviation, a gap that across countries goes with 1.3 to 1.9 points of annual growth.
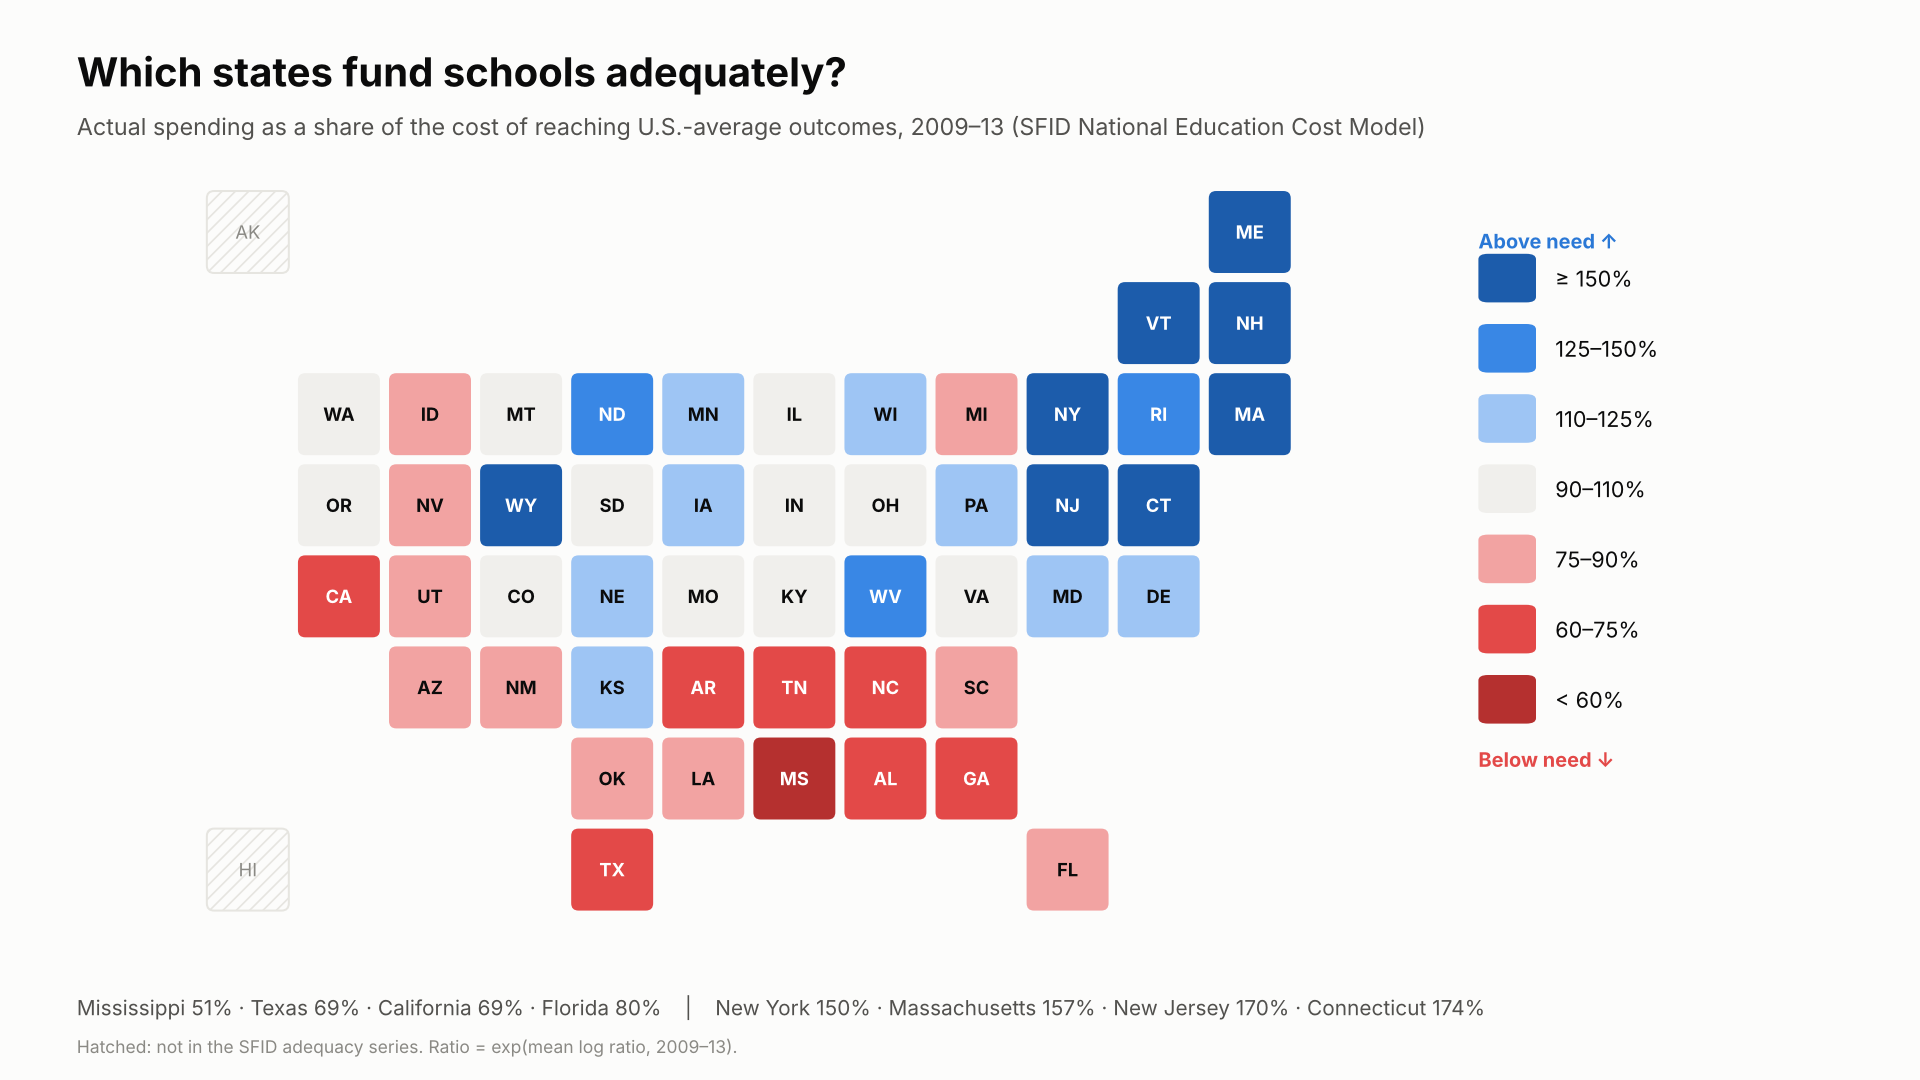
The funding gaps behind it are persistent. States’ adequacy positions barely move over a decade (correlation 0.92). Mississippi spent about half of what its students needed in 2009–13 and was still $9,300 per pupil short in 2021–23, and $25,100 short in its highest-poverty districts.
Actual spending as a share of the cost of reaching U.S.-average outcomes, 2009–13 (SFID National Education Cost Model).
The knowledge economy concentrates where human capital is. Research universities, technology industries and scientific talent cluster in states with deep pools of skilled workers, and those states draw more of them. If current funding patterns hold, the leading states will keep compounding that advantage. The lagging states will keep producing fewer skilled workers, attracting fewer knowledge industries, and losing many of the graduates they do produce.
Let me be precise about how far this goes. No state is about to become a developing country in income. Mississippi’s GDP per capita, $41,300 in 2024, is far above most of the world’s, propped up by a national labor market and federal transfers. But on skills, our lowest-performing states already score alongside upper-middle-income countries such as Turkey and Armenia, while our highest-performing states compete with Japan. Skills set the ceiling on what an economy can become. A country that draws its scientists, engineers and entrepreneurs from a handful of states is leaving most of its human capital on the table. Because states and localities supply most K-12 funding, the path forward for American economic and scientific development runs through state investment in human capital, measured against what it actually costs to build it.
A note on California. California sits near the bottom of the map above, which shows 2009–13, and it still falls short of adequate funding today, especially in its highest-poverty districts. But in my analyses, no state has improved more since 2009. As I showed in The Red State Miracle That Wasn’t, California’s highest-poverty districts went from 65% to 79% of adequate funding between 2009 and 2024, most of it after the Local Control Funding Formula began phasing in after 2013, though they remain about $5,600 per pupil short. In the state data behind this post, California climbed from 45th of 48 states on adequacy in 2009–13 to the middle of the pack by 2021–23. California is digging out of a very deep hole. The 1978 tax revolt, Proposition 13, capped property taxes at 1% of assessed value and gutted the local revenue that had supplied about two-thirds of school funding.
What this does and doesn’t show
These are cross-state associations, not causal estimates. College graduates move, so a state’s BA share partly reflects whom it attracts. Adequacy is measured in 2009–13, inside the growth window, so faster-growing states may simply have afforded better-funded schools. And required cost reflects student need, which also lowers scores. The paper documents each of these and the robustness checks behind them.
But the stronger designs point the same way. Jackson and Mackevicius (2024) pool U.S. school finance evaluations and find that $1,000 more per pupil for four years raises test scores by 0.032 SD and college-going by 2.8 points. Jackson, Johnson and Persico find that sustained spending increases raise adult wages. And the international lesson from Patrinos and Psacharopoulos is that causal returns to education run higher than correlational ones. If anything, cross-state associations like mine are more likely to understate the human capital return than to invent it.
The bottom line
Around the world, nobody serious doubts that human capital pays. A year of school is worth about 9–10% in earnings, a standard deviation of learning about 15%, and a country’s skills go a long way toward explaining its growth. The U.S. debate gets stuck because it measures the investment badly. Measure it against the cost of building skills, and the return shows up across the states just as it does across countries: funding to skills, skills to degrees, degrees to growth.
The states are not converging; at the top and bottom they are pulling apart. Whether America remains an economic and scientific leader depends on whether every state invests in the human capital of all its children, and especially the children who rely most on public schools, or whether we settle for a few states that lead and many that fall further behind.
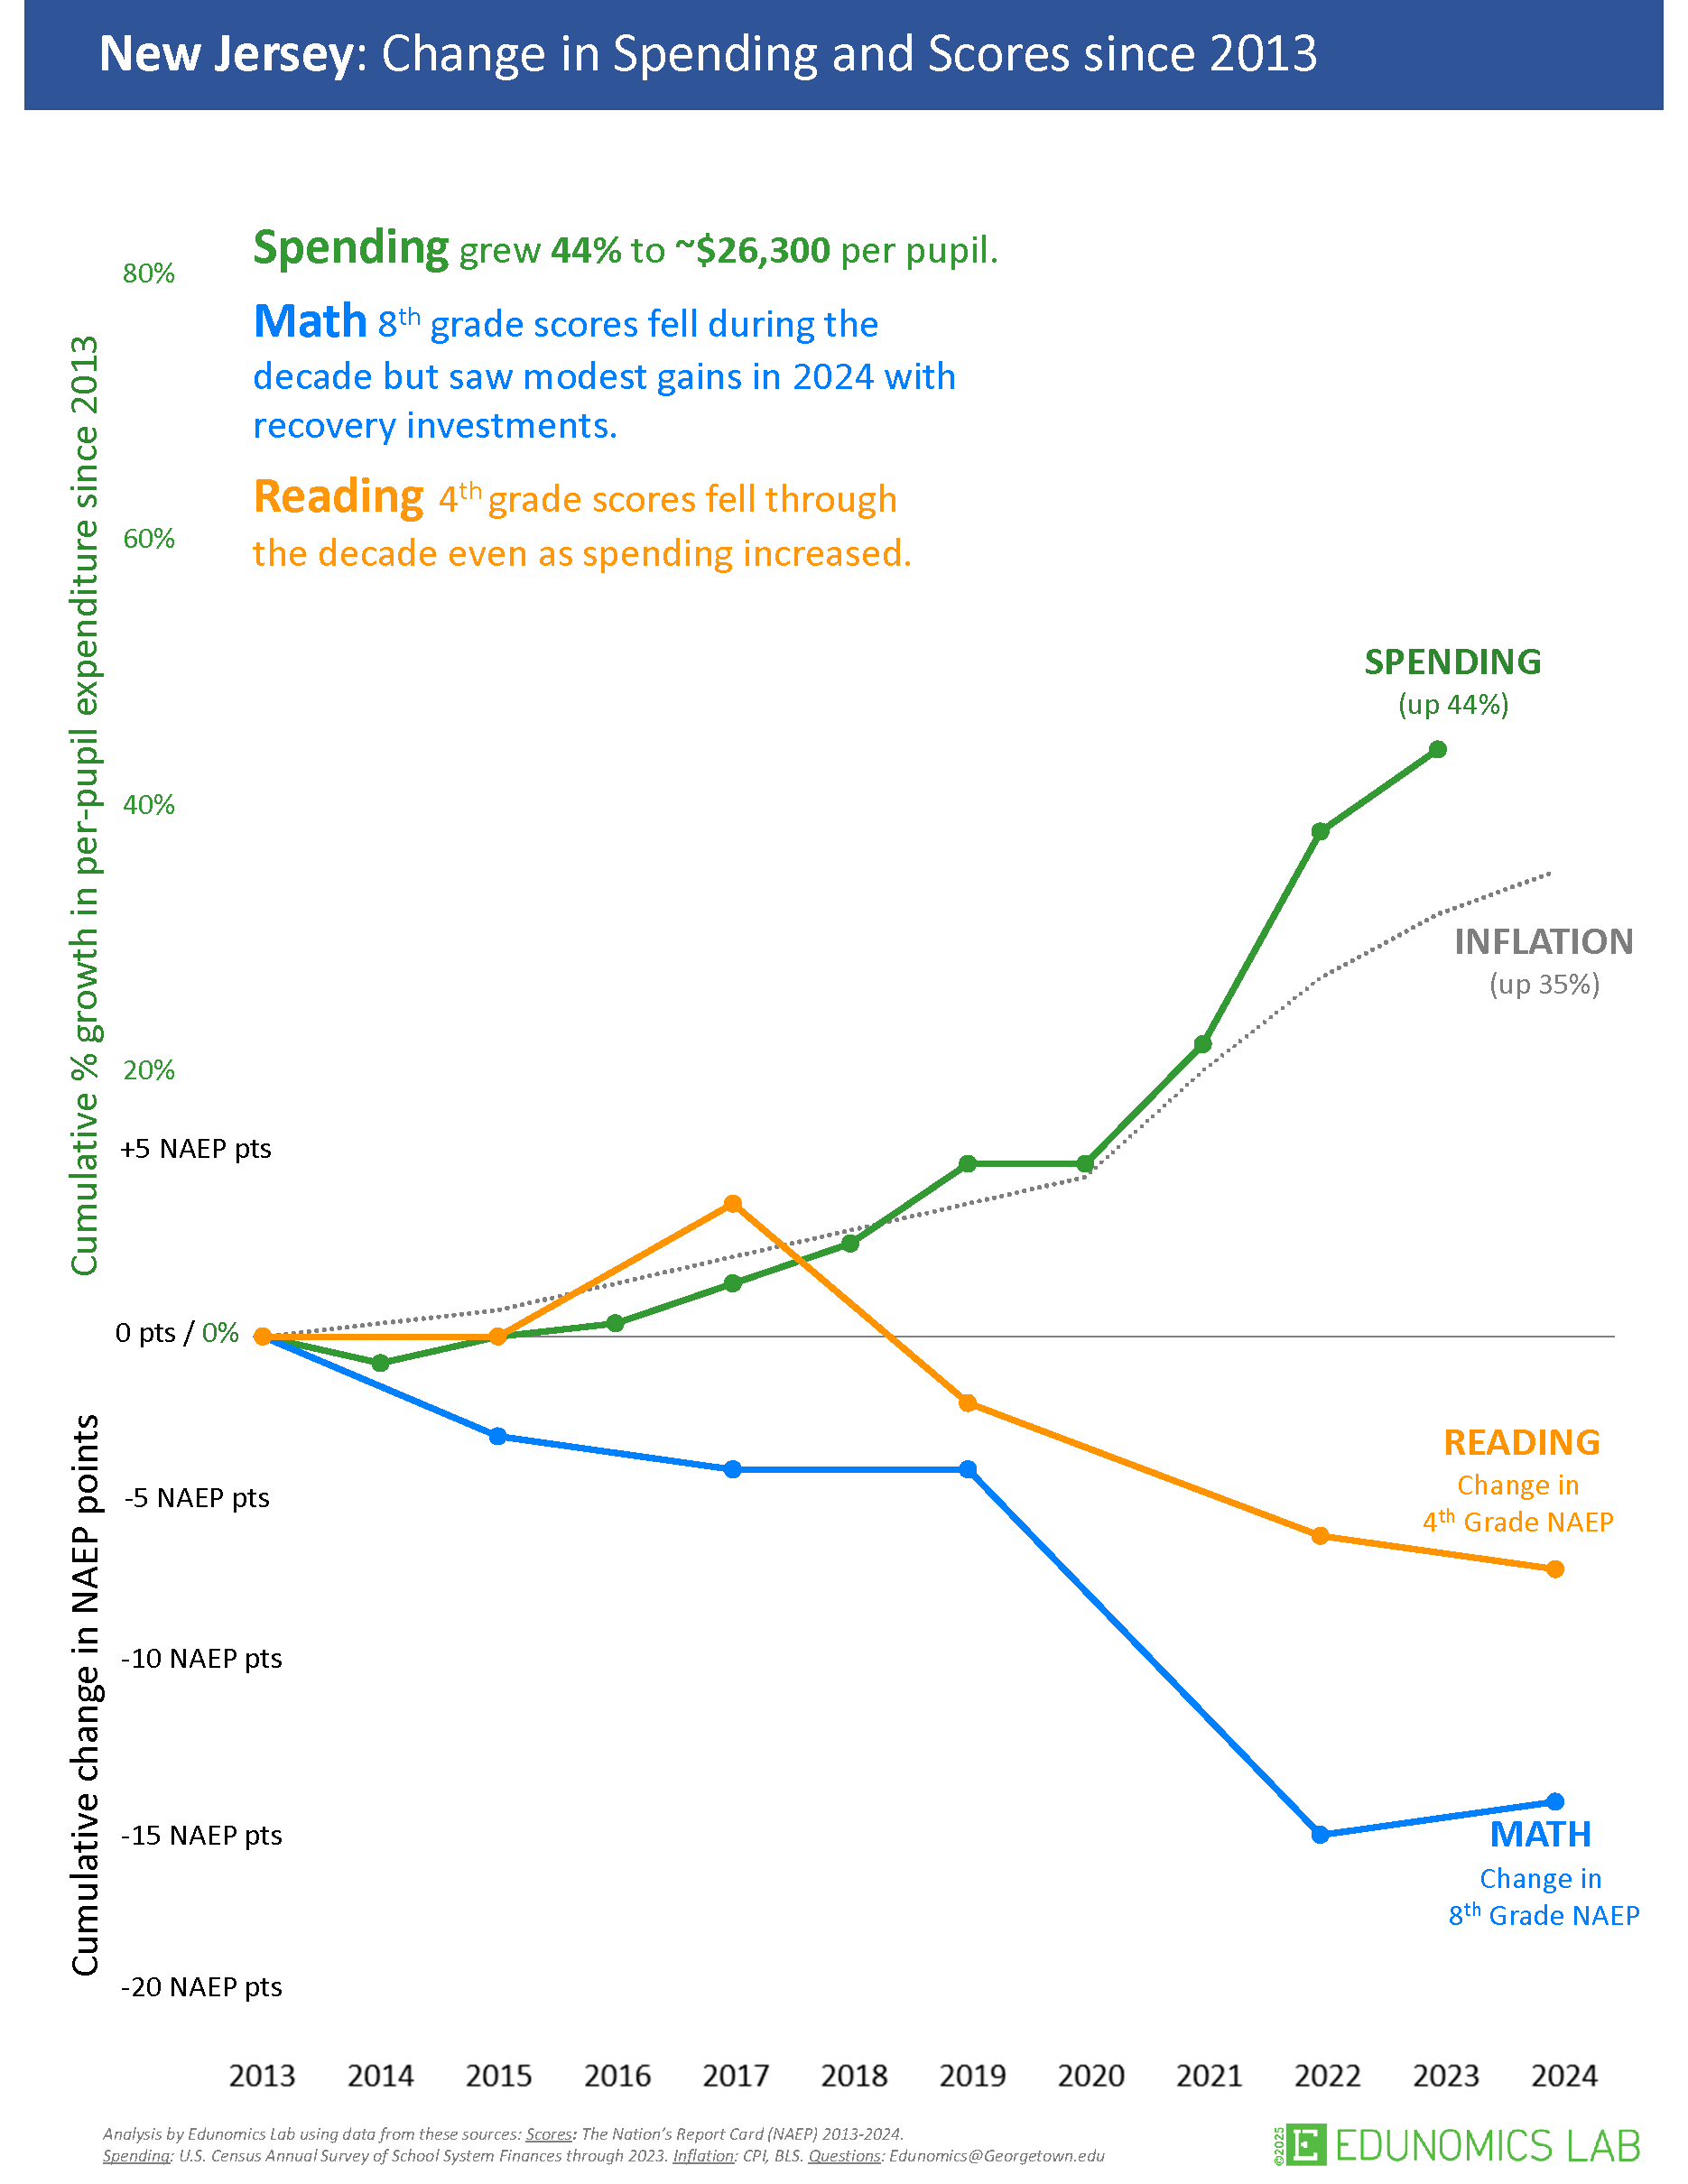
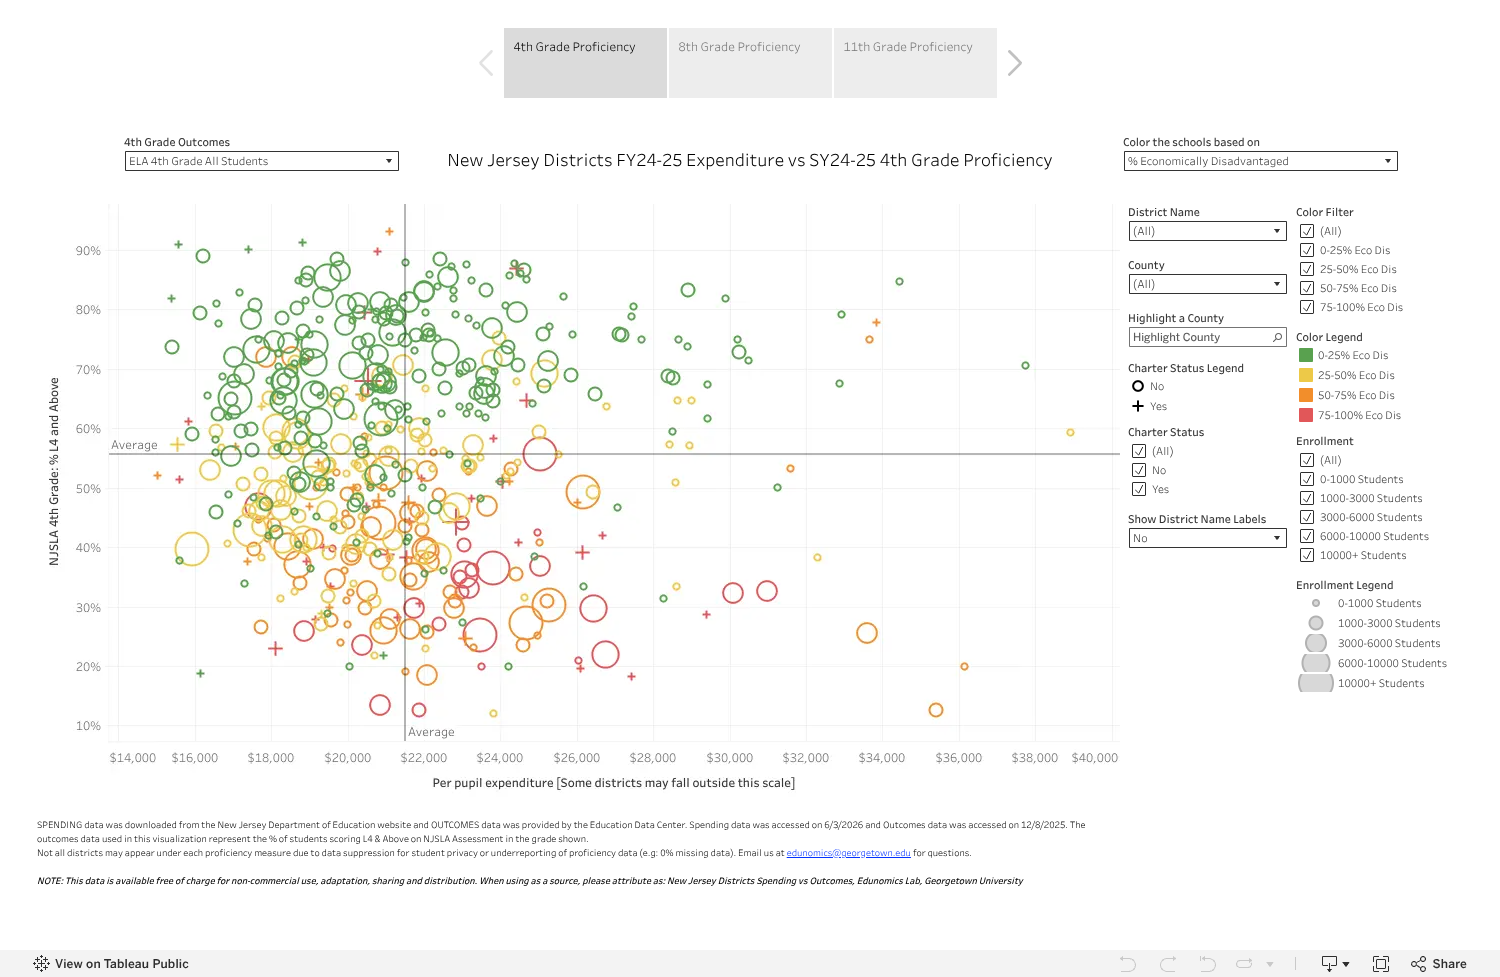
Two graphics from Marguerite Roza’s Edunomics Lab at Georgetown have been showing up in one state after another. Edunomics publishes a version of each for every state. One shows spending rising and NAEP scores falling since 2013. The other scatters every district by spending and test scores and finds no pattern. Wherever they land, they deliver the same message: the state has poured money into its schools and gotten nothing for it.
It’s only a matter of time before they show up in New Jersey. The New Jersey versions are already sitting on Edunomics’ website, ready to be dropped into testimony, op-eds and budget hearings. So here, in advance, is what’s wrong with them, using New Jersey’s own data.
Let me be blunt. Neither graph belongs in a serious policy conversation. Both are built so they cannot show anything other than “money doesn’t matter.” They are far more likely to misinform legislators, judges, school board members and the public than to inform them. Anyone who puts them in front of New Jersey policymakers as evidence about SFRA should be challenged, directly and publicly.
And none of this is new. I’ve been documenting the same moves in Roza’s work since 2009 (Seventeen Years of Roza-Tinted Glasses). New logo. Same tricks.
Exhibit A: the “long-term trend”
Here’s Edunomics’ New Jersey trend graph (source). Spending up 44% to about $26,300 per pupil. Math and reading down.
Edunomics Lab, “New Jersey: Change in Spending and Scores since 2013.” Reproduced for purposes of critique.
Every design choice in this graph pushes in one direction:
The starting year. The clock starts in 2013, the one year that all but guarantees spending up and scores down. More on why that’s deliberate in a moment.
Nominal dollars. The 44% is nominal. The graph’s own inflation line is up 35%. That leaves roughly 7% real growth over a decade, well under 1% a year, and spending tracks inflation almost exactly until the federal pandemic relief years of 2021–2023.
The wrong deflator, and no cost. The CPI is not the price of teachers in New Jersey’s labor market. Nothing here asks who the kids are or what their outcomes cost.
Mismatched years and scales. Spending stops in 2023, scores run through 2024, and percent growth and NAEP points share one axis at an arbitrary exchange rate. Rescale either one and the “divergence” grows or shrinks at will.
No comparison. NAEP fell nationwide after 2019, overwhelmingly in the pandemic years. One state’s spending next to a national decline tells you nothing about whether New Jersey’s dollars mattered.
Why 2013 is intentionally deceitful
“Deceitful” is a strong word. Here’s why it fits.
2013 is where the scores topped out. Anyone who works with NAEP knows 2013 is the point where scores nationally leveled off and started to turn down. Start there and almost any state shows flat or falling scores afterward, no matter what it spent.
2013 is where the spending cuts hit bottom. By 2013 the recession-era cuts had run their course and per-pupil spending sat near the bottom of the trough. Start there and almost any state shows spending “rising,” even when it’s just recovering lost ground and keeping up with inflation.
Put those together and the conclusion is built in. Top of the scores, bottom of the spending: the divergence is manufactured by the baseline. Edunomics’ tool makes this graph for every state, and it shows the same picture in nearly all of them. That’s the tell. The conclusion comes from the starting year, not from anything about New Jersey.
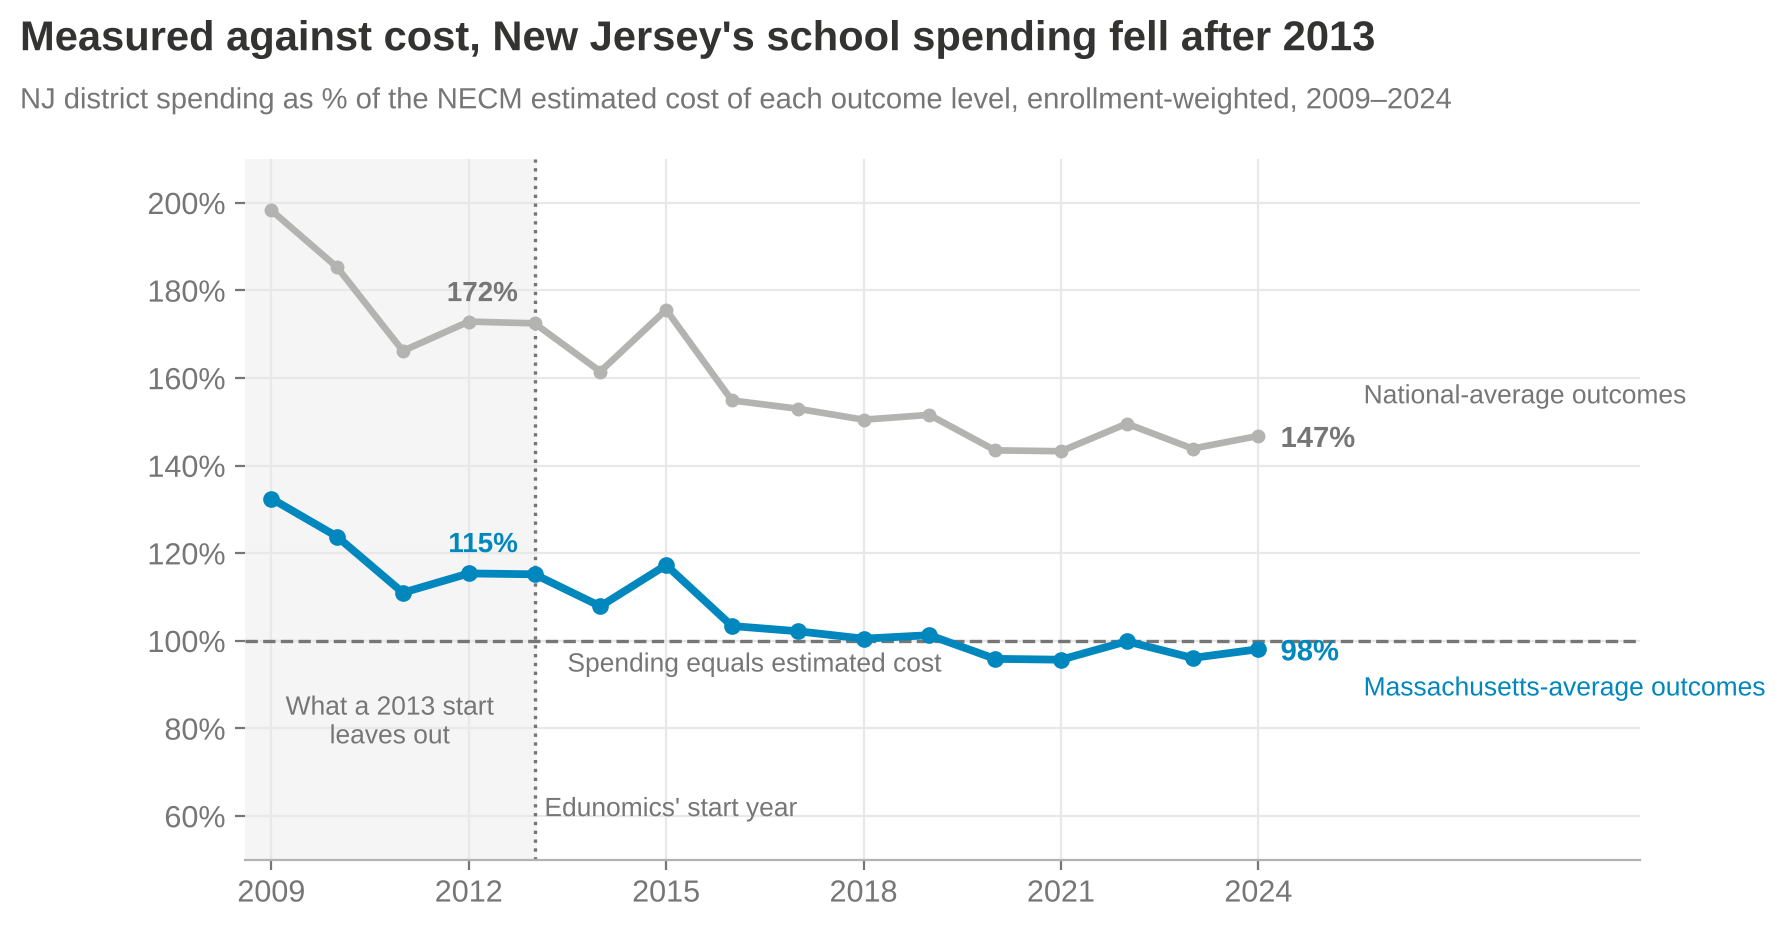
Earlier years were available and left out. State NAEP in reading and math goes back to 2003 for every state. Start in 2009 or 2011 and you’d see what happened first in New Jersey: spending fell from 132% to 111% of the estimated cost of Massachusetts-average outcomes in two years. A baseline that hides the cuts is a choice.
They’ve been told, repeatedly and in public. I’ve laid this out on social media, on this blog and in a video critique. The 2013 start stays. A misleading choice made once can be a mistake. Keeping it after being told exactly why it misleads is not.
Measure spending against what outcomes actually cost and the story flips. New Jersey’s spending fell from 115% of the estimated cost of Massachusetts-average outcomes in 2013 to 98% in 2024, and from 172% to 147% of the cost of national-average outcomes. The system got less progressive too: districts with 30% child poverty went from 18% more state and local revenue per pupil than districts with none to 9% more, and from 9% more teachers per pupil to 17% fewer.
School Finance Indicators Database, NECM district data merged with SEDA outcomes, 449 New Jersey districts.
Exhibit B: the “clouds of doubt”
Edunomics’ New Jersey scatter plots each district’s 2024–25 per-pupil expenditure against 2024–25 NJSLA proficiency, crosshairs at the averages (source). Their companion worksheet tells users to go find the schools that spend more but get lower outcomes than similar peers.
Edunomics Lab, “New Jersey Districts FY24-25 Expenditure vs SY24-25 4th Grade Proficiency” (Tableau Public). Reproduced for purposes of critique, with attribution as Edunomics requests.
Look at their own colors. The highest-poverty districts, in red and orange, cluster below average proficiency, many of them to the right of average spending. The graph literally displays the pattern that cost explains, then invites you to read it as waste.
Spending is what a school spends. Cost is what it would take to reach a given outcome with the kids it actually serves, in the labor market it actually hires from. Efficiency is the gap between the two. No cost, no efficiency claim. A raw scatter can’t tell you anything about waste (Efficiently Mediocre). What it does do is take the districts furthest below what their kids need and paint a target on them.
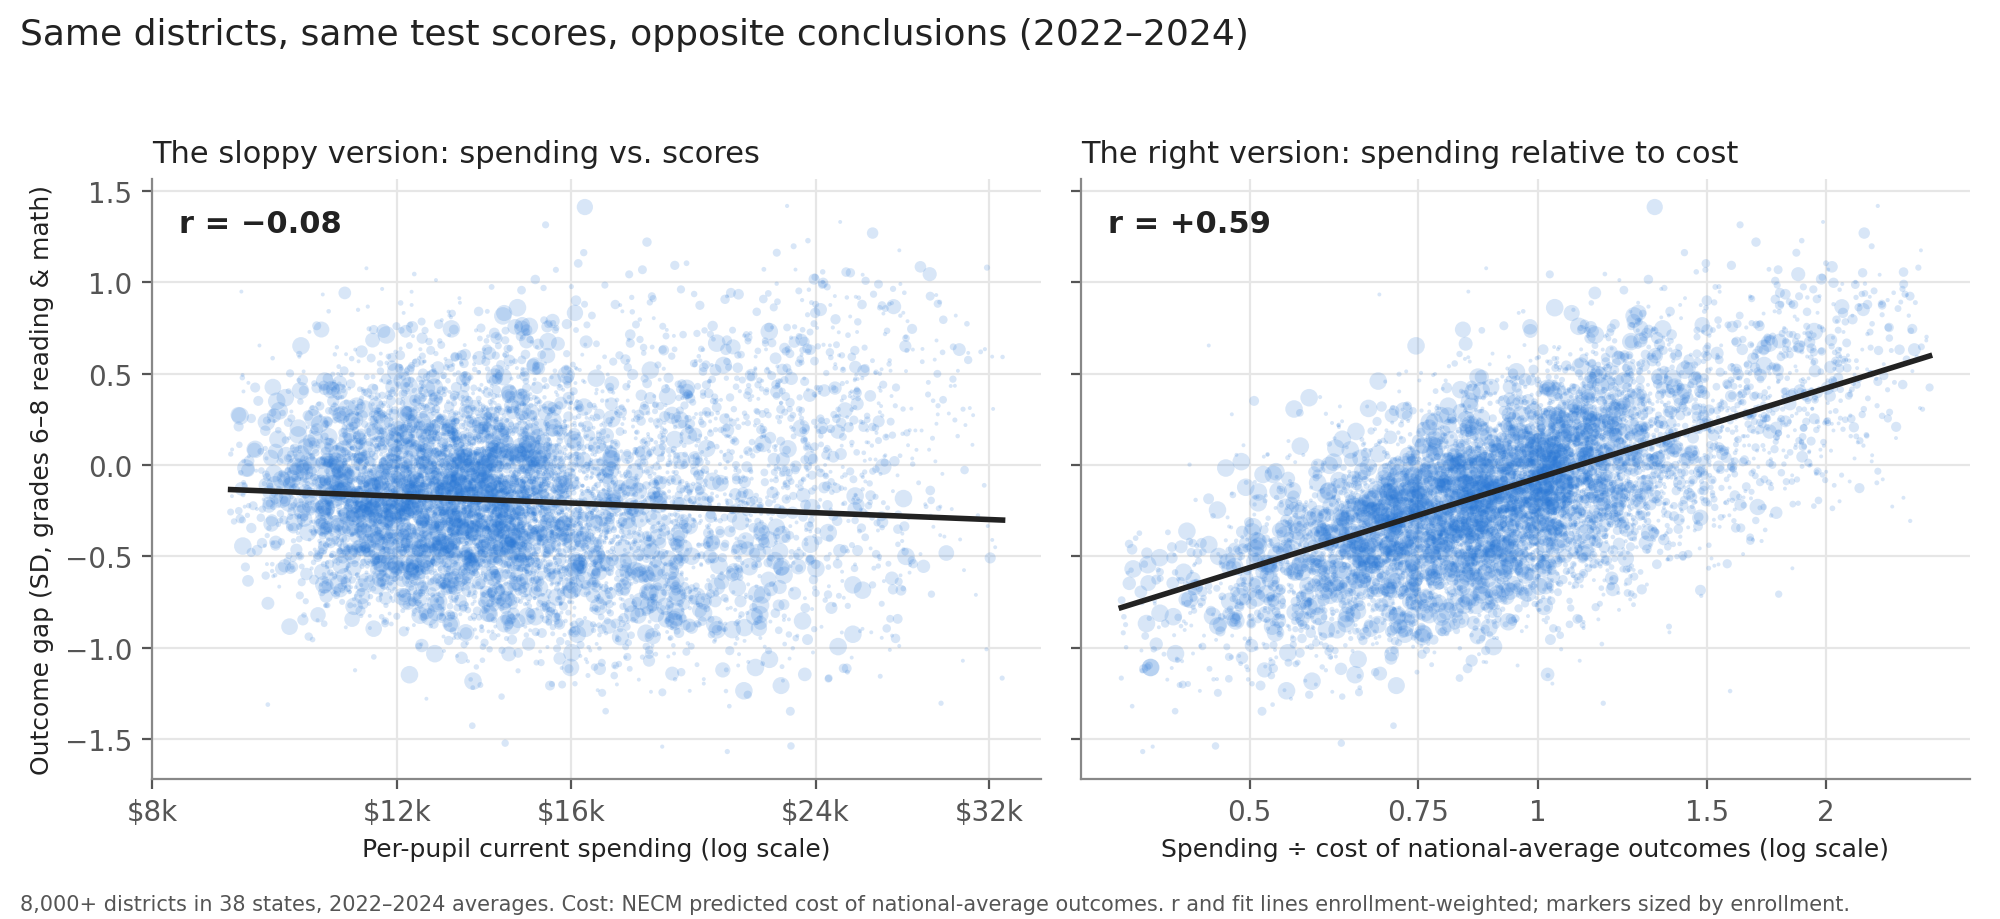
Nationally, same districts, same scores: raw spending and outcomes correlate at −0.08. Spending relative to the cost of national-average outcomes correlates at +0.59.
National Education Cost Model, 8,000+ districts in 38 states, 2022–2024.
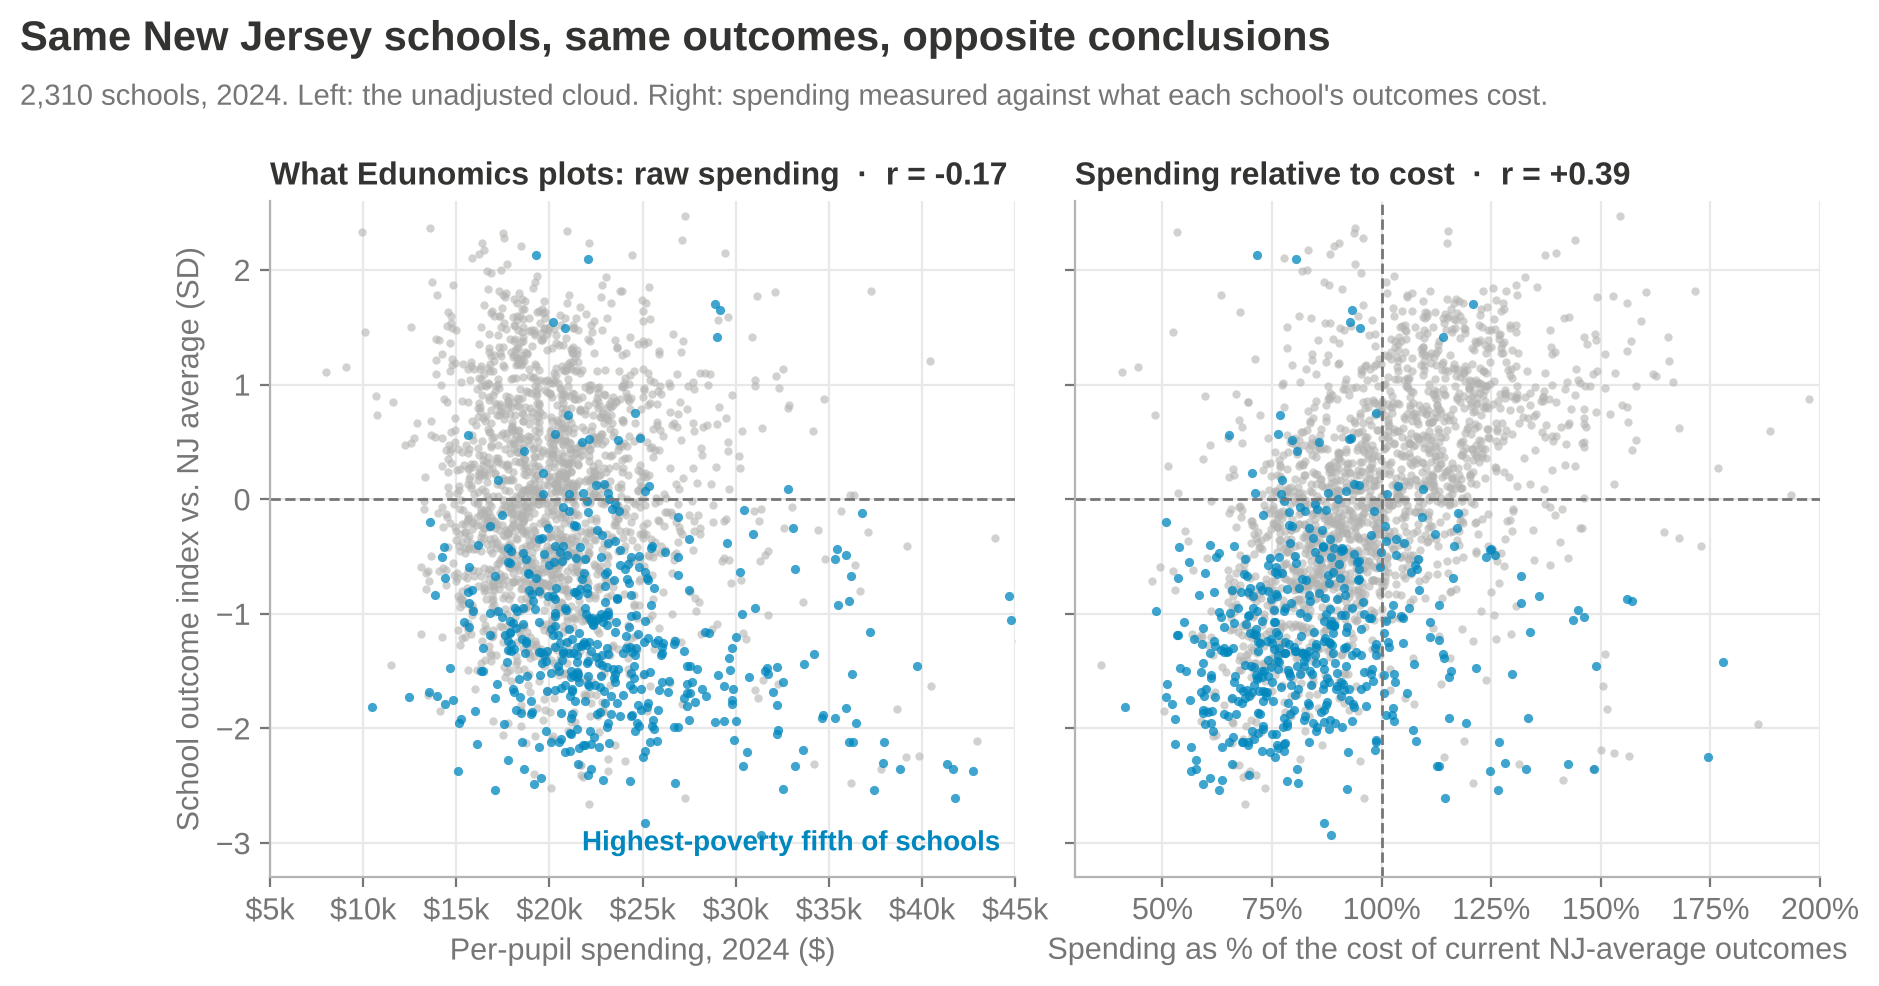
New Jersey’s own school-level cost model shows the same reversal. In 2024, raw spending correlates with outcomes at −0.17. Spending relative to the cost of current statewide average outcomes correlates at +0.39.
New Jersey state-specific school cost model, 2,310 schools, 2024. Blue: highest-poverty fifth of schools.
Here’s why. The highest-poverty fifth of New Jersey schools does spend the most per pupil, about $22,600 at the median. But getting those kids to today’s statewide average outcomes would cost about $28,000. They’re at 82% of cost. The lowest-poverty fifth spends about $20,400 against a cost of $17,700: 114%. Of the schools sitting in Edunomics’ “spends more, scores lower” corner, two-thirds spend less than their outcomes would cost, and their median low-income share is 55%, against 24% statewide.
What New Jersey’s evidence actually says
School Finance Indicators Database, NECM district data merged with SEDA outcomes, 2024.
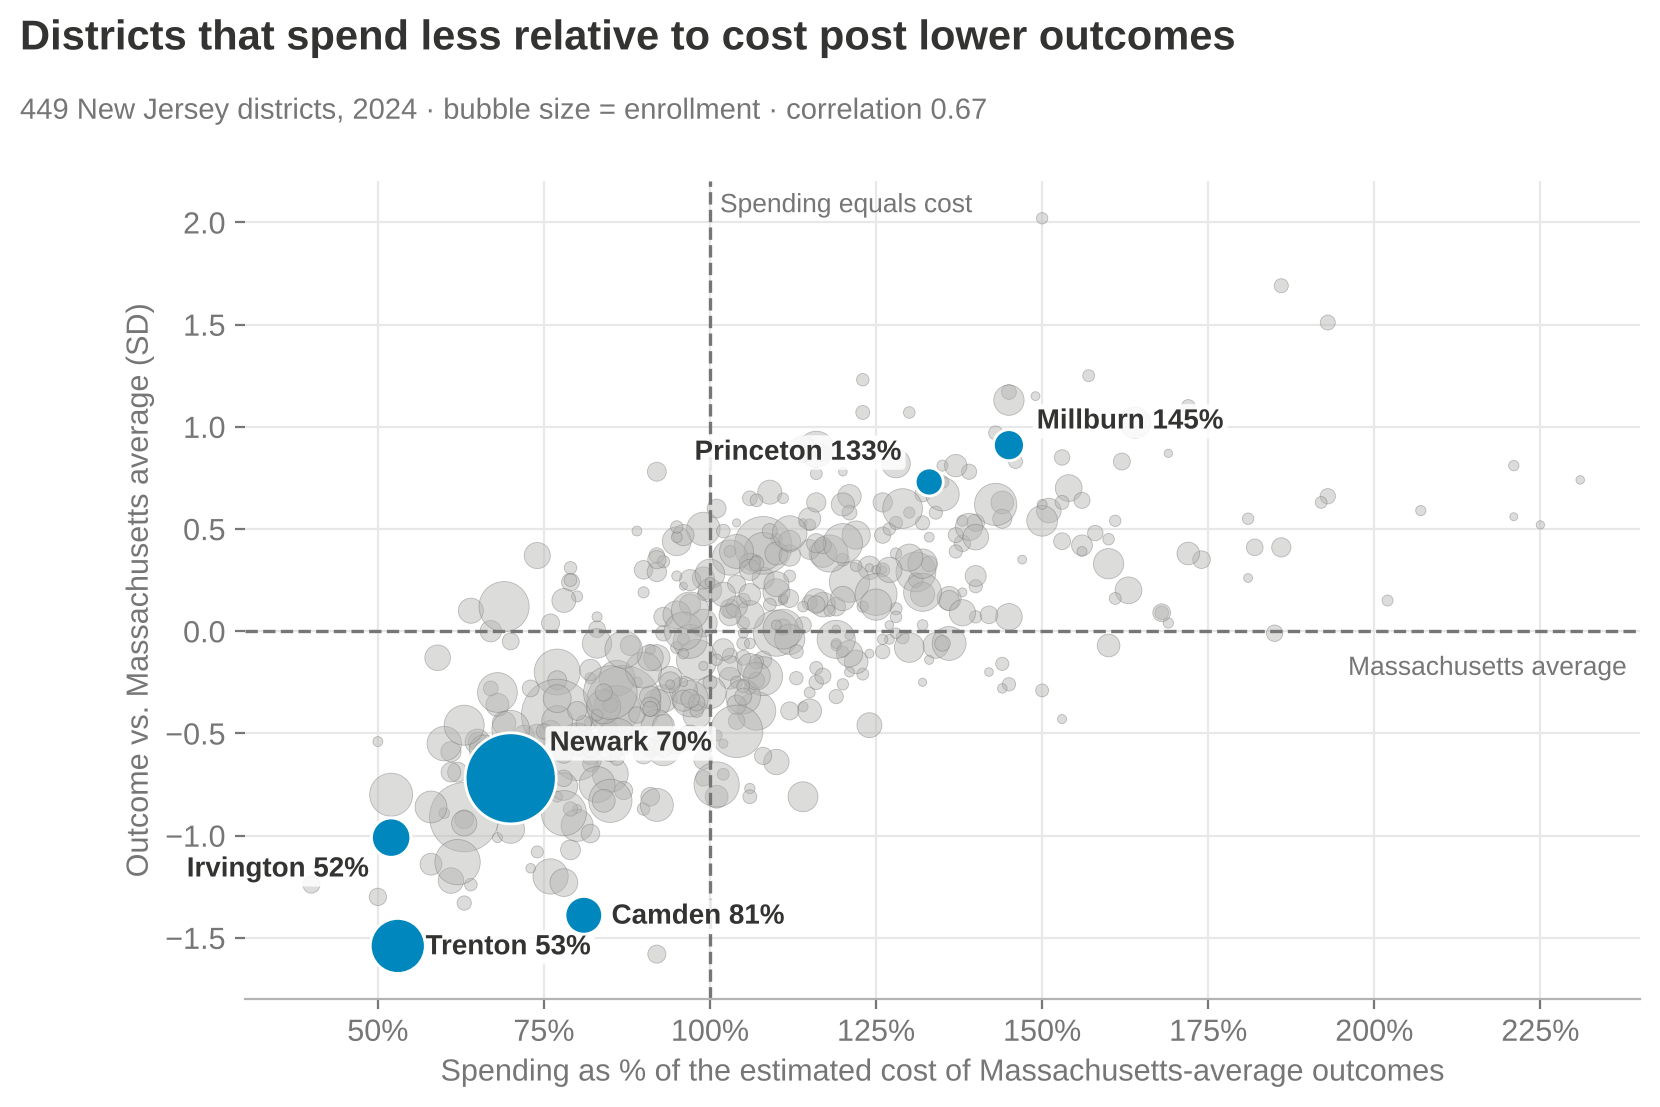
Across New Jersey’s 449 districts, spending relative to cost and outcomes move together (r = 0.67).
Money buys more in New Jersey, not less: within states, the payoff to spending relative to cost is about 1.2 in New Jersey, Connecticut and Massachusetts, against 0.44 in Florida and 0.70 in Texas.
The highest-poverty fifth of districts spent 72% of the cost of Massachusetts-average outcomes in 2024, down from 91% in 2009. The lowest-poverty fifth spent 122%.
Two independent cost models, the NECM and New Jersey’s own school-level model (NJPP, 2025), agree at 0.72 on spending relative to cost and 0.95 on outcomes. Neither shows high-poverty districts swimming in excess resources.
Bottom line
These graphs do not inform New Jersey’s SFRA debate. They misinform it. They shouldn’t be cited in testimony, budget hearings, litigation or school board training. If someone puts them in front of you, ask two questions out loud: Why 2013? And where is the cost adjustment?
Or: if you wouldn’t buy it with your own money, maybe don’t buy it with mine.
I keep hearing that vouchers are the fiscally conservative choice. Competition, markets, money following the child, all that. Fine. Let’s take that seriously. Let’s run vouchers through the same tests a fiscal conservative should apply to any other $5-billion-a-year government program. Not the bumper sticker version of conservatism. Not culture wars. Not anti-woke. The green-eyeshade, show-me-the-return, who-audits-this version.
Florida makes a good test case, because Florida went big, fast. The state spent about $3.9 billion on private school vouchers in 2024–25, up from 12% of its main K-12 funding formula three years earlier to 23%. For 2025–26, the Florida Policy Institute puts total voucher spending at about $5 billion: roughly $3.8 billion through the Family Empowerment Scholarship and another $1.1 billion or so in tax credits for the Florida Tax Credit Scholarship, serving more than half a million students.
Here are five questions any economically conservative legislator should ask before adopting or expanding a program like this.
1. What are we actually buying?
The first rule of spending other people’s money: don’t pay for something that was going to happen anyway. Economists call it a windfall, or an inframarginal subsidy. Conservatives used to call it waste.
Do the math on the average Family Empowerment Scholarship of roughly $7,250. If only 31 of every 100 new users actually switched schools, the state is paying about $23,400 for each student who actually changed sectors. Florida’s public schools spend about $12,700 per pupil. So the “efficient market alternative” costs nearly twice as much per child it actually moves as the “bloated government monopoly” it’s supposed to discipline.
And some share of what’s left gets eaten by price. Douglas Harris and Gabriel Olivier find private school tuition rose 5% to 10% more in states that expanded vouchers than in states that didn’t. Hand a seller a subsidy for its customers and the seller raises the price. That isn’t a left-wing talking point. It’s Econ 101.
2. What’s the return?
Before a business scales a product, it wants evidence the product works. Here the evidence on large statewide voucher programs is not kind. Studies of statewide programs in Louisiana, Indiana, Ohio and Washington, D.C., found academic losses for students who used vouchers to switch to private schools. In Louisiana, math scores fell by about 0.4 standard deviations after one year. (I went through this research in more detail in Red State, Blue State, Round Two.)
In fairness, the best evidence for vouchers comes from Florida itself: the Urban Institute found that the Florida Tax Credit Scholarship, back when it was limited to low-income families, raised college enrollment by about 6 percentage points, mostly at community colleges, with little effect on degree completion. Notice what Florida did with that evidence. It took the one version with a plausible return, a targeted program for low-income kids, and turned it into an open-ended entitlement for families who were already paying tuition. That’s like running a pilot in one store, seeing modest results, and then opening 500 stores in neighborhoods where people already shop somewhere else.
3. What’s the next best use of the money?
This is the question that separates actual fiscal conservatives from people who just like vouchers. Every dollar has an opportunity cost. So what else could Florida buy with $5 billion a year?
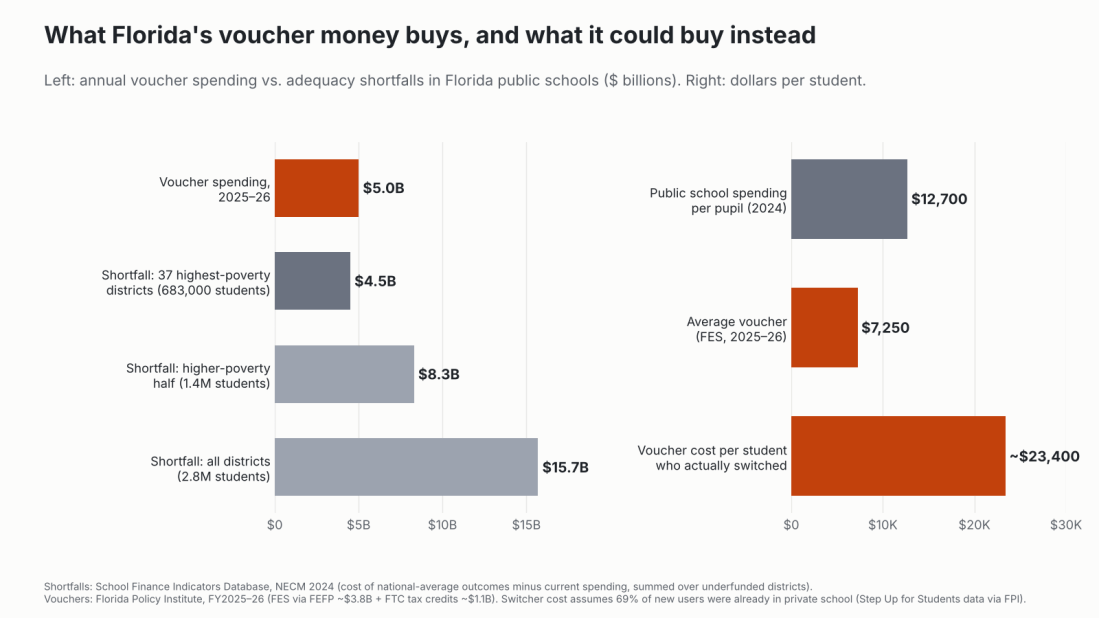
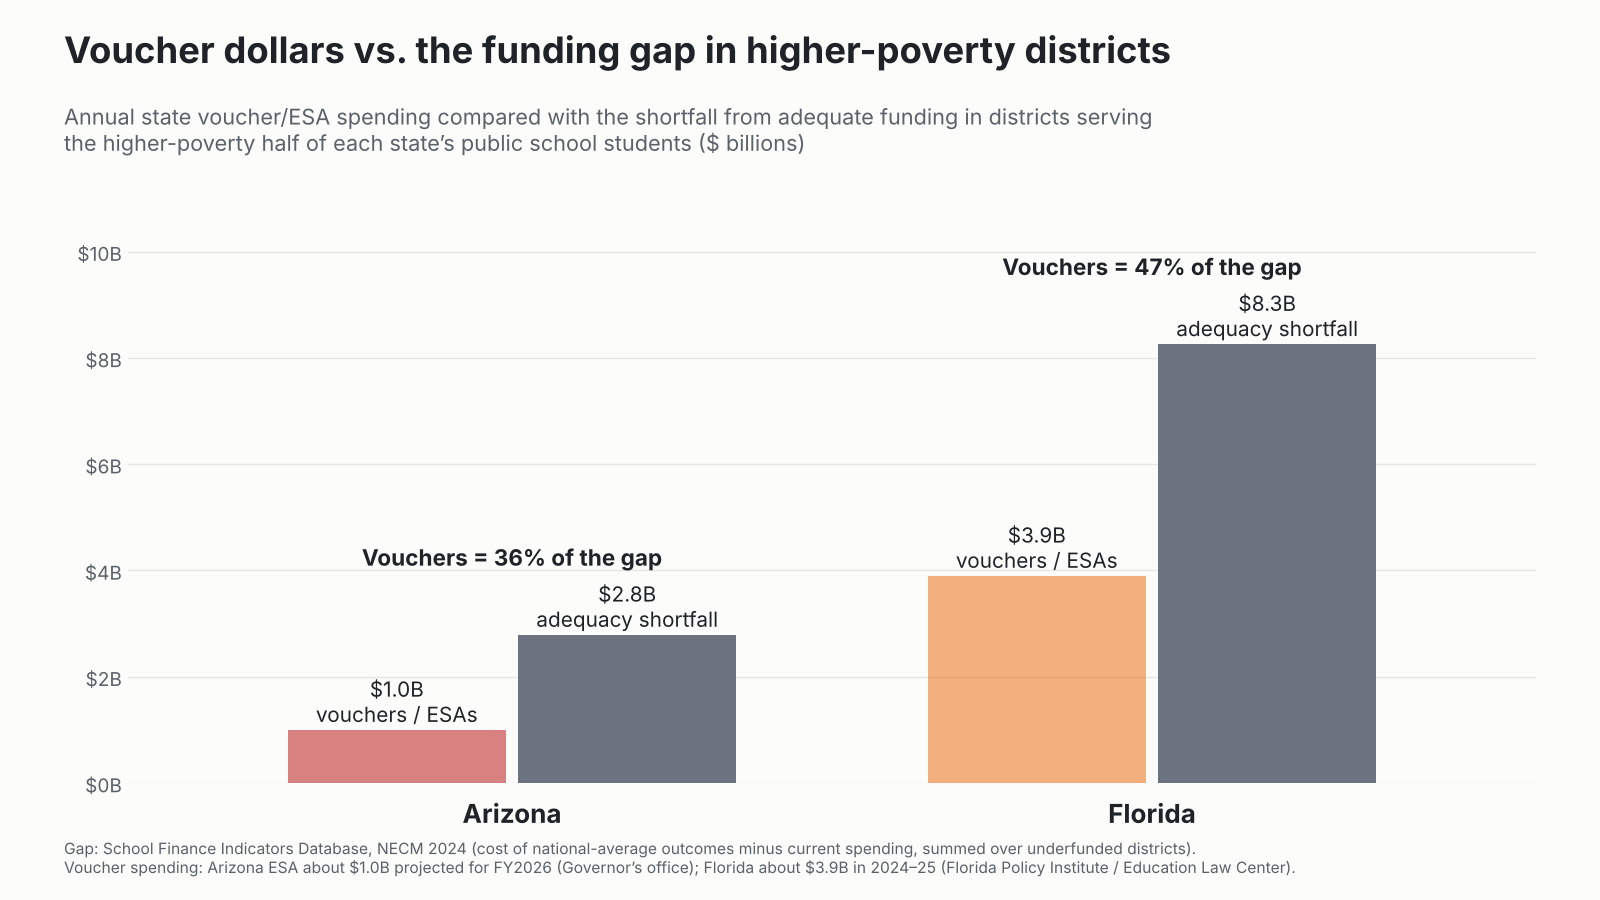
Left: Florida voucher spending in 2025–26 compared with 2024 adequacy shortfalls (cost of national-average outcomes minus current spending, summed across underfunded districts). Right: per-student dollars. Sources: School Finance Indicators Database, National Education Cost Model (2024 release); Florida Policy Institute.
By the National Education Cost Model, 64 of Florida’s 67 school districts spend less than it would cost to reach merely national-average outcomes. Statewide, Florida’s public schools fell about $15.7 billion short in 2024. The 37 districts serving the poorest fifth of Florida’s students, about 683,000 kids, were funded at about 65% of adequate and fell about $4.5 billion short.
So for roughly what Florida now spends on vouchers, it could fully fund every one of those 37 districts to adequacy and have about half a billion dollars left over. And these aren’t the places the voucher crowd likes to caricature. The list starts with Hamilton, Putnam, DeSoto, Dixie, Bradford, Gadsden, Suwannee and Madison: mostly small, rural north Florida and Heartland counties, most of which vote the way the legislature does. They’re funded at 52% to 81% of adequate. Their families mostly don’t have a private school down the road to spend a voucher at, anyway.
What’s the return on that alternative? Here we actually have good evidence. Kirabo Jackson and Claire Mackevicius pooled the rigorous studies of school spending and found that $1,000 more per pupil sustained for four years raises test scores by about 0.03 standard deviations and college-going by about 2.8 percentage points, with larger effects for lower-income students. Spread $5 billion across the districts serving Florida’s higher-poverty half of students (1.4 million kids) and that’s about $3,500 per pupil. If the effects scale anything like linearly, that’s on the order of a 10-point increase in college-going for those kids. Compare that to the voucher alternative: a discount for families already in private school, plus test score losses for many who switch.
4. Can we audit it?
A conservative doesn’t write a check without receipts. Florida’s own Auditor General, reviewing the 2024–25 school year, found the Department of Education had trouble tracking about $270 million in voucher funds, flagged possible overpayments for roughly 30,000 students, and noted that about $47 million had gone to families for private schools while their children were actually enrolled in public schools. Imagine the press release if a public school district couldn’t account for $270 million. Actually, you don’t have to imagine. You’ve read it a hundred times.
5. Is the cost under control?
Vouchers in Florida went from 12% of the state’s main K-12 funding formula to about 24% in four years, and the cap on home-education scholarships is set to come off entirely in 2027. An uncapped, demand-driven entitlement whose fastest-growing users were already paying for the service themselves is not what most conservatives would call fiscal discipline. It’s what they’d call Medicare Part D.
The conservative decision rule
If I were advising a legislature in a state thinking about adopting or expanding vouchers, and I wanted to be as economically conservative as possible about it, I’d ask them to commit, in writing, to these before spending a dime:
Don’t pay for what’s already happening. Limit eligibility to students currently in public school, or you’re mostly buying windfalls.
Target where the evidence is. The only plausible positive evidence is for targeted, low-income programs. Universal eligibility has none.
Price the alternative. Before spending $X on vouchers, publish what $X would do in the state’s most underfunded public districts, using an actual cost model.
Require the same accountability. Same audits, same testing, same public reporting as public schools, or don’t call it accountability.
Cap it. A fixed appropriation, not an open-ended entitlement that grows by whatever demand turns out to be.
Florida fails all five. That doesn’t make it free-market. It makes it a very expensive subsidy with a free-market logo on it.
Closing: so show me the return
To be fair, voucher advocates do sometimes try to make the return-on-investment case. It just doesn’t survive contact with their own spreadsheets.
Take the Commonwealth Foundation’s 2020 report Unleashing Educational Opportunity, which claimed that expanding Pennsylvania’s tax credit scholarships by 10% a year could yield, at the high end, about $6 billion in lifetime earnings gains, another $2.1 billion from additional high school graduates and $228 million in reduced crime. As I explained in my NEPC review, the earnings estimate rested on a 2% of a standard deviation gain in reading, borrowed from a meta-analysis of charter schools, not vouchers. It ignored math entirely, and it ignored the negative results from statewide voucher programs in Indiana and Ohio. The crime savings came from the author’s own Milwaukee study, stretched to cover the entire Commonwealth. And the caveats that the estimates shouldn’t be added together, and came from other places, sat on page 9, well away from the executive summary. Swap in Indiana’s math effect of about −0.15 standard deviations and, using the report’s own formula, lifetime earnings fall by more than 16%. As I put it then, “applying the report’s own methods, it is more likely that Pennsylvania would suffer significant economic losses, not gains.” The presentation made “mountains of molehills.”
Four years later, the Foundation was back with Pennsylvania’s Education Tax Credit Scholarships, this time playing down the cost. It described the $630 million program as about 1.7% of the $37 billion spent on K-12 from all sources. Measured against the state’s own $8.16 billion contribution, which is the relevant comparison for a state tax expenditure, it’s about 7.7%, or one of every $13 the state spends on schools. As I noted in that review, the same $630 million spread across the public school students of Philadelphia, Allentown, York and Reading would come to nearly $4,000 per pupil, in districts that, as I’ve shown, have never been funded anywhere near adequate.
Emily Rauscher has made the return-on-investment case most directly, and in the language a fiscal conservative should appreciate. In “Progressive Spending Is Efficient” (with Yifan Shen, in the American Journal of Sociology), she uses a decade of county-level data to show that the achievement returns to school spending are highest where prior investment has been lowest, places that often serve large shares of Black students, and that returns diminish where spending is already high. Her conclusion is the one that matters here: progressive funding isn’t just the equitable choice, it’s the efficient one. In “When Money Matters Most” (with Greer Mellon, Susanna Loeb and Carolyn Abott), comparing districts where local school funding measures barely passed with those where they barely failed, she finds that extra operating dollars raise achievement, especially in math, with significantly larger gains in low-resource districts, and that spending on teacher salaries and counselors appears especially effective for Black and low-income students. In plain terms: the next dollar buys the most where the last dollar was scarcest. That’s diminishing marginal returns, not ideology.
That’s the point an honest economic conservative should take home. Returns to public school spending are highest exactly where Florida and Pennsylvania spend least relative to need: high-poverty districts funded well below adequate. Returns to universal vouchers are, on the best statewide evidence, zero to negative, and a large share of the money doesn’t change anyone’s schooling at all. If you’re going to sell vouchers as an investment, you have to show the return. The advocates’ own estimates, run honestly, point the other way. The money that pays off is the money that reaches Putnam County and Philadelphia, not the tuition bill at a school the family was already paying.
Data notes
Adequacy and shortfalls come from the School Finance Indicators Database, National Education Cost Model (2024 release): district current spending per pupil compared with the modeled cost of national-average outcomes, with shortfalls summed as enrollment times the per-pupil gap across underfunded districts. The “poorest fifth” is the set of districts serving the 20% of public school students in the highest-poverty districts (Census SAIPE), and the “higher-poverty half” is defined the same way at 50%. Voucher spending and enrollment are from the Florida Policy Institute; the average scholarship is FES spending through the FEFP divided by FES enrollment for 2025–26. The cost per student who actually switched applies the 69% share of new post-2023 users already in private school to the average scholarship; it’s an illustration, not a program-wide estimate. Projected spending effects use the pooled estimates from Jackson and Mackevicius (2024) and assume linear scaling, which is a simplification.
Sources
School Finance Indicators Database, National Education Cost Model (2024 release).
Chingos, M., & Kuehn, D. (2017). The effects of statewide private school choice on college enrollment and graduation (Urban Institute), as summarized by Chalkbeat.
Or: how one of the richest states in the country managed to fund its whitest school districts at twice what they need and its Black and Hispanic districts at less than three-quarters.
Connecticut likes to think of itself as an education state. High test score averages, leafy suburbs, famous prep schools, Yale. And on average, sure. But I’ve spent a lot of years on this blog pointing out that averages are where inequality goes to hide.
In CCJEF v. Rell, a trial judge found in 2016 that Connecticut’s school funding system was irrational. In January 2018, a divided 4–3 Connecticut Supreme Court reversed that ruling, holding that the state had met its minimal constitutional obligation. Read charitably, the decision handed school funding back to the legislature. Read the way Connecticut lawmakers apparently read it, it was a dare: how unequal can we make this before anybody stops us?
Challenge accepted.
To be fair to the legislature, it had a head start. By the measures I use below, Connecticut already had the largest racial school funding gap in the country in 2009, and it has held that title every year I can measure. But once the court took itself off the field, lawmakers didn’t just defend the title. They ran up the score. From 2018 to 2024, funding adequacy in the districts serving Connecticut’s most Black and Hispanic fifth of students fell from 78% to 73% of what it would cost to reach national-average outcomes, and from 52% to 49% of what it would cost to reach Massachusetts-average outcomes. The share of Black students attending districts that spend less than it would cost to reach Massachusetts-average outcomes rose from 75% to 82%; for Latino students, from 71% to 77%. And the state funding system went from the 11th most regressive in the nation to the 4th.
In 2021, Robert Cotto, Preston Green and I wrote in the CT Mirror that it was time to fix Connecticut school finance (I laid out the case here too: Fixing Connecticut School Finance: The Time is Now), in three steps: study what it would actually cost to give every child an equal shot at robust outcomes, recalibrate the Education Cost Sharing (ECS) formula to hit those cost targets, and fund it. Five years later, the state has taken none of those steps. In our most recent national report, The Adequacy and Fairness of State School Finance Systems, Connecticut ranked 46th of 47 states on equal educational opportunity. In April, Governor Lamont created a commission to reevaluate education funding. Consider this a contribution to its homework. Here, using the same cost model and indicators from my recent red state, blue state posts, is how Connecticut lawmakers took the court’s pass and built the most racially unequal school funding system in the country.
Round 1: Funding by race
Start with the National Education Cost Model. For every district, it estimates what it would cost to get that district’s kids to national average outcomes, given who they are and where they live. Divide what the district actually spends by that cost, and you get percent of adequate. At 100%, the money covers the cost of average outcomes. Not elite outcomes. Average.
National average is a low bar for a state that likes to compare itself to Massachusetts. So the model also estimates what it would cost each district to reach Massachusetts-average outcomes, about one and a half times the national-average cost. I report both throughout: the national standard first, and the Massachusetts standard (“MA”) alongside it. Spoiler: raising the bar doesn’t change the rankings. It just makes the hole a lot deeper.
Now sort Connecticut’s students into five equal groups, from those attending the districts with the smallest shares of Black and Hispanic students to those attending districts with the largest.
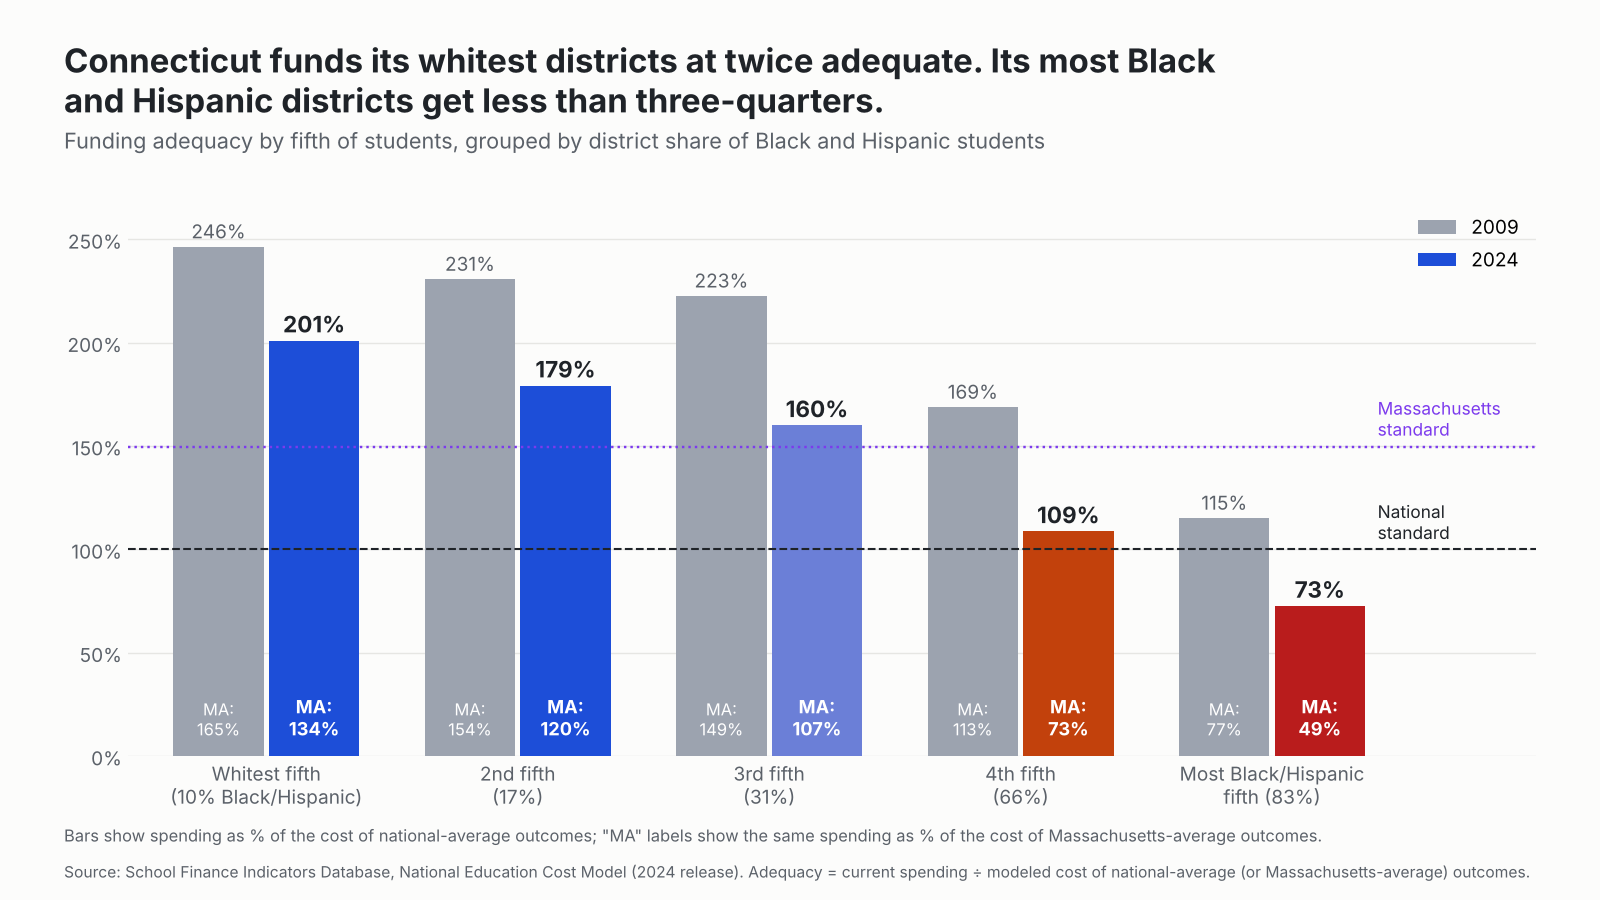
Funding adequacy for each fifth of Connecticut’s students, grouped by the Black and Hispanic share of their district’s enrollment, 2009 and 2024. Bars show the national-average-outcome standard; “MA” labels show the Massachusetts-average-outcome standard. Source: School Finance Indicators Database, National Education Cost Model (2024 release).
In 2024, the fifth of Connecticut students in the whitest districts (about 10% Black and Hispanic) attended schools funded at 201% of adequate (134% of the MA standard), about $13,500 per pupil more than the cost of national average outcomes. The fifth in the most Black and Hispanic districts (83% Black and Hispanic) attended schools funded at 73% (49% of the MA standard), about $8,900 per pupil short. That’s a gap of 128 percentage points (86 points against the MA standard). Against the Massachusetts standard, the whitest fifth is still about $6,900 per pupil ahead, while the most Black and Hispanic fifth is about $25,000 per pupil short. Put differently, the whitest districts sit about $22,400 per pupil further ahead of where they need to be than the most Black and Hispanic districts against the national standard, and about $31,900 further ahead against the Massachusetts standard.
How does that compare? I ran the same calculation for every state with enough districts to do it.
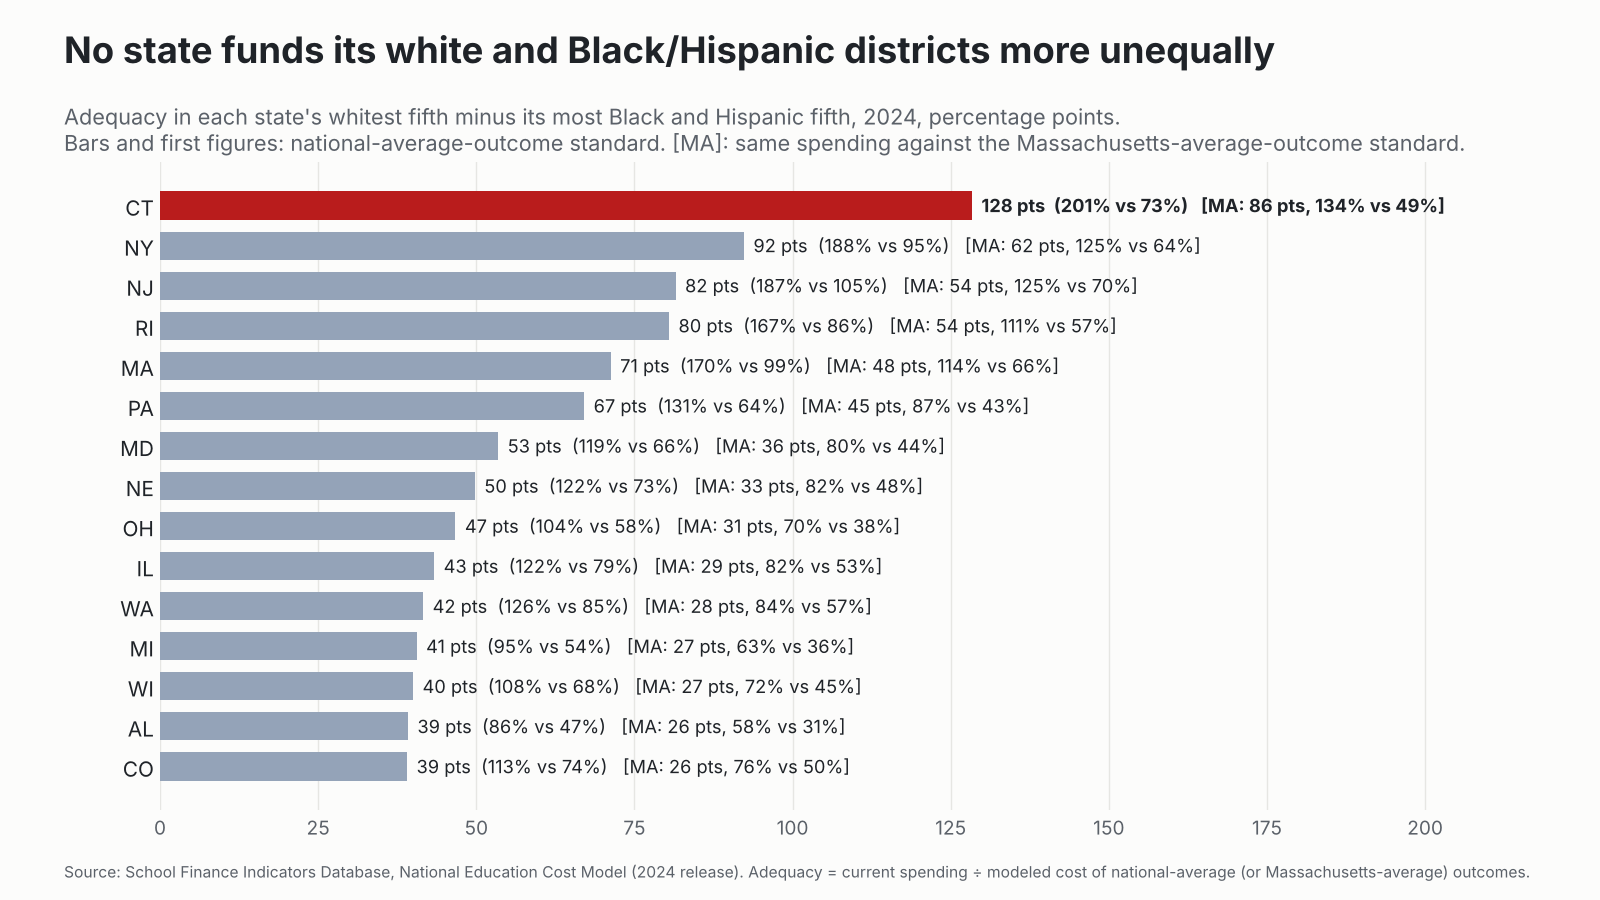
Adequacy in each state’s whitest fifth of students minus its most Black and Hispanic fifth, 2024, under the national standard and [in brackets] the Massachusetts standard. Source: School Finance Indicators Database, National Education Cost Model (2024 release).
Connecticut is first under either standard, and it isn’t close. New York is a distant second at 92 points (62 against the MA standard, vs. Connecticut’s 86). Notice who else is up there: New Jersey, Rhode Island, Massachusetts. These are mostly wealthy northeastern states with small, fragmented districts drawn along lines of race and class, where the affluent towns spend like private schools. But Connecticut takes it to a level of its own.
Look at it from the student’s side. Just over half of Connecticut’s Black and Hispanic students, about 99,000 kids, attend districts funded below national adequacy. For all other students, it’s 9%. Against the Massachusetts standard, it’s 78% of Black and Hispanic students (about 153,000 kids) vs. 26% of everyone else. The typical Black or Hispanic student in Connecticut attends a district funded at 99% of adequate (66% of the MA standard). The typical student who isn’t Black or Hispanic attends one funded at 158% (105% of the MA standard). That 59-point difference in exposure is also the largest in the country.
Round 2: Names, not quintiles
Quintiles are abstractions. Here’s what it looks like district by district.
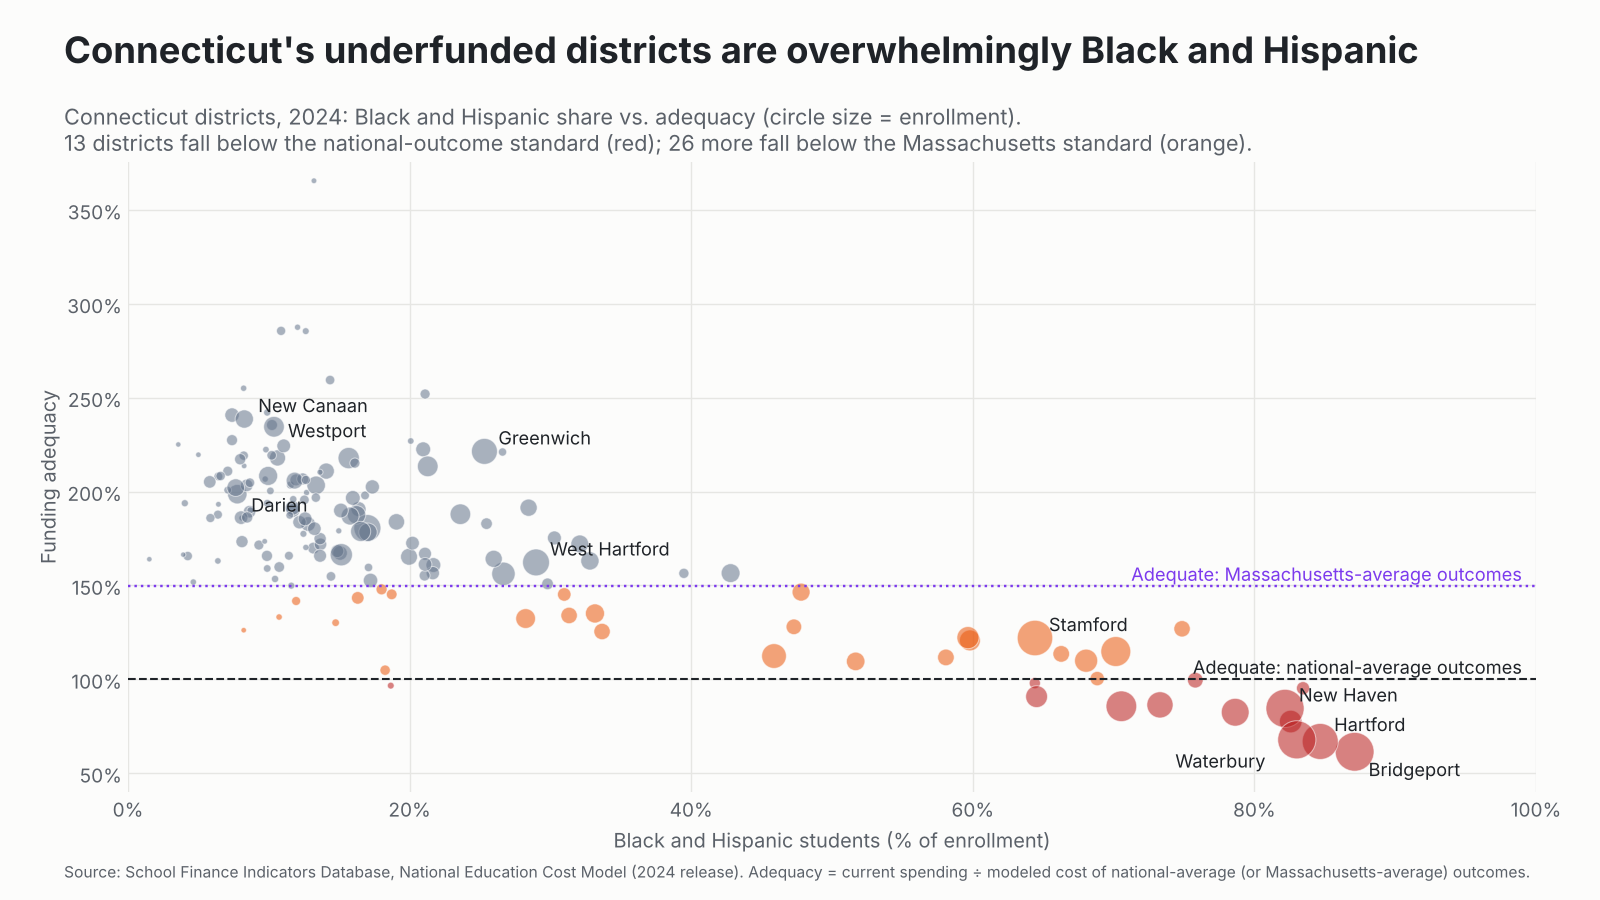
Connecticut school districts, 2024. Each circle is a district, sized by enrollment. Red: below the national-average-outcome standard; orange: below the Massachusetts-average-outcome standard. Source: School Finance Indicators Database, National Education Cost Model (2024 release).
District
Black & Hispanic
Child poverty
Spending per pupil
Cost: national avg.
Adequacy: national
Cost: MA avg.
Adequacy: MA
Bridgeport
87%
25%
$21,004
$34,195
61%
$51,172
41%
Hartford
85%
34%
$26,602
$39,752
67%
$59,488
45%
Waterbury
83%
33%
$20,824
$30,709
68%
$45,955
45%
New Haven
82%
24%
$23,235
$27,491
85%
$41,139
56%
Darien
8%
2%
$28,136
$14,167
199%
$21,200
133%
Greenwich
25%
5%
$31,563
$14,255
221%
$21,333
148%
Westport
10%
3%
$29,927
$12,761
235%
$19,097
157%
New Canaan
8%
3%
$29,555
$12,384
239%
$18,533
159%
Selected Connecticut districts, 2024. Spending is current spending per pupil; costs are the modeled costs of national-average and Massachusetts-average outcomes. Source: School Finance Indicators Database, National Education Cost Model (2024 release).
Westport spends about $8,900 more per pupil than Bridgeport. Bridgeport’s kids, by the cost model’s estimate, need nearly three times as much to reach the same modest goal. So Westport spends more, needs less, and ends up funded at 235% of adequate while Bridgeport sits at 61%. They are about 20 minutes apart on I-95. Bridgeport, by itself, is about $13,200 per pupil short of adequate. So is Hartford. Against the Massachusetts standard, Westport is at 157% and Bridgeport at 41%, about $30,200 per pupil short. Hartford is about $32,900 short.
Thirteen Connecticut districts were funded below adequate in 2024. Together they serve about 124,000 students and fall about $931 million a year short. Twelve of the thirteen are majority Black and Hispanic. (The thirteenth is tiny Sprague, with fewer than 300 students.) Four of Connecticut’s five largest cities are on the list. (Stamford, at 122% of adequate, is the exception.) Raise the bar to Massachusetts and 39 districts fall short, serving about 226,000 students, nearly half the state, by about $3.4 billion a year. That includes all eight of Connecticut’s largest districts, Stamford (82%) among them. Twenty-two of the 39 are majority Black and Hispanic.
Round 3: It didn’t have to be this way
Here’s the part that should bother Connecticut most. In 2009, by this same measure, no Connecticut district was funded below adequate. Hartford was at 133%. Bridgeport was at 104%. The most Black and Hispanic fifth of students was at 115%. Unequal, yes, but everyone was above the line. Even against the Massachusetts standard, Hartford was at 89%, Bridgeport at 70%, and 16 districts fell short.
Fifteen years later, Hartford is at 67%, Bridgeport at 61%, and 13 districts serving a quarter of the state’s students are below adequate. Against the Massachusetts standard, Hartford is at 45%, Bridgeport at 41%, and the count of districts falling short went from 16 to 39. Meanwhile the dollar gap between the whitest and most Black and Hispanic fifths of students more than doubled in real terms, from about $9,600 per pupil in 2009 (in 2024 dollars) to about $22,400 in 2024 against the national standard, and from about $15,200 to about $31,900 against the Massachusetts standard.
How? Look at how state and local revenue lines up with poverty.
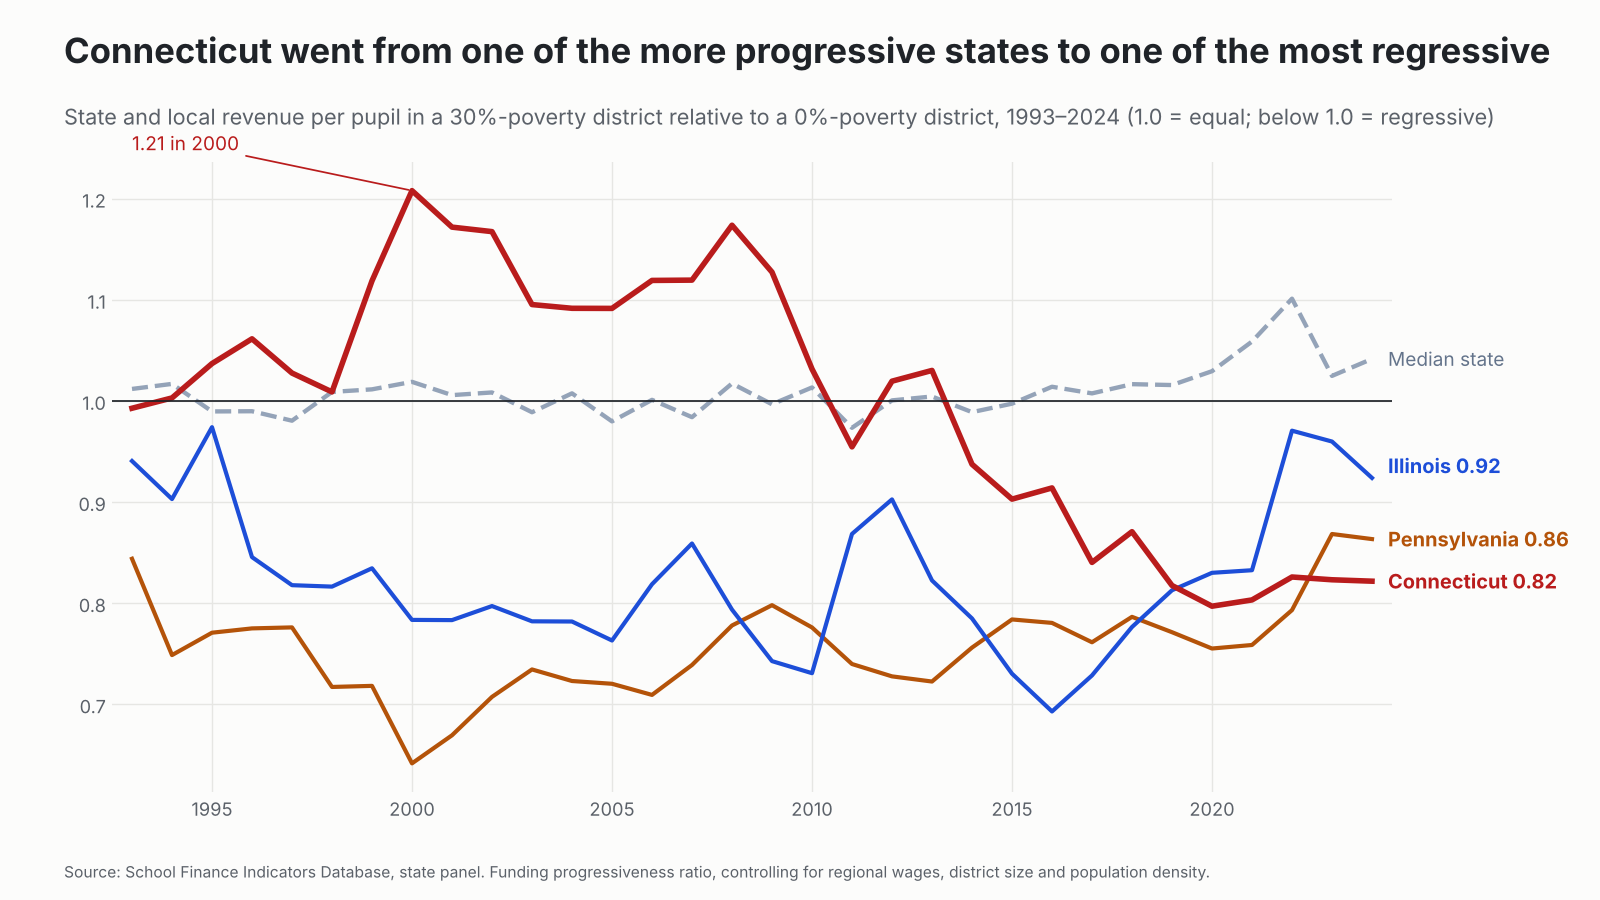
State and local revenue per pupil in a 30%-poverty district relative to a 0%-poverty district, 1993–2024, controlling for regional wages, district size and density. Source: School Finance Indicators Database, state panel.
Connecticut wasn’t always like this. Through the 1990s and 2000s its state and local revenue actually tilted toward higher-poverty districts. At the peak, in 2000, a district with 30% child poverty received about 21% more per pupil than a district with none, and Connecticut stayed on the progressive side, give or take a year, until about 2013. Since then it has slid almost every year. By 2024 that same high-poverty district received about 18% less, making Connecticut the fourth most regressive school funding system in the country. The median state moved the other way. (I walked through this slide in more detail back in May: The collapse of fairness in Connecticut school funding.)
For context, I’ve spent years using Illinois and Pennsylvania as my go-to examples of regressive school finance. Both were below 1.0 for nearly this entire period. Both have since improved: Illinois adopted its Evidence-Based Funding formula in 2017, and a Pennsylvania court struck down that state’s system in 2023. In 2024 Illinois sat at 0.92 and Pennsylvania at 0.86. Connecticut, at 0.82, is now more regressive than both.
This is what happens when a state leans on local property wealth and lets its aid formula drift. The rich towns raise more locally, as rich towns always will. The state aid that is supposed to offset that doesn’t keep up. The slide started before the court ruled. The ruling just removed the last referee who might have stopped it. Everyone tells themselves the formula is being phased in.
A caveat before anyone holds up Illinois as the model for Connecticut. Illinois’s Evidence-Based Funding formula is better than the system it replaced, and the trend lines here show it. But as I explained in When Evidence Based Isn’t, it is not what it claims to be. Its “adequacy targets” come from consultant-built prototype schools, not from any measured relationship between spending and outcomes. They differ by only about 22% between the state’s lowest- and highest-poverty districts, when getting high-poverty districts to common outcomes typically takes two to three times as much. They overstate what the most affluent suburbs need and understate what Chicago and other high-poverty districts need. That is a political compromise dressed up as evidence: modest increases spread across lots of constituents, rather than what kids in high-need districts actually need. It shows in the numbers above. Eight years into EBF, Illinois’s highest-poverty fifth of students is still funded at only 79% of the cost of national-average outcomes and 53% of the Massachusetts standard. So the lesson for Connecticut’s commission isn’t “copy Illinois.” It’s “don’t let consultants pre-compromise the cost targets.” Do an actual cost study, calibrated to an actual outcome goal.
Same story by poverty
Sort Connecticut’s students by child poverty instead of race and you get nearly the same picture, because in Connecticut those are nearly the same districts. The lowest-poverty fifth is funded at 195% of adequate (130% of the MA standard); the highest-poverty fifth at 73% (49%). That 122-point gap (82 points against the MA standard) is the second largest in the country under either standard, behind only New York.
Connecticut vs. Illinois and Pennsylvania
So how does Connecticut compare with my usual suspects over time? First, the gap between each state’s lowest- and highest-poverty fifths of students.
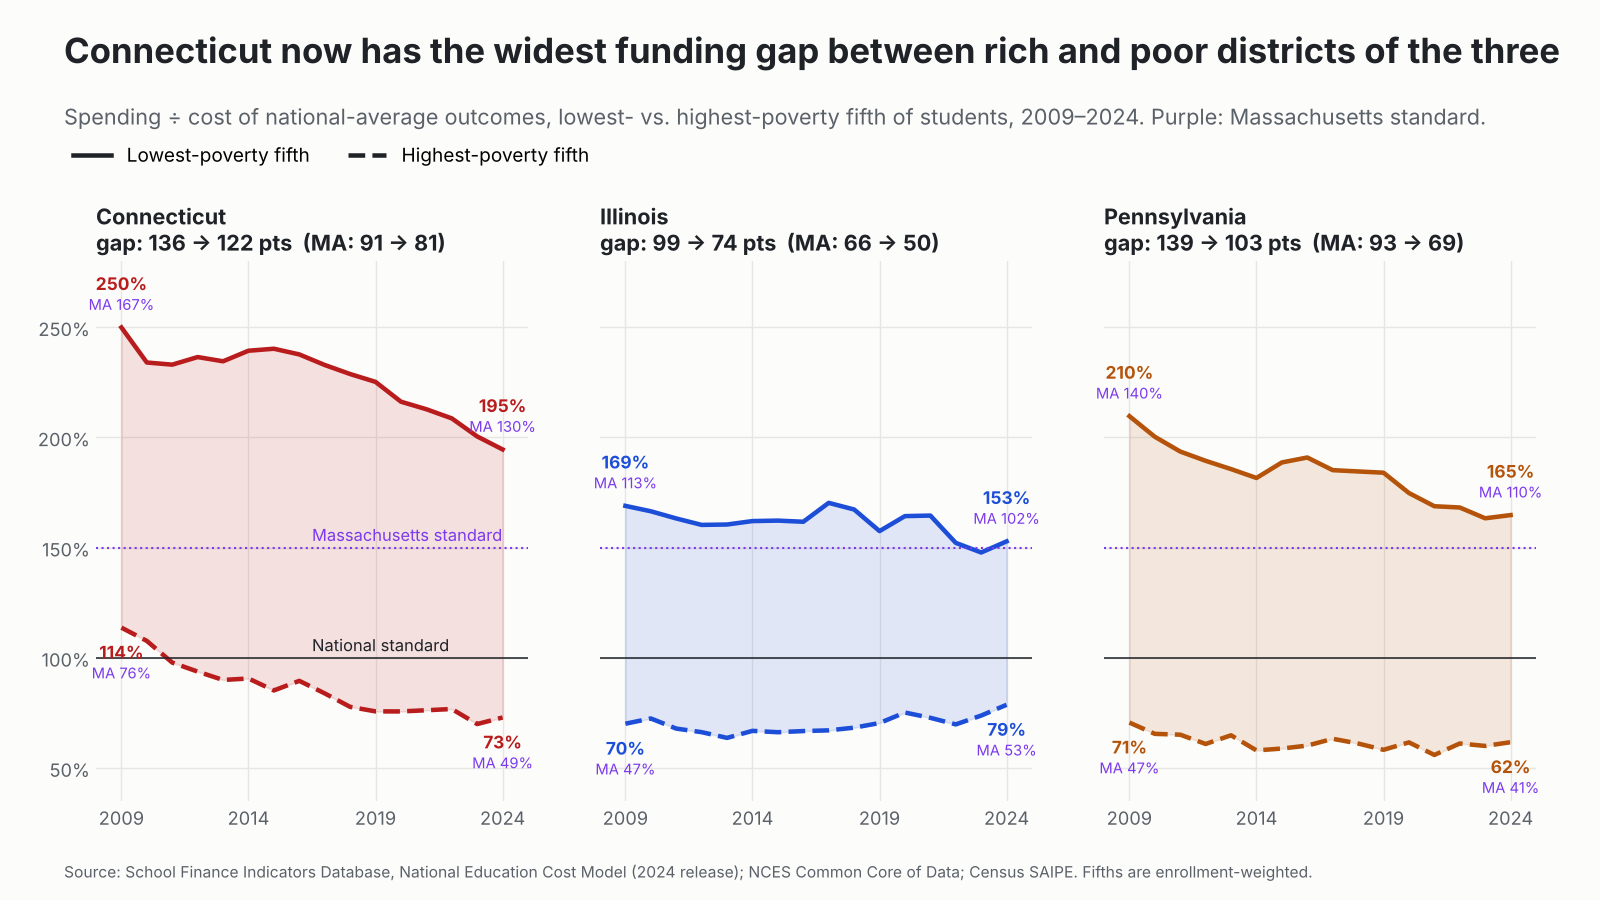
Funding adequacy in each state’s lowest- and highest-poverty fifth of students, 2009–2024, against the national-average-outcome standard and (purple) the Massachusetts-average-outcome standard. Source: School Finance Indicators Database, National Education Cost Model (2024 release); NCES Common Core of Data; Census SAIPE.
Connecticut’s poverty gap narrowed a bit, from 136 points to 122, but only because both ends fell, and the bottom fell through the floor: its highest-poverty districts went from 114% of adequate to 73%. Pennsylvania’s gap was actually larger than Connecticut’s in 2009 (139 points) and has narrowed to 103, though its poorest districts were underfunded then and still are (62%). Illinois narrowed its gap the most, from 99 points to 74, with its highest-poverty districts rising from 70% to 79%. Connecticut now has the widest poverty gap of the three. Against the Massachusetts standard (the purple labels), the gaps run 81 points in Connecticut, 69 in Pennsylvania and 50 in Illinois, and the highest-poverty fifth falls far short everywhere: 49% in Connecticut, 41% in Pennsylvania and 53% in Illinois. The difference is that Connecticut’s lowest-poverty fifth is at 130% of the MA standard, while Illinois’s is at 102%.
Now by race.
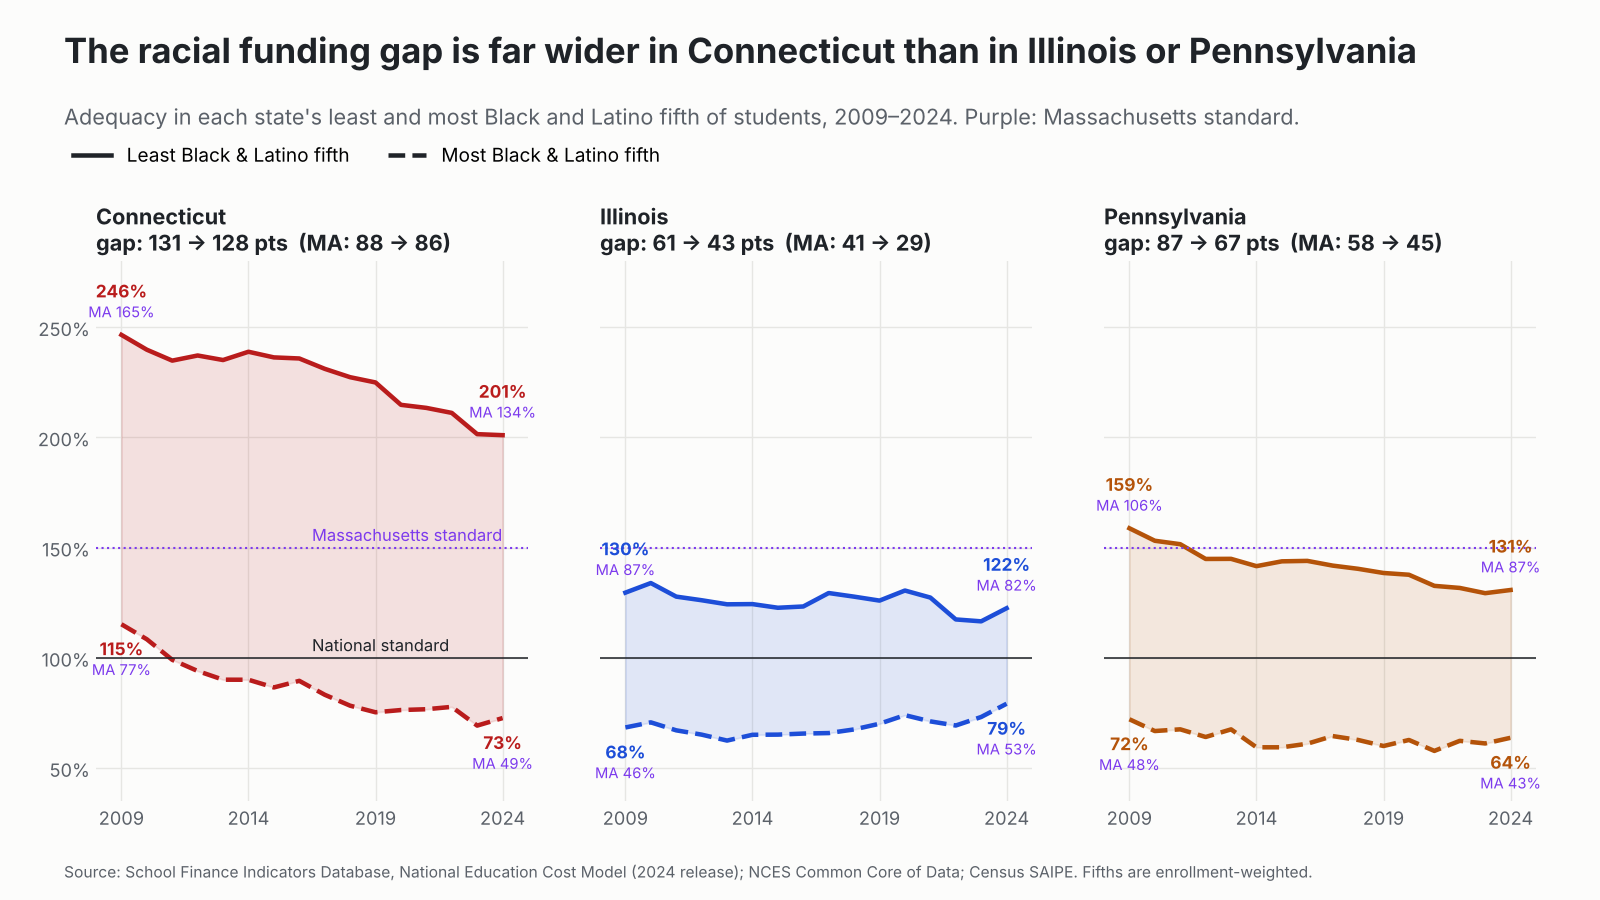
Funding adequacy in each state’s fifth of students in the least and most Black and Latino (Hispanic) districts, 2009–2024, against the national standard and (purple) the Massachusetts standard. Source: School Finance Indicators Database, National Education Cost Model (2024 release); NCES Common Core of Data; Census SAIPE.
Not close. Connecticut’s gap between its least and most Black and Latino fifths of students was 131 points in 2009 and 128 in 2024. Pennsylvania’s is 67 points. Illinois’s is 43, down from 61. In Illinois and Pennsylvania the whitest districts are funded at 122% to 131% of adequate. In Connecticut, 201%. Against the Massachusetts standard, the gaps are 86 points in Connecticut, 45 in Pennsylvania and 29 in Illinois. The whitest districts in Illinois and Pennsylvania don’t even reach the Massachusetts standard (82% and 87%). Connecticut’s are at 134%.
Raise the bar to Massachusetts
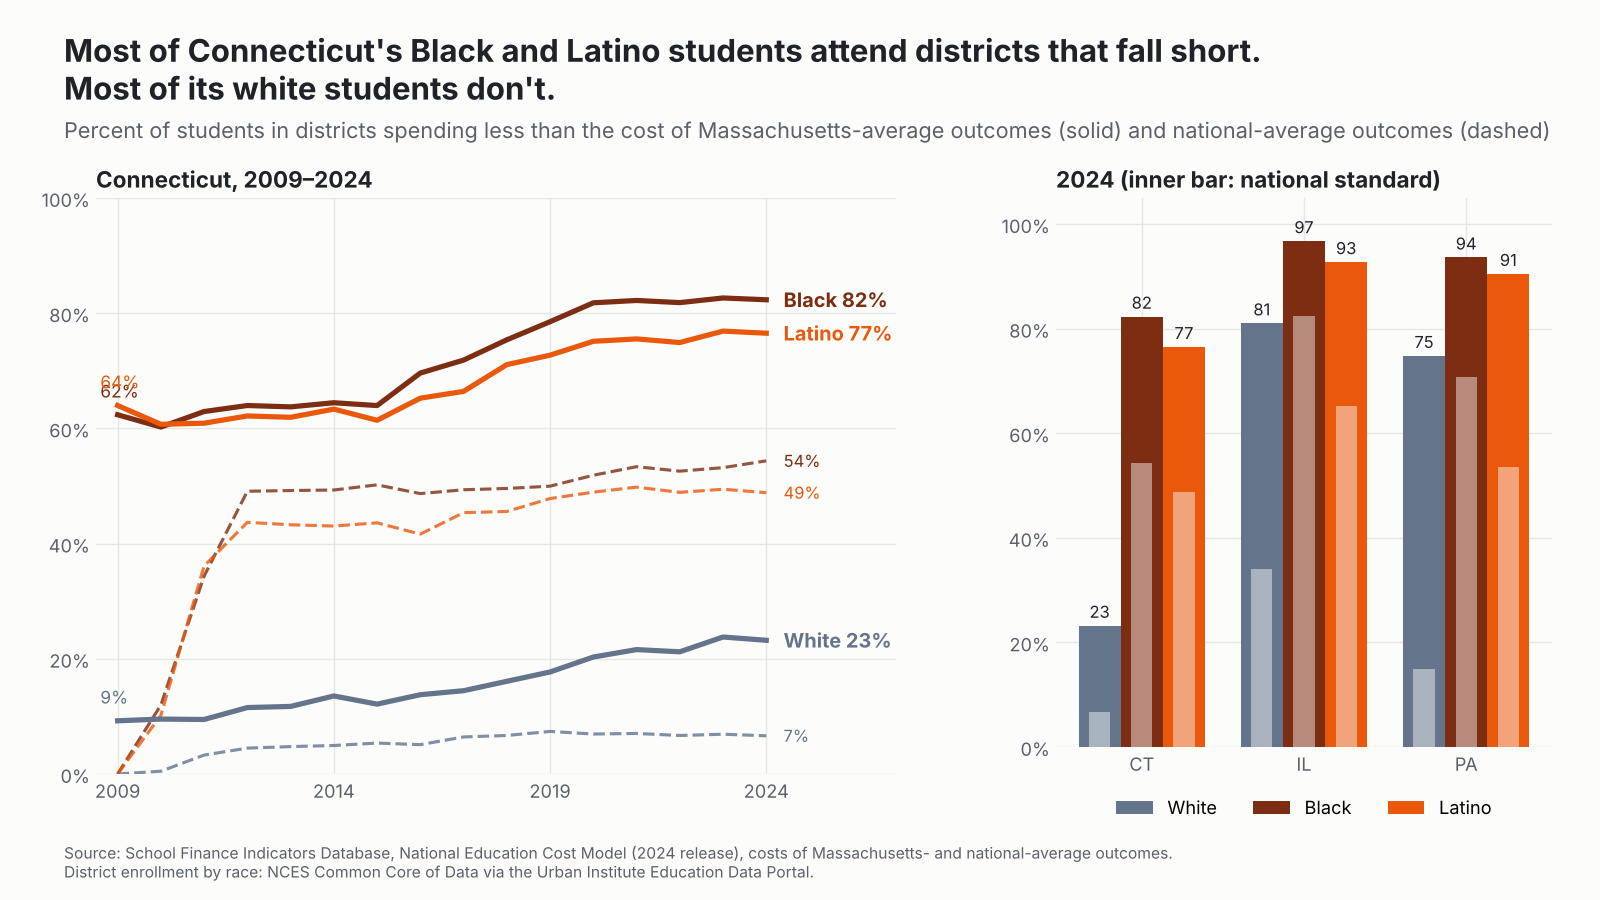
I’ve been reporting both standards. Here’s the one that matters most for Connecticut. As I explained in my recent brief on Connecticut’s equal educational opportunity problem, the state’s real peers are Massachusetts and New Jersey, and Connecticut has been losing ground to both since the early 2010s. So who attends a district that spends less than it would cost to reach Massachusetts-average outcomes? (The dashed lines and inner bars in the chart below show the national standard.)
Percent of students in districts spending less than the modeled cost of Massachusetts-average outcomes (solid lines, outer bars) and national-average outcomes (dashed lines, inner bars). Source: School Finance Indicators Database, National Education Cost Model (2024 release); district enrollment by race from NCES Common Core of Data via the Urban Institute Education Data Portal.
In 2024, 82% of Connecticut’s Black students and 77% of its Latino students attended districts spending less than it would cost to reach Massachusetts-average outcomes. For white students, 23%. In 2009 those figures were 62%, 64% and 9%. Against the national standard, it’s 54% of Black students, 49% of Latino students and 7% of white students, up from essentially zero for all three in 2009.
In one sense Illinois and Pennsylvania look worse: most of their white students fall short too (81% and 75%), because those states spend less overall. Connecticut’s distinction is the gap. Its white students mostly attend districts that can reach the Massachusetts bar; its Black and Latino students mostly do not. That’s a 53- to 59-point racial gap in who gets a real shot at the Massachusetts standard, compared with 16 to 19 points in Pennsylvania and 12 to 16 in Illinois. Against the national standard the racial gap is 42 to 47 points in Connecticut, 39 to 56 in Pennsylvania and 31 to 48 in Illinois. Connecticut’s white students are the least likely in the three states to fall short of either standard (7% national, 23% MA), compared with 15% and 75% in Pennsylvania and 34% and 81% in Illinois.
And the outcomes?
As I’m fond of saying, money isn’t everything, but you can’t do much of anything without it. Connecticut’s 8th-grade NAEP math gap between low-income and other students was 37 points in 2019, the last year before the pandemic, the third largest in the nation. Connecticut posts nice statewide averages because it has a lot of very well-off kids in very well-funded schools. The averages are doing exactly what averages do.
Courts, formulas and good intentions
None of this is a secret in Connecticut. In Sheff v. O’Neill (1996), the Connecticut Supreme Court held that the racial and ethnic isolation of Hartford’s schoolchildren violated the state constitution. Three decades of magnet schools and interdistrict choice followed, which helped some kids and left the underlying finance system intact. Then came CCJEF, where the same court decided that “minimal” was good enough. By that standard, I suppose Bridgeport at 61% of adequate (41% of the Massachusetts standard) is just fine. Good to know. Lawmakers certainly seem to think so.
To its credit, the legislature in 2023 accelerated the phase-in of its Education Cost Sharing formula, with underfunded towns reaching full formula funding in FY2026, after the 2024 data shown here. That’s worth watching. But “full funding” of a formula is only as good as the formula’s targets, and nearly a billion dollars a year (about $3.4 billion against the Massachusetts standard) is a big hole to fill with a phase-in. I’ll update when the 2026 data come in.
Governor Lamont’s commission should start where we started in 2021. Commission a rigorous, independent study of what it costs for every Connecticut child to reach a robust common standard, in 2027. Use it to overhaul or replace ECS in the 2028 session. Begin phasing in the new formula by fall 2028. Then fund it. It has now been 12 years since I first laid out the plight of Connecticut’s majority-Hispanic districts in a report for the Center for American Progress. A whole cohort of kids has gone from first grade to graduation since then.
There’s also a deeper problem that more state aid alone doesn’t fix. As I’ve written elsewhere (Baker, 2025), racial isolation itself raises the cost of providing equal educational opportunity. Connecticut has sorted its students sharply by race along the lines of its 169 towns. Then it funded the isolated districts least.
The bottom line
Connecticut has the largest racial school funding gap in the nation. Its whitest fifth of students attend districts funded at 201% of adequate; its most Black and Hispanic fifth at 73%. Against the Massachusetts standard: 134% vs. 49%. First in the nation either way.
Half of Connecticut’s Black and Hispanic students attend underfunded districts. For other students, it’s 9%. Against the Massachusetts standard: 78% vs. 26%.
Thirteen districts, 124,000 students, about $931 million a year short, and 12 of the 13 are majority Black and Hispanic. Against the Massachusetts standard: 39 districts, 226,000 students, about $3.4 billion short.
It got worse. In 2009 no Connecticut district was below national adequacy and 16 were below the Massachusetts standard. In 2024: 13 and 39. The real dollar gap between the whitest and most Black and Hispanic districts has roughly doubled under either standard.
The system went regressive. From one of the more progressive states in the early 2000s to the fourth most regressive in 2024, now worse than Illinois and Pennsylvania.
Against a Massachusetts bar, 82% of Black and 77% of Latino students attend districts that fall short, against 23% of white students. (National standard: 54%, 49% and 7%.)
Challenge accepted. The state Supreme Court let Connecticut lawmakers off the hook in 2018. They used the freedom to make things worse for the kids the case was about. If you want one state to show what educational inequality looks like when a wealthy state chooses not to fix it, it’s Connecticut.
Data notes
All finance and adequacy measures come from the School Finance Indicators Database. Adequacy is district current spending per pupil divided by the National Education Cost Model’s estimated cost of national average outcomes (2024 release), aggregated as total spending over total cost (enrollment-weighted). The Massachusetts standard uses the NECM’s cost of Massachusetts-average outcomes, which in this release is a constant 1.4965 times the cost of national-average outcomes in every district. So rankings and ratios between groups are the same under both standards, but percentage-point gaps, counts of districts falling short and dollar shortfalls differ. Race groups divide each state’s students into five equal-sized groups by the combined Black and Hispanic share of their district’s enrollment (NCES Common Core of Data); poverty groups do the same by Census SAIPE child poverty. “Exposure” figures weight each district by its number of Black and Hispanic students, or other students. State rankings include 49 states with enough districts to form groups. Real-dollar comparisons use the CPI-U. Funding progressiveness is the SFID ratio of predicted state and local revenue per pupil at 30% vs. 0% child poverty. NAEP gaps compare students eligible and not eligible for subsidized meals. Shares of white, Black and Latino students below each standard use district enrollment by race (white, Black, Hispanic/Latino) from the NCES Common Core of Data via the Urban Institute Education Data Portal.
Sources
School Finance Indicators Database: state panel and NECM district file (data behind all figures)
Baker, B. D. (2025). How and why racial isolation affects education costs and the provision of equal educational opportunity. Education Policy Analysis Archives, 33(55).
Baker, B. D., Weber, M., & Srikanth, A. (2021). Informing federal school finance policy with empirical evidence. Journal of Education Finance, 47(1), 1–25.
Baker, B. D. (2026). Connecticut’s Equal Educational Opportunity Problem. School Finance 101 policy brief.
Baker, B. D., Cotto, R., & Green, P. (2021). Now is the time to fix Connecticut school finance. CT Mirror.
Urban Institute, Education Data Portal (NCES Common Core of Data, district enrollment by race).
Or: two states that pay for public schools, two states that would rather pay for Cave Creek’s private school tuition, and a modest proposal for anyone trying to decide where to raise a kid.
In my last round of this, I lined up the two biggest blue states against the two biggest red states. This time let’s give the voucher crowd the matchup they’ve been begging for. In one corner, New Jersey and Massachusetts, the bloated, overtaxed, union-captured, “throwing money at the problem” hellscapes of the Northeast. You’ve read the op-eds. In the other corner, Arizona and Florida, the shining cities on the hill of “education freedom,” the two states that have gone furthest in turning public school money into private school coupons. Arizona went universal in 2022. Florida followed in 2023. Surely this is where the free market finally delivers.
Same yardstick as always: the National Education Cost Model for adequacy, the Education Comparable Wage Index for spending, state and local school spending relative to the economy for effort, and NAEP for outcomes, 2009 through 2024. Then a look at where the voucher money is going, and where it might have done more good.
Round 1: Adequacy
All districts, 2009 → 2024
Highest-poverty fifth, 2009 → 2024
Students in underfunded districts, 2024
New Jersey
178% → 136%
139% → 110%
11%
Massachusetts
174% → 133%
137% → 109%
12%
Arizona
87% → 72%
64% → 64%
98%
Florida
94% → 70%
83% → 63%
98%
Funding adequacy: current spending as a percent of the cost of national average outcomes. Source: School Finance Indicators Database, National Education Cost Model (2024 release).
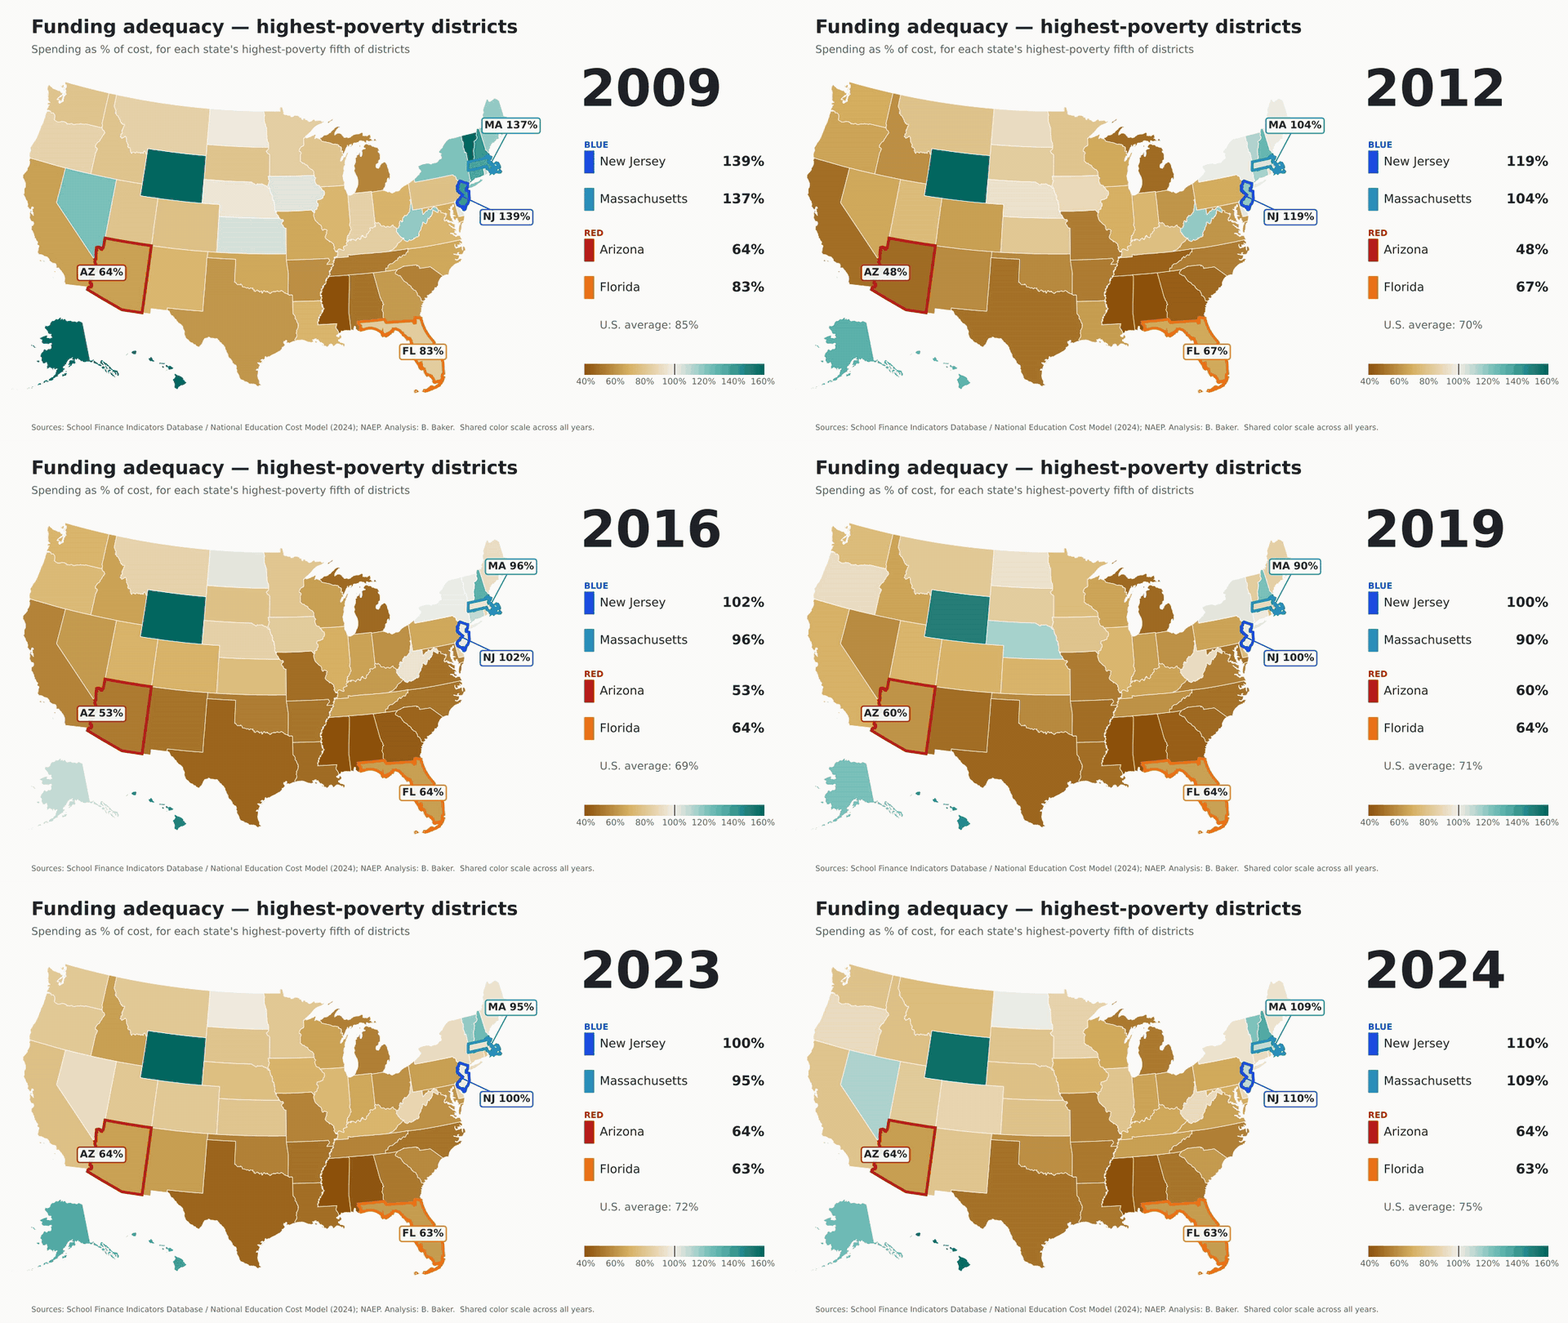
This isn’t close. It isn’t even in the same zip code (and as we’ll see, zip codes matter a lot in Arizona). Even the highest-poverty districts in New Jersey and Massachusetts are funded above the cost of national average outcomes, at 110% and 109%. In Arizona and Florida, the highest-poverty districts sit at 64% and 63%. Ninety-eight percent of students in both red states attend districts funded below adequate levels. In New Jersey and Massachusetts it’s 11% and 12%. But sure, tell me again about the Northeast’s efficiency problem.
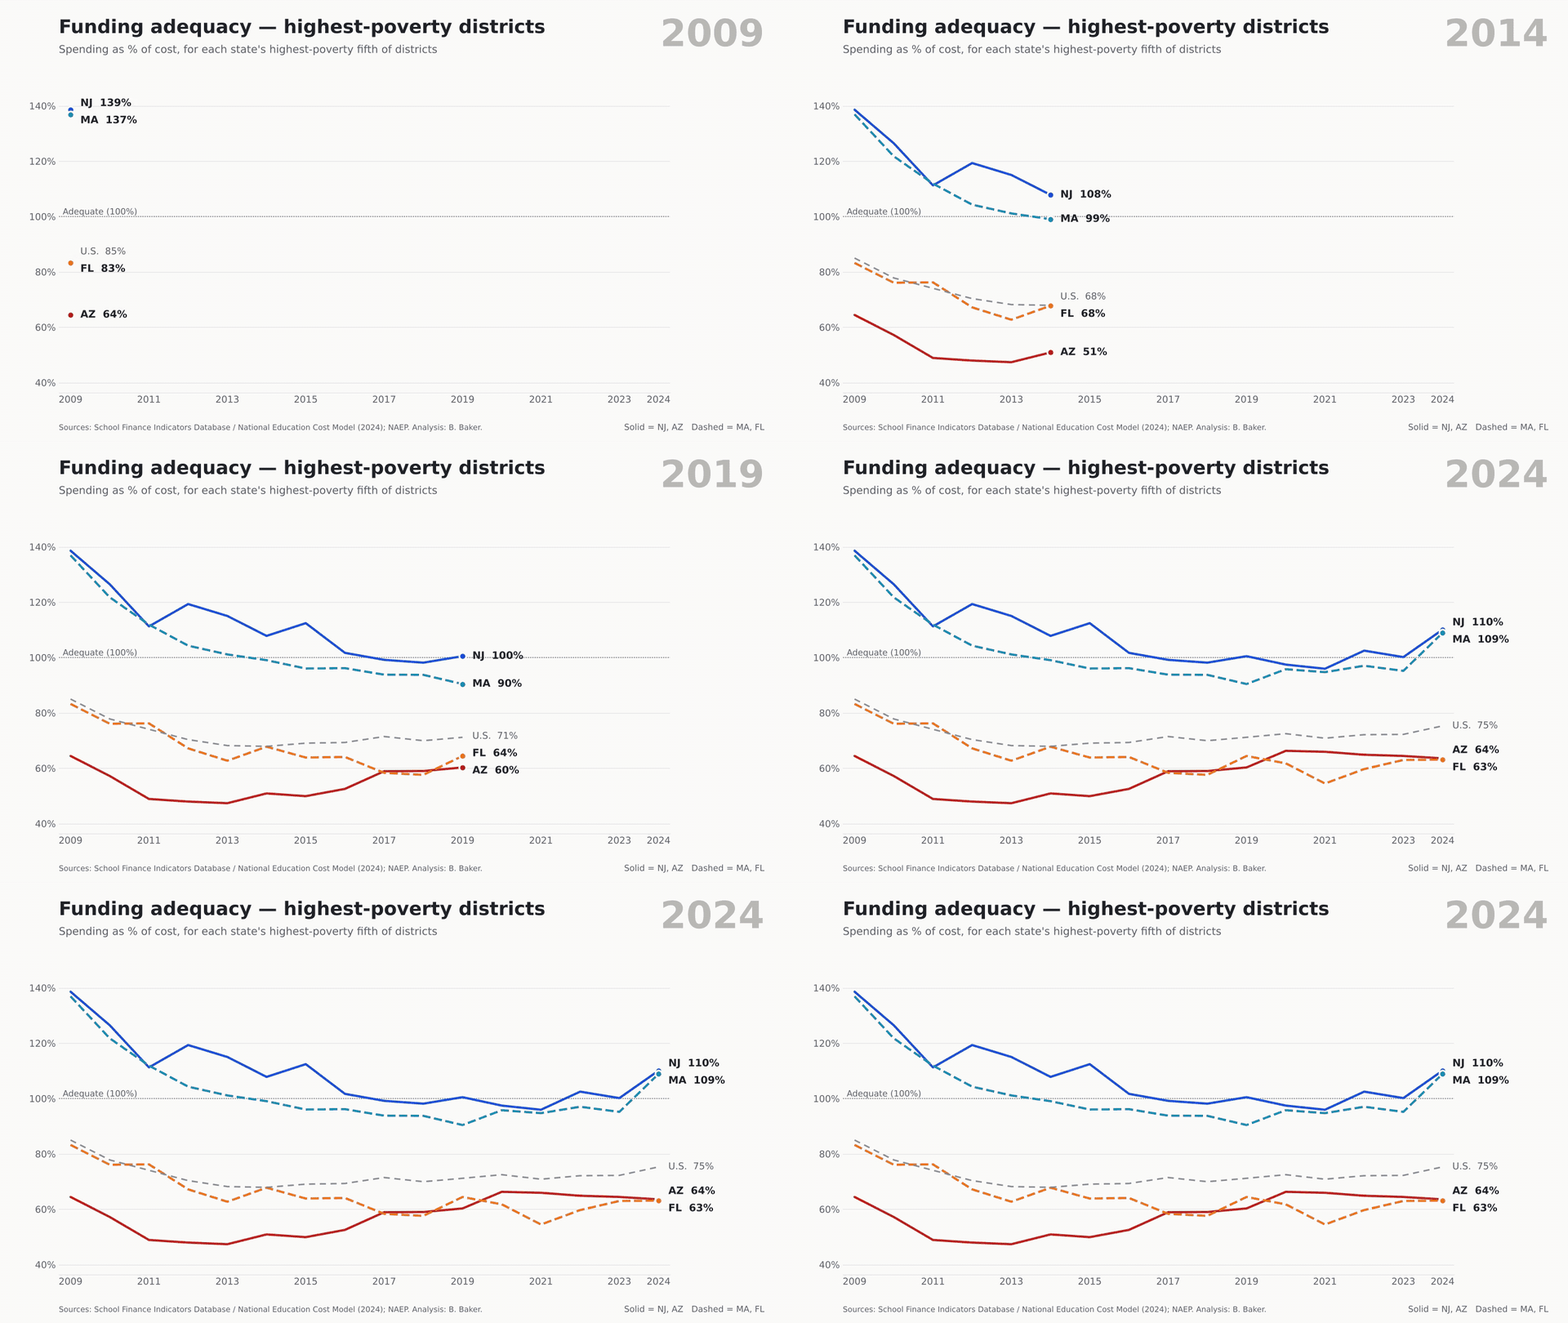
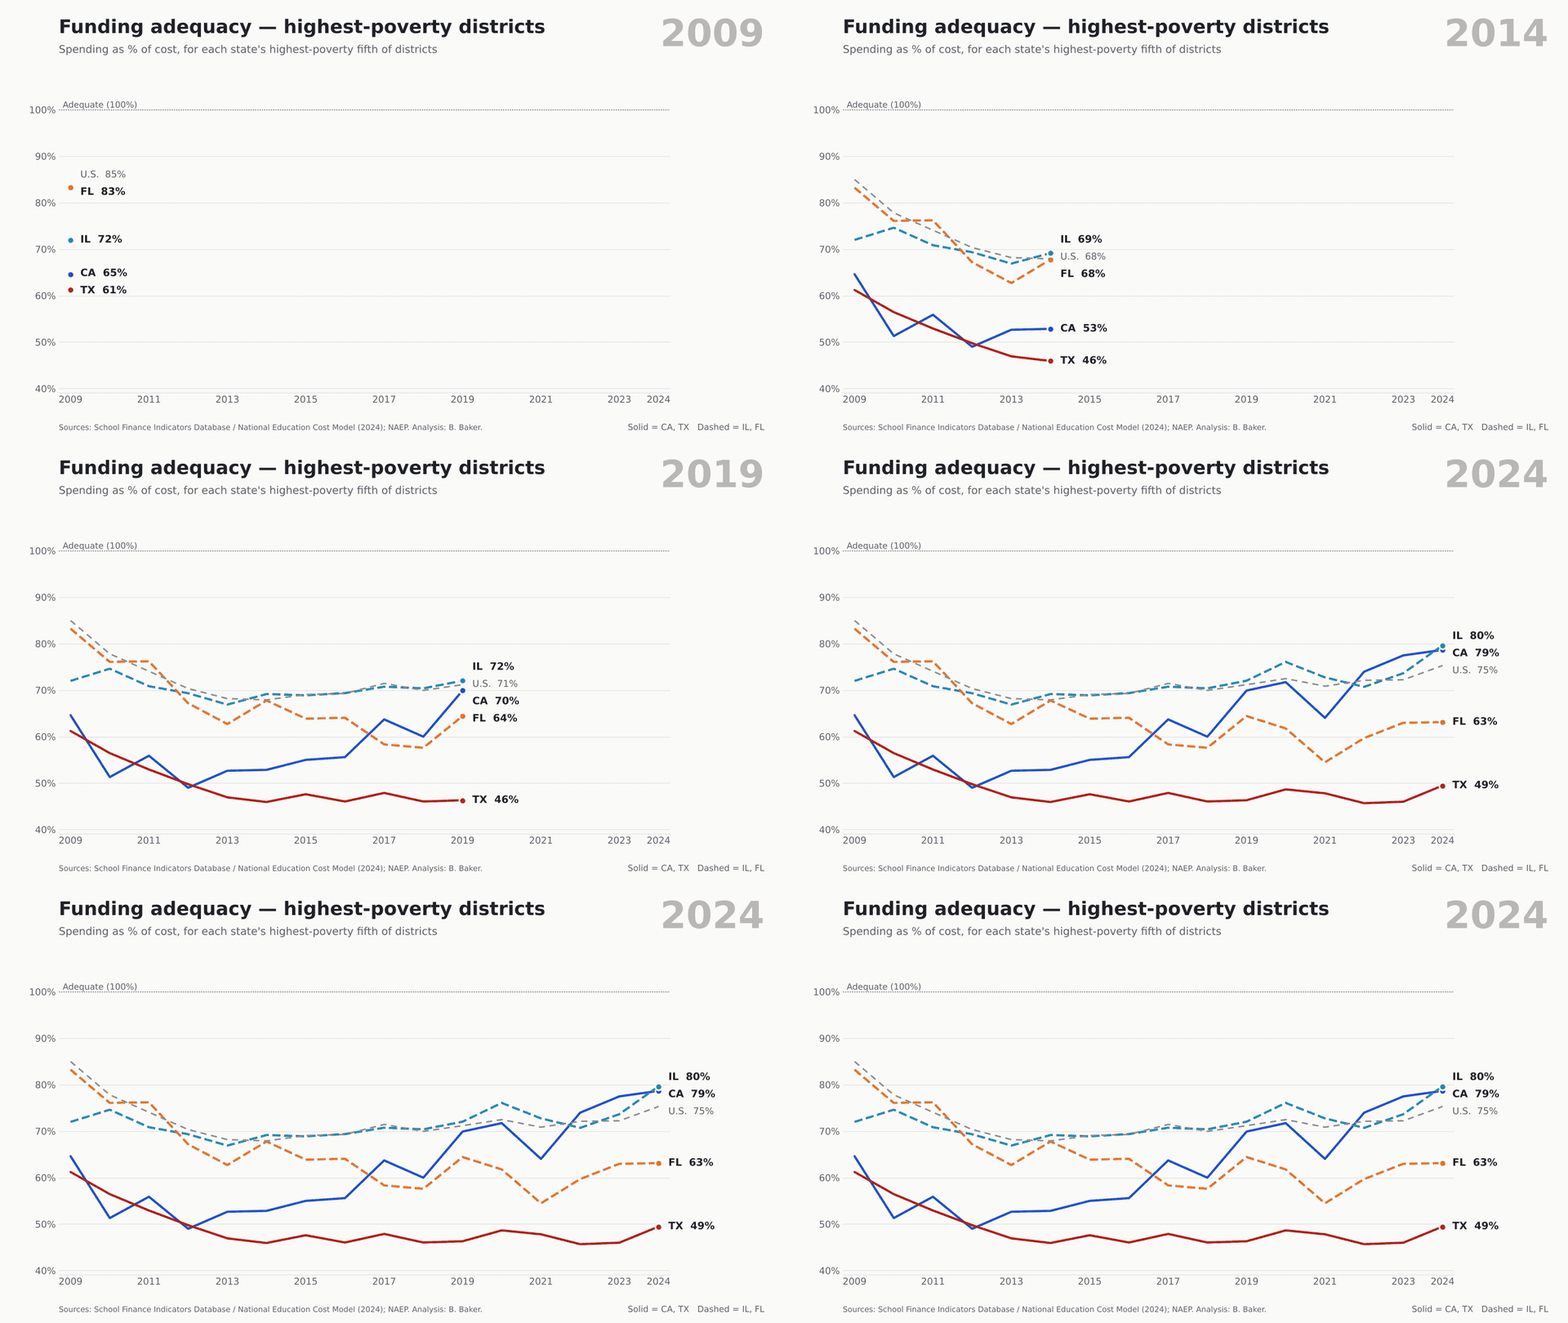
Funding adequacy in each state’s highest-poverty fifth of districts, 2009–2024. Source: School Finance Indicators Database, National Education Cost Model (2024 release).
Now, to be fair, New Jersey and Massachusetts slipped too. Both started the period well above adequate everywhere and have drifted down toward the line. But the floor in the blue states is above the ceiling in the red ones.
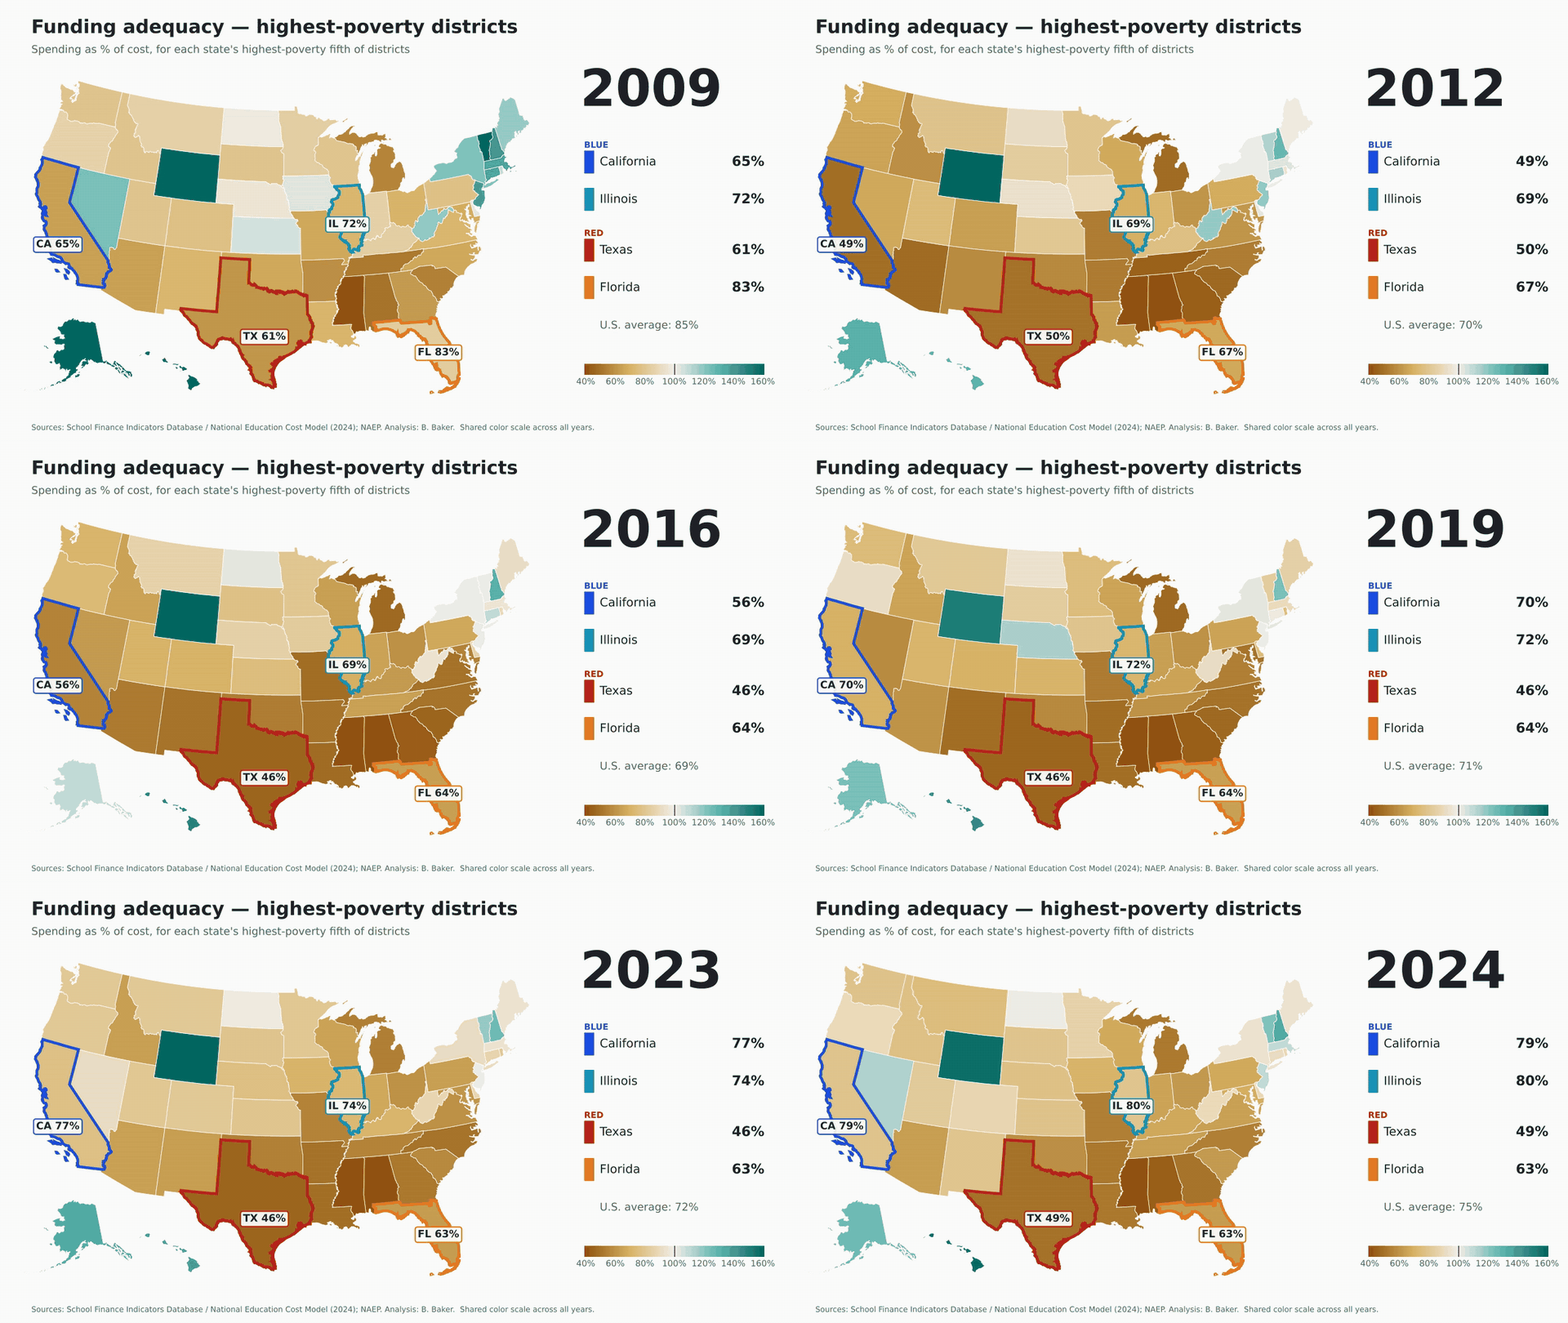
Funding adequacy in each state’s highest-poverty fifth of districts, all states, 2009–2024. Same color scale every year. Source: School Finance Indicators Database, National Education Cost Model (2024 release).
Round 2: Spending and effort
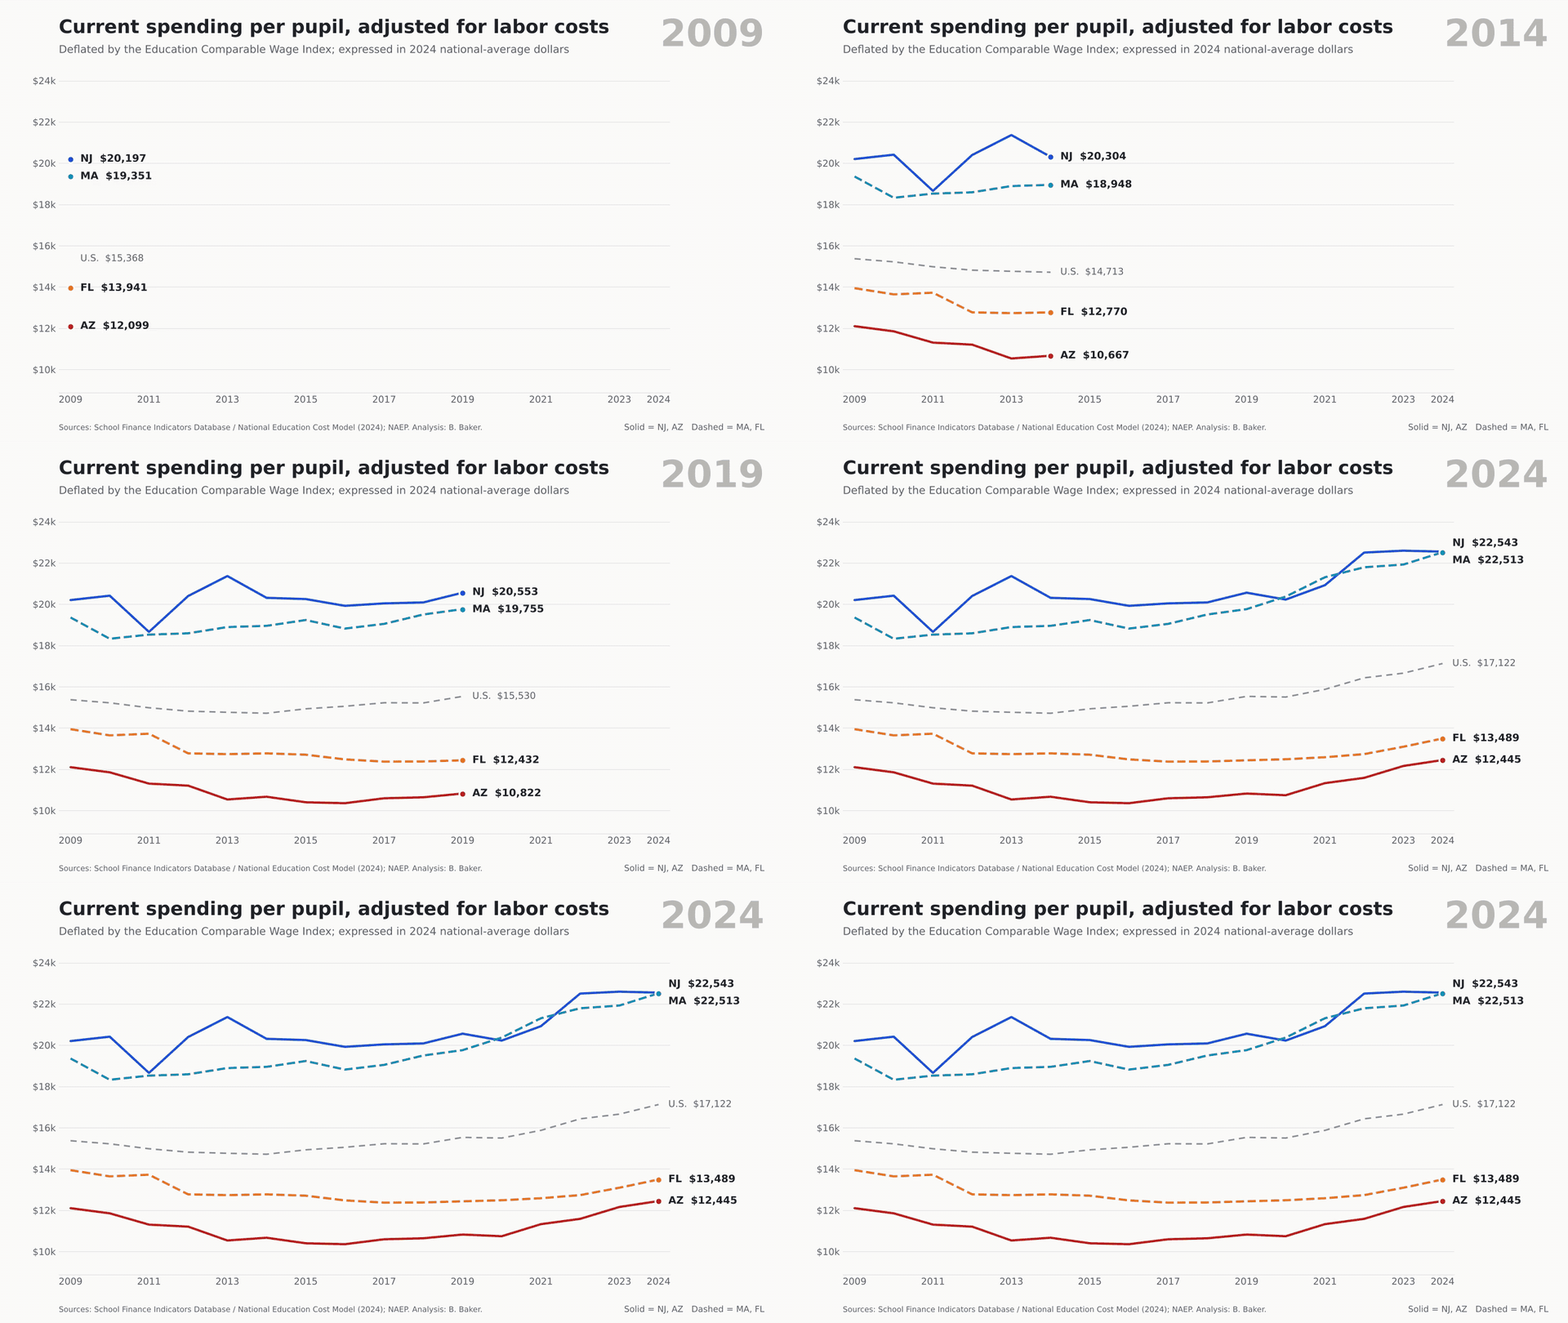
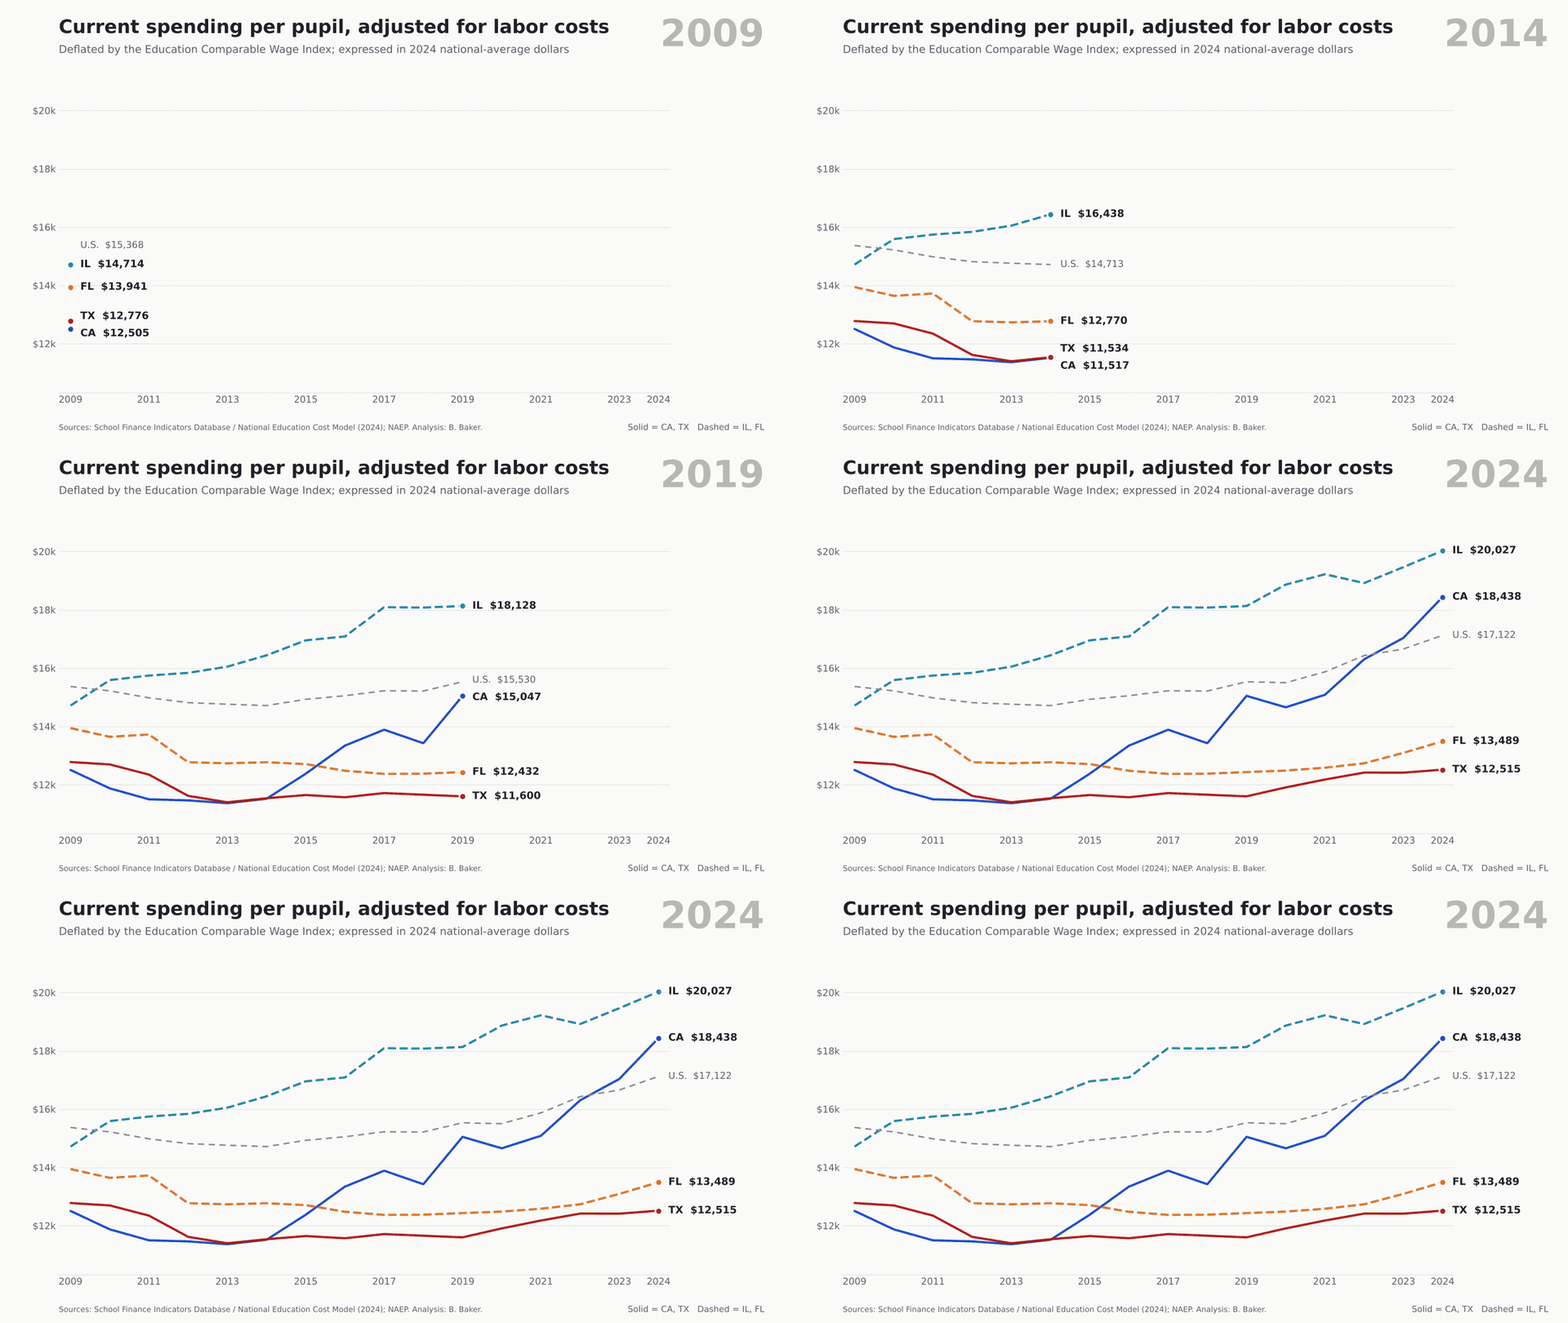
Current spending per pupil adjusted for regional labor costs and inflation (ECWI), 2024 national-average dollars. Source: School Finance Indicators Database, National Education Cost Model (2024 release).
Adjusted for labor costs, New Jersey and Massachusetts each spent about $22,500 per pupil in 2024, up 12% and 16% since 2009. Arizona spent $12,445 (up 3%) and Florida $13,489 (down 3%). The U.S. figure was $17,122. That’s a gap of roughly $9,000 to $10,000 per child, every year, in teacher time the blue states can buy and the red states can’t. Turns out you can’t freedom your way into a chemistry teacher.
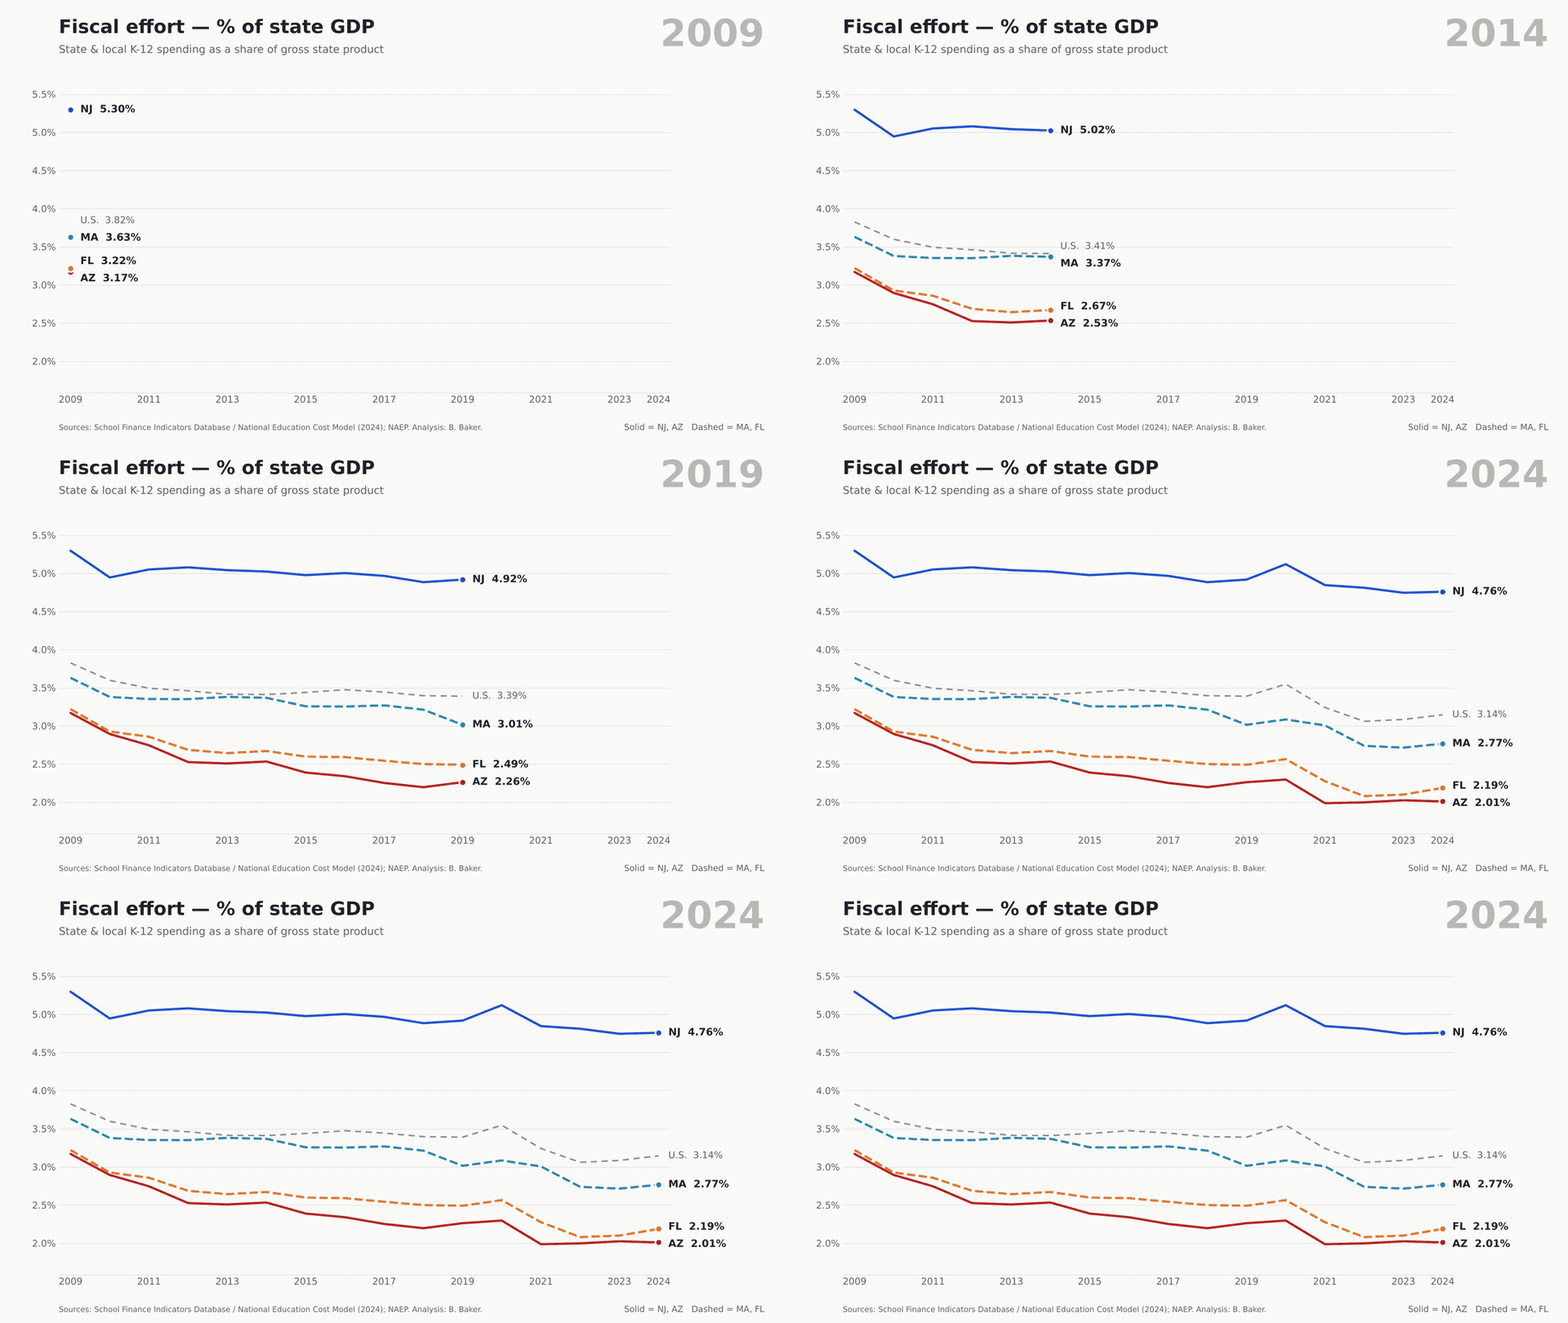
State and local K-12 spending as a percent of gross state product, 2009–2024. Source: School Finance Indicators Database.
Here’s where nobody looks great. Effort fell in all four states. New Jersey went from 5.3% of GDP to 4.8%, still by far the highest of the four. Massachusetts fell from 3.6% to 2.8%, which should worry folks in Boston more than it seems to. But Arizona (3.2% to 2.0%) and Florida (3.2% to 2.2%) fell furthest and landed lowest. By 2024 Arizona ranked second-lowest in the country on this measure, and Florida third-lowest. And that’s before most of the voucher bills came due.
Round 3: Outcomes
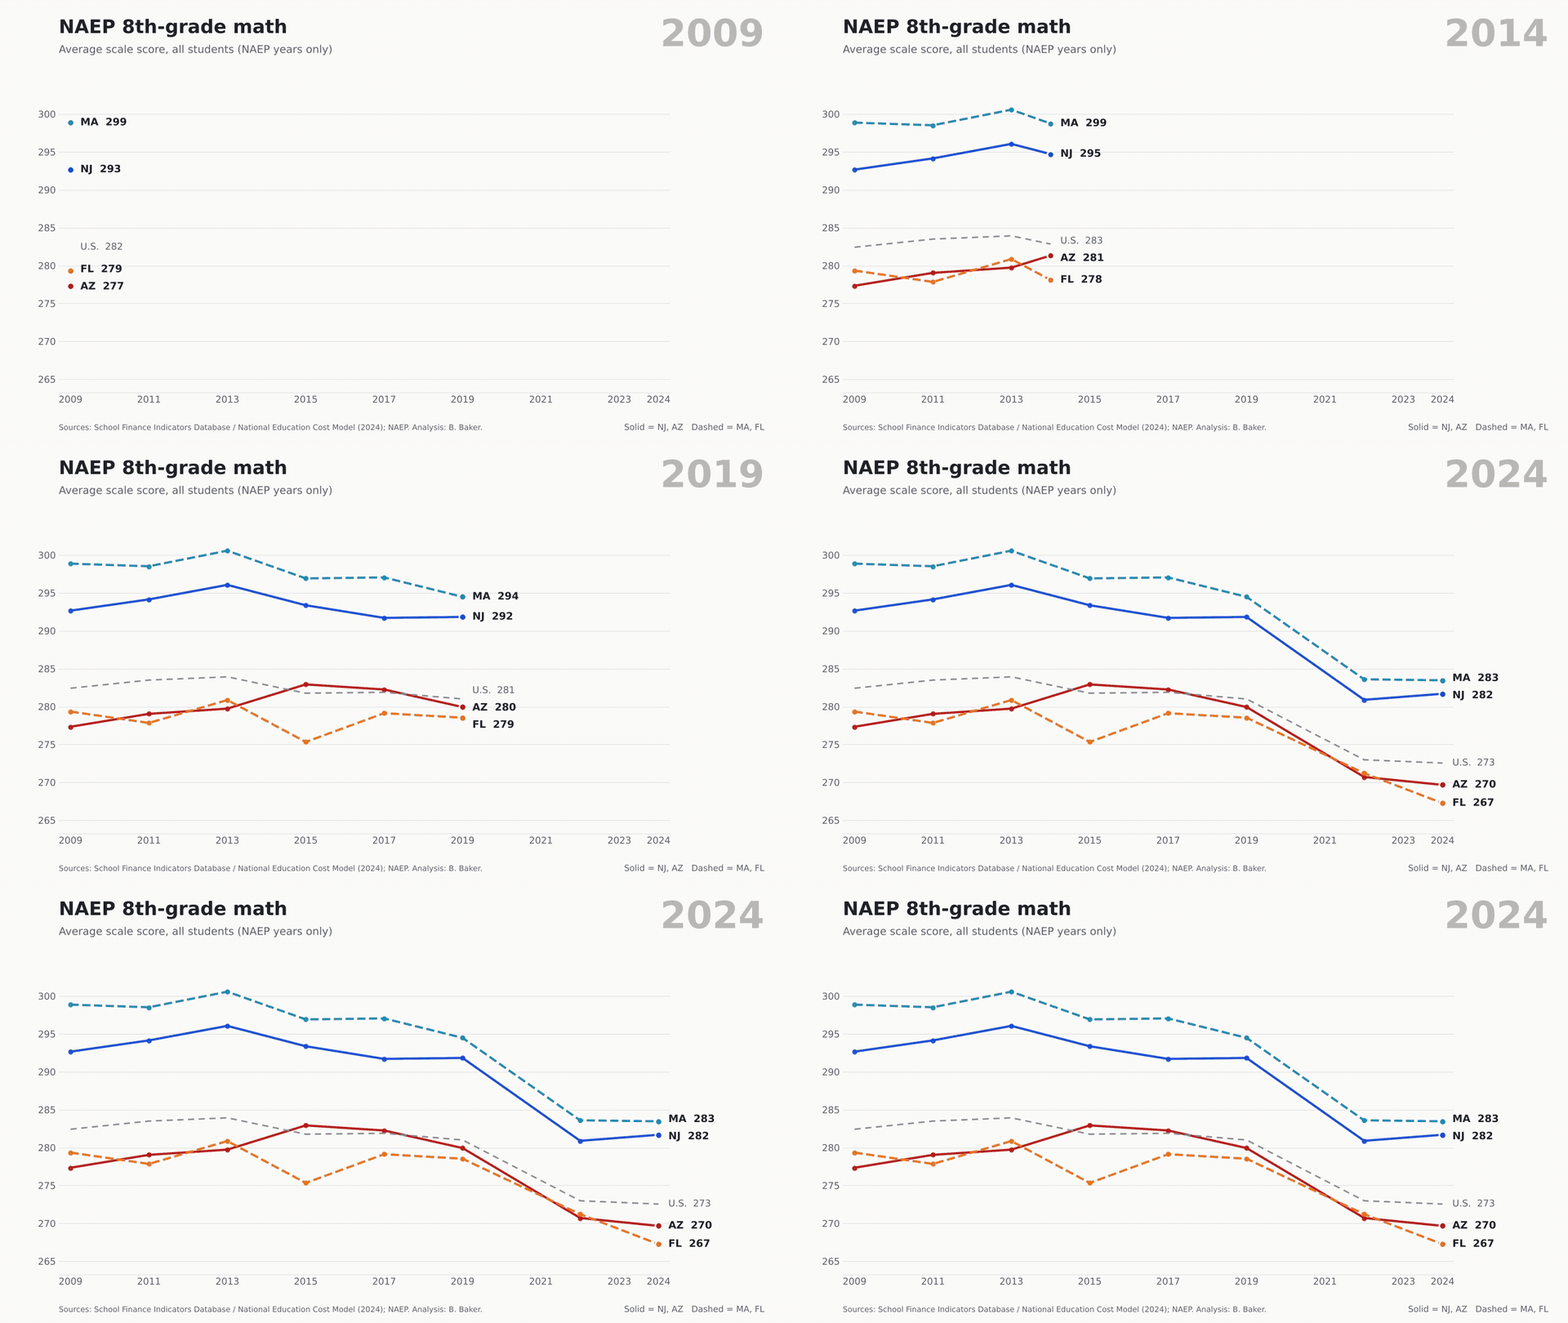
NAEP 8th-grade math, average scale score, all students, test years only (2009–2024).
Math, 2009 → 2024
Change
Reading, 2009 → 2024
Change
Massachusetts
299 → 283
−15
274 → 268
−6
New Jersey
293 → 282
−11
273 → 266
−7
Arizona
277 → 270
−8
258 → 254
−3
Florida
279 → 267
−12
264 → 253
−12
Average state
282 → 273
−10
263 → 257
−6
NAEP 8th grade, all students. Average state = simple average of states and DC.
Now, unlike the people who write those op-eds, I’m going to show you the inconvenient numbers too. This round is not a blowout on trends. Massachusetts lost 15 points in 8th-grade math, more than any of the other three. Arizona lost the least in both subjects. Credit where it’s due? Not so fast.
As I’ve been pointing out since at least the great Mis-NAEP-ery of 2013, NAEP gains and losses are highly correlated with where you start. It’s harder to gain, and easier to lose, when you’re already scoring high. It’s easier to gain, and harder to lose, when you’re scoring low. Across the 50 states and D.C., a state’s 2009 8th-grade math score correlates at −0.63 with its change through 2024 (−0.68 in reading). Start 10 points higher and you can expect to lose about 4 more points in math and 5 more in reading. So the fair comparison is against what each state’s starting point predicts. Massachusetts lost 15 points in math, but a state starting at 299 would be expected to lose about 17. New Jersey beat its expected change by about 3 points in math and 4.5 in reading; Massachusetts by about 1 in math and 6 in reading. Arizona landed right about where its low starting point predicted, within half a point in both subjects. Florida did worse than its starting point predicted, by about 3.5 points in math and 4.5 in reading. So Arizona’s “smallest loss” is mostly the luck of starting low. And Florida, which also started low, couldn’t even manage that.
But levels matter. In 2024 New Jersey and Massachusetts still scored 12 to 16 points higher in 8th-grade math than Arizona and Florida, and 12 to 15 points higher in reading. Florida’s 8th-grade reading average fell 12 points, from 264 to 253, landing below Arizona. The Florida Reading Miracle™ appears to have been recalled by the manufacturer.
And a caution I’ll repeat until I’m blue in the face: NAEP 2024 came only a year or two after these states went universal. Nothing here tells you what vouchers did to test scores. For that, we have other research. Lots of it.
Where the voucher money goes
Arizona’s Empowerment Scholarship Account program had about 97,000 students by late 2025, and the governor’s office projected ESA spending would hit about $1 billion in the fiscal year that began July 2025. Florida’s voucher programs cost about $3.9 billion in state funds in 2024–25, about 23% of the state’s public education funding, up from 12% three years earlier.
So who’s getting it?
Mostly kids who were already in private school. In Florida, 69% of the roughly 123,000 new voucher students in fall 2023 were already enrolled in private school, per Step Up for Students’ own numbers. Only 13% came from public schools. In Arizona, the state’s own superintendent says 80% of new recipients were already in private school or homeschooling when the program expanded. Josh Cowen’s review of nine states finds about 70% of voucher users had never attended public school. That’s not expanding choice. That’s a coupon for a purchase families had already made. Imagine a “school choice” program where the main choice being subsidized is the one people made before the program existed.
Disproportionately higher-income families. An Associated Press analysis of Arizona ZIP code data found about 11% of school-age children in high-income ZIP codes use ESAs, against about 4% in low-income ZIP codes. Jennifer Jennings’ analysis of Arizona’s second year found the highest take-up in some of the state’s wealthiest districts, about 13% in Cave Creek, 12% in Scottsdale and 10% in Catalina Foothills, places with plenty of highly rated public schools. She calls it a Matthew effect: to those who have, more shall be given. Cave Creek thanks you, Arizona taxpayers. In Florida, once the 2023 law lifted income limits, 56% of new private-school voucher recipients came from households above 185% of the poverty line or didn’t report income, including 27% above 400% of poverty or unreported.
Higher tuition. When you hand families a few thousand dollars earmarked for private school, private schools notice. The Hechinger Report found that of 55 Arizona private schools that posted rates, nearly all raised prices after 2022, about half by 10% or more in at least some grades, against inflation of about 6%. Nationally, Douglas Harris and Gabriel Olivier find private school tuition rose 5% to 10% more in states that expanded vouchers than in states that didn’t, with the largest increases at lower-priced, non-religious schools. Some share of every voucher dollar simply evaporates into higher sticker prices. The free market works! Just not for you.
And the kids who do switch?
This is where I’d point you to Josh Cowen’s work, including his recent book The Privateers (Harvard Education Press, 2024). Cowen spent two decades evaluating voucher programs, including as part of the official evaluation team for Milwaukee’s voucher program, and he’s now firmly opposed. The reason is the evidence. The large statewide programs studied in the last decade, in Louisiana, Indiana, Ohio and Washington, D.C., have produced academic losses for students who used vouchers to leave public schools. In Louisiana, Abdulkadiroğlu, Pathak and Walters found math scores fell by about 0.4 standard deviations after one year. Cowen notes these losses rival or exceed what we saw after Hurricane Katrina and during COVID. Add high attrition among the most disadvantaged voucher users and frequent private school closures (41% of participating schools in Milwaukee eventually closed), and you have a policy that’s costly, regressive and, on the evidence, educationally harmful for the kids it claims to rescue. Other than that, Mrs. Lincoln, how was the play?
What that money could have done
Here’s the question I actually care about. What if Arizona and Florida had put that money into the high-poverty public districts the cost model says are most underfunded?
Annual voucher/ESA spending vs. the 2024 adequacy shortfall in districts serving the higher-poverty half of each state’s public school students. Shortfall is from NECM 2024; voucher costs are for 2024–25 (Florida) and the fiscal year beginning July 2025 (Arizona).
Take the districts serving the higher-poverty half of each state’s public school students. In 2024 those districts in Arizona were about $2.8 billion short of what the cost model says it would take to reach national average outcomes. Arizona’s ESA program now costs about a billion dollars a year, or roughly 36% of that gap. In Florida the shortfall in the higher-poverty half was about $8.3 billion, and voucher spending of $3.9 billion would cover nearly half of it. Statewide, Florida’s total adequacy shortfall was about $15.7 billion; Arizona’s about $4.2 billion. Annually.
Would that money have done more good in those districts? The best recent evidence says yes, and by a lot. Emily Rauscher and Yifan Shen find that the returns to school spending are highest in places with low prior investment and high child poverty, and essentially null elsewhere. Their title says it plainly: progressive spending is efficient. In other words, targeting money to underfunded, high-poverty districts isn’t just the fair thing to do, it’s the efficient thing to do. In follow-up work with Greer Mellon, Susanna Loeb and Carolyn Abott, Rauscher and colleagues find returns to spending are significantly larger in low-resource districts, including for Black, Latinx and low-income students, with teacher salaries and counselors standing out as especially productive uses.
So compare the two bets. Bet one: send money to the districts with the lowest prior investment and highest need, where the research says each dollar has the highest return. Bet two: send money mostly to families already paying private tuition, disproportionately in affluent places, a chunk of which is absorbed by tuition increases, and for the kids who do switch, accept the risk of the large negative effects found in Louisiana, Indiana, Ohio and D.C. That’s not a close call. It’s not even a call. It’s a dial tone. As I’ve argued before, Arizona and Florida are very good at being efficiently mediocre. Vouchers are a way of spending more to be less efficient, which takes a special kind of talent.
So where would you rather raise a kid?
Let’s zoom out. Schools aren’t the only thing a state does for kids and families, and families with options don’t pick a state by NAEP alone. So here’s a broader scorecard. Some of these measures come from other folks’ rankings, and you can quibble with any one of them. Good luck quibbling with all of them.
New Jersey
Massachusetts
Arizona
Florida
Public education
Adequacy, highest-poverty districts (2024)
110%
109%
64%
63%
Adjusted spending per pupil (2024)
$22,543
$22,513
$12,445
$13,489
NAEP 8th-grade math (2024)
282
283
270
267
State pre-K: share of 4-year-olds served, state $ per child (2024–25)
35% (21st); $18,848 (2nd)
30% (25th); $3,046 (43rd)
2% (last); $8,723
63% (7th); $2,946 (44th)
Children’s well-being and services
KIDS COUNT overall rank (2026)
6th (1st in education)
2nd
40th (50th in education)
35th
State paid family & medical leave
Yes, up to 12 weeks
Yes, up to 12 weeks
No
No
Children’s health
Uninsured children (2024)
4.7% (21st)
2.1% (1st)
9.3% (49th)
8.5% (45th)
Medicaid expansion
Yes
Yes
Yes
No
Women’s health
Women’s health & reproductive care rank (2024)
19th
1st
44th
39th
Abortion access
Protected
Protected
Protected to viability (Prop 139, 2024)
Banned after 6 weeks
Quality of life, arts and culture
Life expectancy at birth (2022)
79.6 (3rd)
79.8 (2nd)
76.7 (30th)
77.9 (19th)
State arts agency funding per capita (FY2026)
$3.73 (7th)
$3.78 (6th)
$0.26 (47th)
$1.71 (19th)
Arts & culture share of state GDP (2023)
3.6% (11th)
4.0% (6th)
3.0% (19th)
3.2% (17th)
Safety and public health
Firearm deaths per 100,000 (2023)
4.6 (2nd lowest)
3.9 (lowest)
19.1 (38th)
14.4 (25th)
Violent crime per 100,000 (2024)
218
315
422
267
Measles cases, 2026 (through early October)
3
2
36
67
Kindergartners with vaccine exemptions (2025–26)
5.7%
1.8%
10.6%
5.9%
Sources: SFID/NECM; NAEP; NIEER State of Preschool 2025; Annie E. Casey Foundation KIDS COUNT 2026; American Community Survey via America’s Health Rankings; Commonwealth Fund 2024 State Scorecard on Women’s Health and Reproductive Care; CDC/NCHS U.S. State Life Tables 2022; NASAA FY2026 State Arts Agency Revenues; BEA Arts and Cultural Production Satellite Account 2023; CDC WONDER via America’s Health Rankings; FBI Uniform Crime Reports; CDC and Johns Hopkins measles tracking; KFF/CDC kindergarten exemption data. Ranks are out of 50 states; pre-K ranks out of 45 states with programs.
A few things jump out. Arizona has the worst rate of uninsured children of the four, second-worst in the nation behind only Texas, and serves 2% of four-year-olds in state pre-K. Two percent. Florida, to its credit, reaches a lot of four-year-olds with its pre-K program, then spends about $2,946 per child on it, which buys roughly what you’d expect $2,946 to buy. Florida also never expanded Medicaid, bans abortion after six weeks, a point at which many people don’t yet know they’re pregnant, and ranks 39th in women’s health. Arizona voters, to their credit, restored abortion rights to viability in 2024, which is a big part of why I wouldn’t lump the two red states together on every line. Neither offers paid family leave. Both New Jersey and Massachusetts do. (And before anyone in Boston gets smug: Massachusetts spends about $3,046 per child on state pre-K, 43rd in the nation, right down there with Florida. New Jersey spends $18,848, second only to D.C. Not all blue states are created equal.)
And then there’s arts and culture. Massachusetts and New Jersey fund their state arts agencies at about $3.75 per resident. Arizona manages 26 cents. Florida was at least in the middle of the pack, until Governor DeSantis vetoed roughly $32 million in arts and culture grants in 2024, later explaining that a fringe theater festival was “an inappropriate use of taxpayer dollars.” Nothing says “family-friendly” like zeroing out the state’s arts grants because of a festival you didn’t want to attend. (Private school tuition at Cave Creek’s finest, on the other hand, is apparently an appropriate use of taxpayer dollars.)
Then there’s the matter of whether your kid makes it home. Arizona’s firearm death rate is nearly five times Massachusetts’; Florida’s is more than three times. Arizona also has the highest violent crime rate of the four. In fairness (I keep doing that, it’s a character flaw), Massachusetts’ violent crime rate runs higher than Florida’s, and New Jersey’s is the lowest of the bunch. But on guns, it’s not close.
And then measles, a disease the United States declared eliminated in 2000. So far in 2026, Florida has logged 67 cases and Arizona 36. New Jersey has 3. Massachusetts has 2. Arizona now exempts 10.6% of its kindergartners from school vaccine requirements. Florida’s surgeon general has been campaigning to end school vaccine mandates altogether. The legislature hasn’t gone along, yet, but the state’s kindergarten vaccination completion rate has already slid to 88.9%. Nothing says “family values” like a measles outbreak in the kindergarten wing.
a) Where to raise a child
If you’re picking a place to raise a kid, this isn’t a hard call. Massachusetts and New Jersey offer adequately funded public schools even in their poorest districts, near-universal children’s health coverage, paid leave when the baby arrives, protected reproductive health care for the mother, longer life expectancies, and a public sector that thinks the arts are worth a few bucks per resident. Arizona and Florida offer lower taxes, sunshine, schools funded at about two-thirds of adequate if you’re poor, roughly a 1-in-11 chance your kid is uninsured, three to five times the firearm death rate, a front-row seat to the measles comeback, and a voucher if you were already paying private school tuition. Pick your poison. Actually, don’t. Pick Massachusetts or New Jersey.
b) Where to recruit young, educated families
Now put on your HR hat. You’re trying to recruit a 32-year-old engineer with a spouse, a toddler and another on the way. Housing will cost them more in Boston or northern New Jersey than in Phoenix or Tampa, and their tax bill will be higher. That’s real, and I won’t pretend otherwise. But here’s what that money buys: a public school they don’t have to flee, twelve weeks of paid leave, pediatric coverage that isn’t a coin flip, classmates who are vaccinated, an OB-GYN who doesn’t have to consult a lawyer before treating a miscarriage, and a cultural life that isn’t subject to gubernatorial veto. Families who can choose, choose that. The ones you’re trying to recruit can choose.
But wait, says the Florida recruiter, our engineer doesn’t need the public schools. He can use the voucher! Let’s do the math. Say our family makes $200,000 a year and has two kids, and they want the full Florida elite-private experience. Ransom Everglades in Miami runs $57,300 a year. Times two, that’s $114,600. Florida’s now-universal scholarship averages roughly $8,000 per student, so knock off about $16,000. That leaves about $98,600 a year, out of pocket, in after-tax dollars.
Now, what does Florida save that family by not having an income tax? In New Jersey, $200,000 of joint income with two kids runs about $8,400 in state income tax. In Massachusetts, it’s about $9,500 at the flat 5% rate (a bit less after the state’s child credit). And that’s before the federal SALT deduction gives some of it back. So the family “saves” about $9,000 a year in Florida, plus $16,000 in vouchers. Call it $25,000 in Florida perks to put toward a $114,600 tuition bill. In New Jersey or Massachusetts, the same family sends both kids to a public school funded at better than 130% of adequate (and still above 100% even in the highest-poverty districts), and pays $0 in tuition. Even if you go modest, at a $30,000-a-year private school, the Florida family is out about $44,000 a year after the voucher, five times the income tax it “saved.” Yes, New Jersey property taxes are steep. Part of what they buy is a school you don’t have to pay $57,300 to escape. The low-tax Florida deal works beautifully for one family: the one that was already going to pay private tuition anyway, and now gets $16,000 back from the state for doing it.
Arizona and Florida are betting that young professionals will trade all of that for lower taxes and a voucher. Some will. But the rest are going to look at those uninsured-kid numbers, those gun death rates, those adequacy numbers in the districts they can afford to live in, and that six-week ban, and quietly accept the offer from the firm in Cambridge.
The bottom line
The blue states fund adequacy. The red states don’t. Highest-poverty districts: about 110% of adequate in NJ and MA, about 63–64% in AZ and FL. 98% of AZ and FL students attend underfunded districts.
About $9,000–10,000 more per pupil in the blue states, adjusted for labor costs. Arizona and Florida rank 2nd- and 3rd-lowest in the nation on effort.
Outcomes: everyone lost ground after 2019. Raw losses were largest in Massachusetts math and smallest in Arizona, but NAEP changes track starting levels. Measured against what their 2009 scores predicted, New Jersey and Massachusetts did better than expected, Arizona did about as expected, and Florida did worse. The blue states still lead by 12–16 points. Florida’s reading miracle is over.
Vouchers: billions a year, mostly to families already in private school, disproportionately affluent, partly eaten by tuition hikes, with large negative effects in the best studies of statewide programs.
Opportunity cost: the same money in underfunded high-poverty districts would likely have bought far more, per Rauscher’s work on progressive spending.
Beyond schools: on children’s health, women’s health, paid leave, life expectancy, gun deaths, measles, and arts and culture, Massachusetts and New Jersey come out ahead. (Violent crime is the one place Florida edges Massachusetts.) Arizona is the clear laggard on kids’ coverage and pre-K; Florida on reproductive health and Medicaid.
Arizona and Florida chose to spend billions on private tuition while leaving their highest-poverty public districts at two-thirds of adequate, their kids under-insured and their arts councils on a diet. That’s a choice. It’s not an efficient one, it’s not a family-friendly one, and it’s certainly not a miracle.
Data notes
Finance measures are from the School Finance Indicators Database. Adequacy uses the National Education Cost Model (2024 release): current spending per pupil divided by the modeled cost of national average outcomes, aggregated to states as total spending over total cost (enrollment-weighted). Highest- and lowest-poverty districts are the top and bottom fifths of each state’s districts by Census child poverty. Adequacy shortfalls sum enrollment times the gap between cost and spending across underfunded districts; the “higher-poverty half” is the set of districts serving the half of public school students in the highest-poverty districts. Labor-cost adjusted spending divides by the Education Comparable Wage Index, rescaled to 2024 national-average wage levels. Effort is state and local K-12 spending as a share of gross state product. NAEP figures are 8th-grade state averages for all students in test years. Expected NAEP changes come from a simple cross-state regression (50 states and DC) of each state’s 2009–2024 change on its 2009 level; “better or worse than expected” is the residual from that regression. Voucher cost and enrollment figures come from the sources linked in the text, and reported figures differ somewhat by source and year.
Sources
School Finance Indicators Database: state panel and NECM district file
Baker, B. D., Weber, M., & Srikanth, A. (2021). Informing federal school finance policy with empirical evidence. Journal of Education Finance, 47(1), 1–25.
Baker, B. D. (2025). How and why racial isolation affects education costs and the provision of equal educational opportunity. Education Policy Analysis Archives, 33(55).
Abdulkadiroğlu, A., Pathak, P., & Walters, C. (2018). Free to Choose: Can School Choice Reduce Student Achievement? American Economic Journal: Applied Economics, 10(1).
Every few months the red-state-miracle story makes the rounds again. Florida’s reading “renaissance.” Texas’s math scores. Low taxes, lean budgets, school choice for all, and results to show for it. Meanwhile California and Illinois are cast as the cautionary tales: high-tax, high-spending, union-run fiscal basket cases pouring money into failing schools. Cue the op-ed. Cue the legislative testimony.
So let’s do the head-to-head the narrative invites. The two largest blue states, California and Illinois, against the two largest red states, Texas and Florida. Same cost model, same adjustments, same NAEP tests, 2009 through 2024.
Here’s the short version. The blue states raised their real investment in schools by more than a third and, on NAEP, held up better than the average state. The red states let their effort slide by roughly 30%, fell further and further behind what it would cost to get their kids to even national average outcomes, and gave back the 8th-grade NAEP advantage they once held. Then, because I can’t help myself, a word of caution for my blue-state friends: you’re not done. Not even close.
Round 1: Is the money enough?
I’ve explained the National Education Cost Model enough times on this blog that some of you could recite it back to me. But briefly: for every district in the country, the model estimates what it would cost to reach national average outcomes given the kids it serves, the wages it has to pay to compete for teachers, its size and its population density. Divide actual current spending by that cost and you get percent of adequate. At 100%, spending covers the cost. As I’ve noted recently, national average is a low bar. It asks only that kids score like the typical American kid.
Statewide, here’s where things stood:
State
2009
2024
Illinois
101%
101%
California
84%
92%
Florida
94%
70%
Texas
80%
59%
Funding adequacy, all districts. Enrollment-weighted: total spending over total cost. Source: School Finance Indicators Database, National Education Cost Model (2024 release).
In 2009 these four states were bunched together, between 80% and 101%. By 2024 they had split cleanly in two. Texas districts, on average, spend 59 cents for every dollar it would take to get their kids to national average outcomes. Florida spends 70 cents.
But statewide averages always hide the part that matters most. So let’s look at each state’s highest-poverty fifth of districts, the kids for whom adequate funding matters most.
Funding adequacy in each state’s highest-poverty fifth of districts, 2009–2024. Source: School Finance Indicators Database, National Education Cost Model (2024 release).
Florida’s highest-poverty districts actually started out as the best funded of the four, at 83% of adequate. They ended at 63%. Texas’s went from 61% to just under 50%. Let that sink in. The highest-poverty districts in Texas are spending about half of what it would take to get their kids to national average outcomes. California’s climbed from 65% to 79%, most of that after the Local Control Funding Formula began phasing in after 2013. Illinois inched up from 72% to 80%.
Or put another way: by 2024, 98% of students in Texas and 98% of students in Florida attended districts funded below adequate levels. Not a typo. Ninety-eight percent. In 2009 it was 73% and 70%. In California it’s now 67%, down from 74%. In Illinois, 51%.
Here’s the same measure across all fifty states. Watch the South.
Funding adequacy in each state’s highest-poverty fifth of districts, all states, 2009–2024. Same color scale every year. Source: School Finance Indicators Database, National Education Cost Model (2024 release).
Round 2: Spending and effort
Now, I can already hear it. “But spending went up everywhere!” In nominal dollars, sure. So did the wages schools have to pay to hire and keep college-educated people. That’s why I adjust spending by the Education Comparable Wage Index, which asks a simple question: can a state buy more teacher time per kid today than it could in 2009?
Current spending per pupil, adjusted for regional labor costs and inflation (ECWI), in 2024 national-average dollars. Source: School Finance Indicators Database, National Education Cost Model (2024 release).
California: up 47%. Illinois: up 36%. Florida: down 3%. Texas: down 2%. In 2024 dollars at national average wage levels, that’s $18,438 in California and $20,027 in Illinois, against $13,489 in Florida and $12,515 in Texas. The U.S. figure was $17,122. Fifteen years, and Texas and Florida are buying less than they were in 2009.
Why? Because they chose to. Here’s fiscal effort, state and local K-12 spending as a share of state GDP:
State and local K-12 spending as a percent of gross state product, 2009–2024. Source: School Finance Indicators Database.
Texas went from 3.66% to 2.61%. Florida from 3.22% to 2.19%. Both cut the share of their economies going to schools by roughly 30%. Measured against personal income, it’s the same story: Texas from 4.7% to 3.3%, Florida from 3.5% to 2.2%. By 2024, Florida put a smaller share of its residents’ income into public schools than any other state, and ranked third-lowest as a share of GDP. Illinois, the supposed poster child for fiscal dysfunction, actually raised its effort a bit, from 3.66% to 3.82% of GDP. California’s dipped slightly, but its economy grew fast enough, and its formula targeted enough of that growth toward high-need districts, that real spending still soared.
This isn’t a story about states that ran out of money. It’s a story about states that decided not to spend it on schools.
Round 3: So what happened to the kids?
This is where the red-state narrative is supposed to save itself. Lean budgets, better results, right? In 2009, Texas really did have the highest 8th-grade NAEP math average of the four, at 287, and Florida wasn’t far behind Illinois. That was the story. Here’s what happened next.
NAEP 8th-grade math, average scale score, all students, test years only (2009–2024).
Math, 2009 → 2024
Change
Reading, 2009 → 2024
Change
California
270 → 269
−2
253 → 254
+2
Illinois
282 → 277
−5
265 → 262
−3
Texas
287 → 269
−17
260 → 252
−8
Florida
279 → 267
−12
264 → 253
−12
Average state
282 → 273
−10
263 → 257
−7
NAEP 8th grade, all students. Average state = simple average of states and DC.
Yes, everyone took a hit after the pandemic. The average state lost about 10 points in math and 7 in reading. Against that baseline, Texas and Florida fell further. California and Illinois held up better, and California was the only one of the four to gain in reading. By 2024, the four states sat within about ten points of each other in math, and Texas and Florida had dropped below California in reading.
And no, you can’t blame it all on COVID. Texas’s math average fell 7 points between 2009 and 2019, from 287 to 280, while the average state dipped by about 1. Florida’s reading slide, on the other hand, is mostly post-2019: 263 in 2019, 253 in 2024. So much for the renaissance.
Now, the usual response here is that Texas simply had farther to fall, and California had nowhere to go but up. Fair enough, and it’s a point I’ve been making since at least the great Mis-NAEP-ery of 2013: NAEP gains and losses are highly correlated with where you start. It’s harder to gain, and easier to lose, when you’re already scoring high. It’s easier to gain, and harder to lose, when you’re scoring low. Across the 50 states and D.C., a state’s 2009 8th-grade math score correlates at −0.63 with its change through 2024 (−0.68 in reading). So let’s give everyone credit for their starting point. Texas, starting at 287, would be expected to lose about 12 points in math. It lost 17, about 5.5 points worse than expected, and it came in about 3 points worse than expected in reading. Florida came in about 3.5 points worse than expected in math and 4.5 in reading. California beat its expected change by about 3 points in both subjects. And Illinois, which started right at the national average, beat its expected change by about 5 points in math and 4 in reading. Account for where they started, and the blue states did better than expected while the red states did worse. The lines crossed.
Here’s money and math together. Each dot is a state at each NAEP administration, with the four highlighted states leaving trails behind them.
Funding adequacy in highest-poverty districts vs. NAEP 8th-grade math, 2009–2024. Gray dots are other states.
Texas slides down and to the left. Florida slides down and to the left. California moves right. Illinois moves right. You don’t need a regression to see which direction you’d rather be headed.
Unfinished business in the blue states
Before my friends in Sacramento and Springfield start taking victory laps, let’s be clear. Improved is not the same as fixed. Neither state comes close to providing equal educational opportunity. In both, the lowest-poverty districts are funded well above adequate levels, while the highest-poverty districts remain well below.
Funding adequacy in each state’s lowest-poverty vs. highest-poverty fifth of districts, 2009 and 2024. Source: School Finance Indicators Database, National Education Cost Model (2024 release).
Illinois has the widest gap of the four. Its lowest-poverty districts spend about 151% of what the cost model says they need, roughly $7,100 per pupil above adequate, while its highest-poverty districts sit at 80%, about $5,800 per pupil short. That gap was 96 points in 2009 and is 71 points now. Progress, yes. Equal opportunity, no. Even after the 2017 Evidence-Based Funding reform, state and local revenue per pupil in Illinois is still slightly lower in high-poverty districts than in low-poverty ones (a progressiveness ratio of 0.92). EBF was the right idea. It just hasn’t been funded at anything like the pace needed to finish the job.
California has done more. LCFF cut the gap between its lowest- and highest-poverty districts from 55 points to 36. But California’s highest-poverty districts still fall about $5,600 per pupil short of adequate. In both states, about 95% of students in the highest-poverty districts still attend districts funded below adequate levels.
And no, the smaller gaps in Texas and Florida are not a sign of fairness. They narrowed because the lowest-poverty districts fell below adequacy too. Texas’s lowest-poverty districts went from 113% of adequate to 70%. That’s not equal opportunity. That’s equal inadequacy. Everyone’s screwed, just to varying degrees.
What this does and doesn’t show
Let me be careful here, since I spend a fair amount of time on this blog yelling at people who aren’t. Four states, plotted side by side over time, do not prove that money caused the NAEP divergence. These states differ in demographics, immigration patterns, testing exclusions, policy histories and how hard the pandemic hit. Credible causal answers come from the kind of panel studies the school finance literature has spent two decades building, and that research consistently finds that money matters, especially for kids from low-income families.
What these data do show is that the red-state model of low effort and lean budgets didn’t buy better results over this period. As I argued a couple weeks back, Florida and Texas are very efficient at producing relatively low outcomes. Efficient isn’t the same as good. They held school spending flat in real terms while their highest-poverty districts slid to between half and two-thirds of adequate. Their 8th-grade scores fell further than the average state’s, and further than their starting points would predict.
California and Illinois, the supposed cautionary tales, did the opposite. They raised real spending by more than a third, pushed a good share of it toward higher-need districts, and held up better on NAEP than the average state.
The bottom line
The red states disinvested. Texas and Florida cut school effort by roughly 30% and let real spending per pupil stall for fifteen years.
Their poorest districts paid the price. High-poverty districts in Texas now spend about half of what national average outcomes would cost. Florida’s spend under two-thirds. 98% of students in both states attend underfunded districts.
The NAEP advantage is gone. Texas lost 17 points in 8th-grade math and Florida 12, against 10 for the average state. Even accounting for where each state started, Texas and Florida fell further than expected, while California and Illinois did better than expected.
The blue states moved in the right direction. Real spending up 36–47%, high-poverty adequacy up, and better NAEP trajectories.
But they’re not done. Illinois’s rich districts are funded at 151% of adequate while its poor ones sit at 80%. California’s gap is 36 points. Finish the job.
So the next time someone holds up Texas or Florida as proof that you can do more with less, ask them a simple question: more what? Fifteen years of data here, and the answer looks a lot more like “less with less.”
Data notes
All finance measures come from the School Finance Indicators Database. Adequacy uses the National Education Cost Model (2024 release): district current spending per pupil divided by the modeled cost of national average outcomes, aggregated to states as total spending over total cost (enrollment-weighted). Highest- and lowest-poverty districts are the top and bottom fifths of each state’s districts by Census child poverty rate. Labor-cost adjusted spending divides current spending per pupil by the Education Comparable Wage Index, rescaled to 2024 national-average wage levels. Fiscal effort is state and local K-12 spending as a share of gross state product and state and local school revenue as a share of personal income. NAEP figures are 8th-grade state averages for all students, test years only (2009, 2011, 2013, 2015, 2017, 2019, 2022, 2024). Expected NAEP changes come from a simple cross-state regression (50 states and DC) of each state’s 2009–2024 change on its 2009 level; “better or worse than expected” is the residual from that regression.
Sources
School Finance Indicators Database: state panel and NECM/SEDA district file (data behind all figures)
Baker, B. D., Weber, M., & Srikanth, A. (2021). Informing federal school finance policy with empirical evidence. Journal of Education Finance, 47(1), 1–25.
Baker, B. D. (2025). How and why racial isolation affects education costs and the provision of equal educational opportunity. Education Policy Analysis Archives, 33(55).
In 2009, the School District of Philadelphia spent about 59% of what it would cost to get its kids to national average outcomes. In 2024, it spent about 55%. Fifteen years, two governors’ worth of “fair funding” talk, one landmark court ruling, and the city sits right about where it started: roughly half of adequate.
Meanwhile, just across City Avenue, Lower Merion spent 333% of adequate in 2009 and 226% in 2024. It’s down, sure. It’s still more than four times Philadelphia’s position on the same yardstick.
I’ve been writing about Philadelphia on this blog for well over a decade. It keeps showing up because it keeps being the clearest case of a pattern I see across states: a state school finance system that provides systematically less to the districts that need the most, and then blames those districts for the results. This is the Philadelphia Story, updated through 2024, and through the state’s response to having its system ruled unconstitutional.
Philadelphia, “screwed,” and the myth of the money pit
Philadelphia has been a fixture on my lists of the nation’s most financially disadvantaged (“screwed”) city school districts for as long as I’ve been making them. Those lists measure state and local revenue per pupil relative to other districts in the same labor market, alongside child poverty relative to that same market. Philadelphia always lands there in good company: Reading and Allentown, often at or near the very top of the mid-size city list. When Next City covered the list in 2013, Pennsylvania had 11 districts on it, more than any other state, and Philadelphia was handing out 3,783 layoff notices to close a $300 million hole.
“They’ve thrown millions at Philly and gotten nothing”
Then there’s the storyline that won’t die. Philadelphia, we’re told, is the cautionary tale: a district that has been handed millions upon millions, with nothing to show for it. Proof that money doesn’t matter. Time to close schools, charter everything, and move on.
I took this on in 2013 in Debunking Reformy “Messaging”: A Philadelphia Story, after claims circulated that Philadelphia received among the most state aid in Pennsylvania. Of course it does, in total. It’s the largest district in the state. Big aggregate numbers (state aid totals, a multi-billion-dollar operating budget) say nothing about whether the dollars per child are sufficient for the children actually enrolled. Per pupil, relative to need and relative to its neighbors, Philadelphia has been short for as long as anyone has been measuring.
The “handed millions, got nothing” argument requires a period in which Philadelphia was actually handed enough. The graphics below show there was no such period. Not in 2009. Not in 2013. Not in 2021. Not in 2024. You can’t conclude money didn’t work when the money never showed up. As I put it back then, “real reform must begin with resources!”
What adequacy actually costs, and which bar we’re setting
In 2014, Jesse Levin and I wrote Educational Equity, Adequacy, and Equal Opportunity in the Commonwealth for the William Penn Foundation. The headline was not subtle. Pennsylvania ran one of the least equitable state school finance systems in the nation. Funding was regressive, with higher-poverty districts receiving less state and local revenue per pupil than lower-poverty ones. Against the state’s own 2008 costing-out targets, shortfalls approached $4,000 per pupil in the highest-poverty quintile, versus about $1,200 in the lowest. Districts with smaller funding gaps, all else equal, posted higher PSSA and SAT results.
The national education cost model (NECM) in the School Finance Indicators Database extends that logic nationally. It estimates, for every district, what it would cost to reach a given outcome target, accounting for poverty, labor costs, scale, and population density. In The Real Shame of the Nation, we found Philadelphia, Reading, and Allentown spending roughly half of what it would take to reach national average outcomes, and performing about where the model would predict for that spending. Lower Merion, next door, spent nearly four times its estimated need.
The formula that almost was
Pennsylvania did once try to fix this. A 2007 state costing-out study found that 474 of 501 districts spent less than an adequate amount, and that closing the gap would take about $4.4 billion more a year, roughly $1 billion of it in Philadelphia alone. In 2008, Governor Ed Rendell pushed through a new need-based formula built on that study, with the goal of raising the state’s share by $2.6 billion a year by 2014. It would have helped. The first year brought a $275 million increase in basic education funding.
Then the Great Recession hit. In 2009-10 and 2010-11, the state cut its own contribution and backfilled with $654 million a year in federal stimulus money, so the formula’s “increases” were largely federal dollars. When the stimulus ran out, the 2011-12 budget under Governor Tom Corbett cut education aid deeply and the formula was abandoned. Philadelphia’s slide in the graphics below, from 59% of adequate in 2009 to the mid-40s, is what that collapse looks like on the ground.
Two bars: national average and Massachusetts average
The graphics below use the national average outcome as the target. That’s worth dwelling on, because it’s a low bar. It doesn’t ask Philadelphia’s kids to be exceptional. It asks only that they score like the typical American child. Philadelphia hasn’t been funded to clear even that.
Now raise the bar to the Massachusetts average, the outcome level of the nation’s consistently top-performing state, and a reasonable stand-in for what a well-funded, high-expectation system can deliver. The cost of reaching a higher target rises, and it rises fastest for districts serving the highest concentrations of poverty. So every gap in this post gets bigger, and Philadelphia’s gets bigger the most.
I raise both because Pennsylvania’s policy debate tends to treat “adequate” as a generous aspiration. It’s not. At the national-average standard, it’s the floor. At the Massachusetts standard, it’s what a state that takes its constitutional obligation seriously would actually be aiming for.
Fifteen years in two pictures
The first graphic maps each district in the Philadelphia metro by its percent of adequate funding: actual per-pupil spending divided by the estimated cost of national-average outcomes. Blue is above 100%. Red is below.
Philadelphia metro, % of funding adequacy by district, 2009-2024. Source: School Finance Indicators Database (NECM/SEDA merged file).
The story in the spotlight panel:
District
2009
2013
2021
2024
Philadelphia City
59%
53%
45%
55%
William Penn
77%
58%
49%
55%
Upper Darby
91%
69%
59%
56%
Norristown
105%
97%
72%
82%
Radnor Twp
261%
218%
231%
223%
Lower Merion
333%
292%
251%
226%
Two things jump out. First, Philadelphia never gets close. It starts at 59%, bottoms out in the mid-40s, and ends no better than it began. Second, the red is spreading. In 2009, 5 of 62 metro districts were below adequate. By 2024, 15 were. The inner-ring Delaware County districts (Upper Darby, William Penn) slid from near-adequate to Philadelphia’s level, and Norristown dropped below the line. Even as the metro average fell from 187% to 138% of adequate, the wealthiest suburbs stayed comfortably above 200%.
The second graphic plots all of Pennsylvania’s roughly 500 districts: percent of adequate funding on the horizontal axis, outcomes relative to the national average on the vertical, bubbles sized by enrollment.
Pennsylvania school districts, funding adequacy vs. outcomes, 2009-2024. Source: School Finance Indicators Database (NECM/SEDA merged file).
The relationship is about as clear as these things get. Districts left of the 100% line sit almost uniformly below the national average. Philadelphia, Reading, and Allentown huddle together in the lower-left corner in every year, roughly 0.4 to 0.7 standard deviations below the national mean. Lower Merion sits in the upper right, around 0.8 above. These districts are not underperforming relative to their resources. They are performing about where their resources predict.
One caution on 2024. Philadelphia’s uptick from 45% to 55% likely reflects, at least in part, temporary federal pandemic relief, which has since expired. And these data end before the first post-ruling state adequacy supplement arrived in 2024-25. Which brings us to the court.
The court ruled. Then what?
In February 2023, Commonwealth Court Judge Renée Cohn Jubelirer ruled in William Penn School District v. Pennsylvania Department of Education that the state’s school funding system was unconstitutional. The roughly 800-page opinion found the system failed students in low-wealth districts and left the remedy to the legislature. Note who the lead plaintiff is. William Penn, in Delaware County, sat at 77% of adequate in 2009 and 55% in 2024.
The legislature’s Basic Education Funding Commission came back in January 2024. Its majority report found 387 of the state’s 500 districts below their adequacy targets and called for $5.4 billion in new money phased in over seven years, plus annual increases for cost growth.
Here’s what has happened since:
Budget year
New adequacy and tax-equity supplement
Notes
2024-25
About $526 million
$494 million adequacy plus $32 million tax equity. Philadelphia’s share: $136.6 million, against an adequacy gap of $1.25 billion (Philadelphia Tribune)
2025-26
$565 million
Passed after a 4-plus-month impasse; Philadelphia’s board authorized borrowing up to $1.55 billion to cover missing state payments (WHYY)
That’s about $1.66 billion over three years. Even the commission’s own seven-year path implies about $770 million a year. The state is behind a schedule that was already a compromise, and it has now flat-lined the increment at $565 million, two years running, while costs keep rising. State Sen. Vincent Hughes now says this adequacy money means “70 percent of Pennsylvania schools are funded constitutionally.” That framing tells you which 30% are still waiting. Philadelphia, Reading, Allentown, and William Penn are not hard to guess.
And the adequacy targets themselves are modest. The commission benchmarked “adequate” to the spending of districts already meeting state performance thresholds, a successful-schools-style method that Jesse Levin and I flagged back in 2014 as a weak basis for costing out what high-need districts require. Measured against the national-average bar, never mind Massachusetts, the destination is short of where the cost model says it needs to be.
In between Rendell’s formula and the 2023 ruling, nothing was done that actually fixed the problem. Formulas were renamed and tweaked at the margins, but the distribution of state aid never moved much toward need, and the overall level never caught up to what the state’s own cost study said was required.
So: not no money. But little progress where it counts. Three rounds of supplements after a constitutional ruling, and Philadelphia’s own formula gap remains above $1 billion. Measured against national-average outcomes, the city has spent the entire period somewhere between 45% and 60% of adequate.
What it would take
The Philadelphia Story isn’t complicated. It’s just long. A state that relies heavily on local property wealth, a big city with high need and limited capacity, and a ring of suburbs spending two or three times what they need. Cut aid when times are tight, as in 2011. Pass a formula, then let it die. Lose in court, then fund the remedy at a pace that leaves the neediest districts waiting longest.
Getting Philadelphia to adequate means:
Close the gap on a real schedule. Fund the remaining adequacy gap in full within the commission’s seven years. Don’t flat-fund the increment.
Pick a meaningful target. National-average outcomes should be the floor, not the goal. Cost out what it would take to reach Massachusetts-level outcomes and be honest about the difference.
Run all the money through the formula. Make sure state aid actually follows need, and keep the formula funded through the next downturn.
Keep score. Track spending against cost-model estimates year by year, district by district, the way the graphics above do.
And the next time someone tells you Philadelphia proves money doesn’t matter, ask them a simple question: in which year was Philadelphia ever funded adequately? I’ve got fifteen years of data here. I can’t find one.
Sources
School Finance Indicators Database, NECM/SEDA merged file (data behind both graphics)
Last week I asked who answers to the 18-year-old the voucher failed. The honest answer? Pretty much no one. No one owed her any duty, there was no standard anyone could be said to have missed, and there’s no defendant she could realistically sue.
That post was about two states – Arizona and Florida – and one kind of program. Here I step back and ask how we got here. Put simply, for a hundred years now, the U.S. Supreme Court has asked one question about children’s schooling – how much control do parents get? – and has almost never asked the other – what is the child owed? The answers to that first question have piled up, mostly in one direction. And in the past decade, they’ve been joined by a second line of cases that sends public money right along with them.
None of this is a new worry here. Back in 2020, Preston Green and I laid out the post-Espinoza end game: once states must fund religious schools, the next fight is over whether they can still regulate them – including against discrimination. That same year, in a dust-up with the Hechinger Report over our op-ed, we pointed out that federal law has never squarely barred a religious school from excluding students by race on religious grounds. What’s changed? Those dominoes are now falling, pretty much on schedule. The next one gets argued before the Supreme Court on November 3.
Below, I a) map out that case law, b) look at how other democracies handle the same questions, and c) sketch out what I’m calling Children’s Recourse – a framework that treats children as rights-holders in their own name. A caveat up front: I’m not a lawyer. What follows is a school finance guy’s reading of the doctrine, not legal advice.
Four lines of cases, one direction
The cases sort into four branches, by the constitutional question each one asks:
Branch
Question
Constitutional hook
Answer as of October 2026
A. Exit
May the state compel attendance at public schools?
14th Amendment due process (parental liberty); Free Exercise
No. States may regulate private and home schooling, but not require public schooling.
B. Control inside public schools
Must public schools exempt or inform objecting parents?
Free Exercise; due process
Yes, under strict scrutiny, when a policy burdens a child’s religious upbringing.
C. Establishment limits on aid
May public money reach religious schools?
Establishment Clause
Yes, if routed through parents’ choices. The old test is gone.
D. Free Exercise mandates to fund
Must a state that funds private schooling include religious schools?
Free Exercise
Yes. Whether neutral conditions can still exclude them is pending.
Each branch started from a different question. But since 2017, all four have landed in the same place – more parental control, and more public support for private and religious schooling.
Exit: Meyer, Pierce and Yoder
It all starts in the 1920s. In Meyer v. Nebraska (1923), the Court struck down a wartime ban on teaching German (and other foreign languages) to young children. Two years later, in Pierce v. Society of Sisters (1925), a unanimous Court struck down Oregon’s Compulsory Education Act, which required nearly every child to attend a public school. And here’s the line that’s been quoted ever since: “The child is not the mere creature of the State.”
Let’s be clear – these decisions protected real people from real bigotry. Oregon’s law was backed by the Klan and aimed squarely at Catholic schools. Meyer and Farrington v. Tokushige (1927) protected immigrant communities from nativist laws. But notice what the Court actually protected: the parents’ liberty to direct their children’s upbringing (and, in Pierce, the schools’ property interests). The child shows up only as the object of that liberty.
Equally important is what Pierce left in place. The Court said nothing disputes the state’s power “reasonably to regulate all schools, to inspect, supervise and examine them, their teachers and pupils,” and to require that “certain studies plainly essential to good citizenship must be taught.” That reservation remains good law. Hold onto it – it matters for everything that follows.
Figure 1. Exit rights were set in the 1920s; later cases mostly extended them.
The one major limit came in Prince v. Massachusetts (1944), which upheld the child-labor conviction of an aunt and legal custodian who had her nine-year-old niece selling Jehovah’s Witness literature on the street. As the Court put it, parents may be free to become martyrs themselves, but they are not free “to make martyrs of their children.”
Then came Wisconsin v. Yoder (1972), which allowed Amish parents to end their children’s formal schooling after eighth grade. Justice Douglas, dissenting in part, raised the point the rest of the Court skipped right over – nobody asked the kids. If a child wanted to be a pianist, or an astronaut, or an oceanographer, he wrote, the decision let the parents’ religious views foreclose that. Half a century later, the doctrine still hasn’t answered him.
Oh, and the Court has never actually decided a home-schooling case. Home schooling rests on state statutes plus Pierce. And as I showed last week, those statutes range from reasonable oversight to Arizona’s rule that a signed ESA contract simply is school attendance.
From exit to veto: Mahmoud and Mirabelli
For most of the last century, parents who objected to what public schools taught had one main remedy – leave. Lower courts consistently held that merely exposing a child to ideas the parents reject is not a burden on religion. See, for example, Mozert v. Hawkins County (6th Cir. 1987), on a reading curriculum, and Parker v. Hurley (1st Cir. 2008), on picture books depicting same-sex families. Employment Division v. Smith (1990) reinforced that baseline, holding that neutral, generally applicable laws don’t require religious exemptions – and recasting Yoder as a narrow “hybrid rights” case.
That baseline collapsed in the span of about two years.
Figure 2. Opt-out claims lost for decades, then won twice in 2025–26.
In Mahmoud v. Taylor (2025), the Court held 6–3 that Montgomery County parents were entitled to notice and an opt-out from LGBTQ-inclusive storybooks. Instruction that “substantially interferes” with a child’s religious development now triggers strict scrutiny – even when the policy is neutral and applies to everyone. Then in March 2026, in Mirabelli v. Bonta, the Court (again 6–3, this time on its emergency docket) reinstated, as to the parent plaintiffs, an injunction against California policies that barred schools from telling parents about a student’s gender transition without the student’s consent, grounding that ruling in both Free Exercise and substantive due process. Seven weeks later, it declined to hearFoote v. Ludlow, a similar case parents had lost in the First Circuit.
Whatever one thinks of those outcomes, look at what’s missing. The child’s own interests – in learning about the world, or in a confidential relationship with a school counselor – show up only as something the parent’s rights override. To be fair, Mirabelli does leave one door open: the state may still protect children from unfit parents, through child-abuse law and custody proceedings. That’s now about the only space left for child-protective policy inside schools.
Following the money
And this is where the doctrine becomes a school finance story.
For most of the 20th century, the Establishment Clause limited how public money could reach religious schools. The Court allowed bus fares (Everson, 1947) and secular textbooks (Allen, 1968). But in the 1970s and early 1980s, it struck down salary supplements, tuition reimbursements and most direct aid under Lemon v. Kurtzman (1971) and Committee for Public Education v. Nyquist (1973). Then that wall came down, brick by brick.
Figure 3. The wall against aid peaked between 1971 and 1985, then fell.
Mueller v. Allen (1983) upheld tax deductions for school expenses. Agostini v. Felton (1997) let public Title I teachers work inside parochial schools. Zelman v. Simmons-Harris (2002) upheld Cleveland’s vouchers as a program of “true private choice,” even though nearly all participating seats were in religious schools. Arizona Christian School Tuition Organization v. Winn (2011) held that taxpayers couldn’t even get into court to challenge tax-credit scholarships. And Kennedy v. Bremerton (2022) formally abandoned the Lemon test altogether.
The one line still standing – barely – is religious charter schools. In Oklahoma Statewide Charter School Board v. Drummond (2025), the Court split 4–4, with Justice Barrett recused. That left in place the Oklahoma Supreme Court’s ruling against St. Isidore, a Catholic virtual charter school, but set no precedent whatsoever.
Meanwhile, a second line of cases flipped the old rule on its head. Rather than the Establishment Clause limiting aid, the Free Exercise Clause began requiring it.
Figure 4. Since 2017, funding private schools means funding religious ones too.
As recently as Locke v. Davey (2004), the Court said states had “play in the joints” to decline to fund religious instruction. Then came the following:
Trinity Lutheran v. Comer (2017): a state can’t exclude a church preschool from a playground-resurfacing grant simply because it is religious.
Espinoza v. Montana Department of Revenue (2020): a state no-aid clause can’t bar religious schools from a tax-credit scholarship program. The Court added that a state “need not subsidize private education” at all. (Remember that line.)
Carson v. Makin (2022): Maine’s town-tuitioning program can’t exclude schools that teach religion. The Court rejected any distinction between a school’s religious status and its religious use of funds.
Next up is St. Mary Catholic Parish v. Roy, argued November 3. Colorado’s universal preschool program requires participating providers to enroll children regardless of, among other things, sexual orientation or gender identity. Catholic preschools in the Archdiocese of Denver refused, and were excluded. The question now is whether a neutral condition like that can still keep them out. If the answer is no, states lose much of their ability to attach any accountability strings at all to private school funding.
Put the funding cases and the opt-out cases together and here’s what you get. Public money now follows parental exit, often with few if any conditions. Meanwhile, parental objections increasingly dictate what happens inside the schools that remain public. Heads, parents win. Tails, parents win.
State constitutions: a right that belongs to the child
With the federal Establishment Clause largely out of play, and Espinoza disabling state no-aid clauses that single out religious schools, what’s left are state constitutional education clauses. We tend to call the litigation under those clauses “school finance” cases – I’ve certainly done my share of calling them that – but the label is misleading. Most of these clauses say nothing about money. Rather, they obligate the state to provide an education to a defined population, usually defined by age. New Jersey’s, for example, requires a thorough and efficient system of free public schools “for the instruction of all the children in the State between the ages of five and eighteen years.”1 And courts have mostly defined adequacy in terms of outcomes. Kentucky’s Rose v. Council for Better Education (1989) laid out capacities every child should attain, including sufficient knowledge of economic, social and political systems to make informed choices.2 New York’s high court, in Campaign for Fiscal Equity, asked whether students leave school able to function productively as civic participants and to compete for decent jobs.3 Funding enters as the remedy, not the right. If the state is depriving children of those outcomes, and more money is what it takes to fix that, so be it. Only Kansas’s constitution speaks directly to finance, requiring that the legislature “make suitable provision for finance of the educational interests of the state.”4
Equally important, these decisions tend to treat the right as one held by each child – not by districts, and not by taxpayers. New Jersey’s Abbott decisions speak of the “educational entitlements that the Constitution guarantees” to children in the state’s poorest districts.5 Courts in Kentucky, Wyoming and New Hampshire have gone further, calling education a fundamental right.6 Washington’s Supreme Court has held that the state’s “paramount duty” to educate gives every child in the state a corresponding constitutional right.7 Why does this matter here? Because the recent voucher and ESA rulings below mostly asked a different question – not whether a child is receiving an adequate education, but whether money spent elsewhere harms the public system. Framed that way, challengers have mostly lost.
State
Year
Program
Outcome
Idaho
2026
Parental Choice Tax Credit (refundable, up to $5,000)
Upheld unanimously: the duty to maintain public schools doesn’t bar funding alternatives
Wyoming
2026
Steamboat Legacy ESA ($7,000)
Injunction lifted unanimously; the court called the program separately funded and found no showing it impairs the right to education. Merits pending.
Trial court held the universal program violates the thorough-and-efficient clause (June 2025); appeal argued May 2026
South Carolina
2024
Education Scholarship Trust Fund
Struck, 3–2, in Eidson v. South Carolina Department of Education: direct benefit to private schools
Kentucky
2022
Tax-credit education opportunity accounts
Struck: no tax money for schools other than common schools
Florida
2006
Opportunity Scholarships
Struck in Bush v. Holmes under the uniformity clause
The Wyoming framing is the one to watch. The state’s superintendent greeted the ruling as proof that the program is “not a school finance case,” and the court found no showing that the ESA impairs the right to education. That is a striking result in a state whose own supreme court has called education a fundamental right. If universal ESAs are treated as separately funded and outside the school finance system, then education clauses can say nothing about public money spent on children who leave the public system. That is, unless the right at stake is an individual, fundamental right to an adequate education, held by the child him- or herself. A right like that doesn’t stay behind when the child leaves. It follows the child, and so does the state’s duty to secure the outcomes its courts have defined. That is precisely the gap my 18-year-old falls through, and the most promising way to close it.
What’s missing: the child
It’s not that the Constitution has no place for children’s own rights. Rather, schooling is the outlier – the one area where the parent’s interest is simply presumed to be the child’s. The footholds are already there:
In re Gault (1967): children hold due process rights in their own name.
Tinker (1969) and West Virginia v. Barnette (1943): students hold speech and conscience rights against the state. Notably, Barnette protected a student’s refusal to salute the flag as the student’s right.
Prince (1944): parental and religious authority yields to the state’s interest in a child’s welfare.
Plyler v. Doe (1982): denying a child a basic education imposes a lifetime of hardship – a harm the Court said would follow the child “each and every day of his life.”
Papasan v. Allain (1986): left open whether a minimally adequate education is constitutionally protected – the question Gary B. v. Whitmer answered yes to, before that ruling was vacated.
But no one has yet assembled these pieces into a doctrine of children’s educational rights. That’s the task at hand.
How other democracies do it
It helps to look abroad, because the usual framing – parental freedom versus state monopoly – turns out to be a false choice. Peer democracies protect parents’ freedom to choose religious and private schools. Several fund religious schools far more generously than any U.S. state does. But they also bound that freedom in ways American law no longer does.
Country
Compulsory schooling and home education
Religious and private schools
Child’s own voice
Germany
School attendance required; home education generally prohibited
Constitutionally protected and state-subsidized; approved schools may not sort pupils by parents’ means
Child chooses own religion at 14 and can’t be switched against their will from 12
Netherlands
Compulsory; home education only by narrow exemption
Funded on the same basis as public schools since 1917; about two-thirds of primary schools are privately run
National standards, inspection and citizenship education apply to all
France
Compulsory from age 3; home instruction needs prior authorization since 2022
Contract schools get state-paid teachers in exchange for the national curriculum
General child-protection framework
England
Home education legal; the Children’s Wellbeing and Schools Act 2026 adds registers of children not in school and requires consent to withdraw children under child-protection inquiry
About a third of state schools have a religious character, fully state-funded
Older pupils can opt into sex education even if parents withdraw them
Sweden
Home education only in exceptional circumstances
Voucher-funded independent schools may not charge tuition; teaching must be non-confessional
General child-protection framework
The European bargain, put simply, is generous funding in exchange for public accountability – a national curriculum, inspection, admissions rules and limits on fees. The European Court of Human Rights does protect parents’ religious and philosophical convictions in education. But its test, going back to Kjeldsen v. Denmark (1976), is whether the state indoctrinates – not whether a child is merely exposed to ideas the parents reject. Objective, critical, pluralistic instruction can be made compulsory, and exemptions are owed mainly where teaching is confessional. Mahmoud, by contrast, treats exposure itself as the burden.
Every one of these countries has ratified the UN Convention on the Rights of the Child, which treats parental authority as direction given for the child, “consistent with the evolving capacities of the child,” and gives the child a right to be heard. The United States? The only UN member that hasn’t ratified it.
Of course, the comparison comes with its own cautions. European funding reflects established churches and Dutch “pillarization” – histories that don’t transplant easily into a system with an Establishment Clause. The “parallel society” reasoning used to uphold Germany’s home-schooling ban, and the integration rationale behind Switzerland’s mandatory mixed swimming lessons, have been applied against religious minorities – the Swiss case involved Muslim families. And the very conditions these systems attach, like Germany’s bar on sorting pupils by parents’ means and Sweden’s ban on fees, show they treat sorting by family background as a known risk of publicly funded private schooling, to be managed by rule.
Children’s Recourse
The premise is simple. Children are rights-holders.Parents are fiduciaries – their authority exists for the child’s benefit and shrinks as the child matures. The state is the guarantor of a real education for every child, whatever choices adults make – and especially when the state is footing the bill for those choices.
What states can do now, without overruling anything. Remember that reservation in Pierce – the power to regulate all schools, teachers and pupils? That means a state can:
Register every school-age child, in any setting.
Assess learning – not just attendance, and not just receipts – with remediation and, after repeated failure, a required change of setting.
Keep every child in periodic contact with a mandated reporter – a teacher, nurse or counselor.
Attach neutral accountability conditions to every public dollar: assessment participation, public outcome and financial reporting, admissions and disability nondiscrimination, and audits. After Carson, these must apply to all participants alike. St. Mary will tell us how far that goes.
Give older students a statutory voice in decisions about their own schooling, modeled on Justice Douglas’s Yoder dissent and Article 12 of the CRC.
In state courts. Education-clause challenges like those in Ohio and Utah are one path. The stronger one, I’d argue, builds on the individual right many state courts already recognize. Children themselves, through guardians, can argue that the state’s duty to secure adequate educational outcomes runs to each child – including those whose public dollars the state sends elsewhere.
In federal courts, defensively first. That means defending neutral funding conditions, confining Mahmoud to instructional content, and building on Mirabelli’s child-protection carve-out. Over time, it means affirmative claims for the minimally adequate education Papasan left open.
Over the long run, revisiting the precedents themselves – from the newest and least entrenched back toward the oldest: Carson and Espinoza; then Zelman and the abandonment of Lemon; then Mahmoud and Mirabelli; then Yoder; and eventually the parental-liberty holdings of Meyer and Pierce. Those last two rest partly on the same Lochner-era reasoning about economic liberty that the Court abandoned in 1937. I’m not naïve about the odds. Mahmoud, Mirabelli and Carson were all 6–3, and premature federal cases could entrench the very rules they target. This is a decades-long project. And most of the near-term gains are available without it.
Taking the objections seriously
History.Meyer, Pierce and Farrington protected Catholic, German-speaking and Japanese-American families from laws designed to erase them. Any framework that expands state power over schooling has to be built so it can’t be turned against minority communities again.
Who holds the power. A state that can compel attendance can also dictate content. Barnette’s warning against compelled orthodoxy cuts in every direction – and folks across the political spectrum now invoke it.
The evidence is genuinely mixed. Home-schooling outcome data are thin and self-selected, and how often home schooling conceals abuse is disputed. Voucher studies show large early test-score losses in Louisiana, Indiana and Ohio, alongside some positive attainment findings in Milwaukee, D.C. and Florida. Claims of harm should rest on careful data, not anecdotes – the same standard I’d apply to claims of voucher success.
The middle ground may be enough. Many scholars, including Amy Gutmann, Harry Brighouse and Rob Reich, favor strong regulation for autonomy and civic minimums while preserving parents’ freedom to exit. Most of the near-term agenda above is consistent with that position.
The end game, revisited: why the urgency is greater now
Six years ago, Preston Green and I argued that Espinoza wasn’t the end of anything. Rather, it was the latest domino after Zelman and Mitchell. The next, we suggested, would be what we called a “Bethel Academy” – a religious school that takes public money while claiming the state can’t enforce its nondiscrimination rules against it. And if that domino fell, we wrote, a state unwilling to subsidize discrimination would be left with one option: stop funding private providers, charter schools included, and fund and operate only its own schools. A year later, I argued that charter schooling had reached a critical juncture – that it could become “increasingly private, more overtly religious, openly discriminatory” unless states made charter governance truly public. And in 2025, with Drummond pending, I warned that religious charter operators could refuse any regulation they claim conflicts with their beliefs, including rules against racial discrimination (Green, Baker & Eckes, 2024).8
Race is where critics push back hardest, so let’s be precise. When we raised it in 2020, voucher advocates insisted that Runyon v. McCrary settles the matter. It doesn’t. Runyonexpressly declined to decide whether federal law reaches “private sectarian schools that practice racial exclusion on religious grounds.”9 Preston Green, Suzanne Eckes and I lay out the full case in the Peabody Journal of Education: the Free Exercise decisions since 2017 could let voucher-funded schools exclude Black students on religious grounds, recreating a modern version of the “segregation academy.”10 As we explain there, the real backstops are case law and federal tax policy – Norwood v. Harrison (1973), which barred state textbook aid to segregated private schools,11 and Bob Jones University v. United States (1983). Bob Jones let the IRS deny a tax exemption to a university that banned interracial dating on religious grounds, calling the eradication of racial discrimination in education a compelling interest.12 That holding may well survive. But neither case has been tested against the Court’s post-2017 Free Exercise doctrine, under which a funding condition with secular exceptions can be recast as discrimination against religion. And that’s precisely the question in St. Mary. Nor is the history reassuring. Some of the earliest state tuition-grant programs in this country paid white students’ way into “segregation academies” after Brown – until the Court struck down Prince Edward County’s version in Griffin v. County School Board (1964).13
So why is the urgency greater now? Because the pieces have all arrived at once:
Universal ESAs that measure receipts rather than learning – now upheld in Idaho and cleared to run in Wyoming.
Carson, requiring states to fund religious instruction once they fund any private option.
Mahmoud and Mirabelli, making religious objection a trump card inside the public schools that remain.
St. Mary, argued November 3, deciding whether neutral conditions can still bind the providers who take the money.
Drummond’s 4–4 split, leaving religious charter schools one vote away – with the recused justice free to sit on the next case.
Taken together, these let a non-state actor a) take public money in a child’s name, b) define its mission by its own religious beliefs, and c) claim exemption from the rules that protect that child – rules about whom a school may exclude, what it must teach, and whether anyone checks that the child learned anything at all. The state can’t exclude the provider, and may soon be unable to condition the money. The parent can choose, but owes the child no measurable standard. And the child? The child is the one party in the arrangement with no rights of her own. That’s why Children’s Recourse can’t wait for the long game. The near-term steps above – and the hard choice Preston and I laid out back in 2020 – are on the table now.
Not the mere creature of anyone
Pierce’s most famous sentence has been read for a century as a shield for parents against the state. I no longer think it deserves that reputation. Its defenders point to the bargain it struck – parents may leave, but the state keeps the power “reasonably to regulate all schools.” Well, that bargain has been unwound, one case at a time. Carson says a state that funds exit must fund religious exit. Mahmoud and Mirabelli say religious objection can override what happens inside the schools that remain. And if St. Mary holds that neutral conditions can’t bind the providers who take the money, the regulatory half of Pierce will be a dead letter (or close to it), while the exit half just keeps on growing. At that point, Pierce isn’t a check on the problem. Pierce IS the problem – the foundation every one of these cases builds on. Put bluntly, it may have to be reversed, not merely reinterpreted. No, that’s not a call to revive Oregon’s nativism. It’s a call to replace a rule that treats children as their parents’ to direct with one that protects every child – minority families’ children included – in their own right. A child is not the mere creature of the state. Nor is a child the mere creature of their parents. Or of a scholarship-granting organization processing receipts.
If we’re going to spend public money in a child’s name, someone has to be answerable to that child. Right now, under the doctrine the Court has built, no one is. Children’s Recourse is an attempt to change that.
Full working paper
Baker, B.D. (2026). Not the Mere Creature of Anyone: Parental Control, Public Money, and the Case for Children’s Educational Rights. Working Paper. [PDF]
Rose, 790 S.W.2d 186; Campbell County School District v. State, 907 P.2d 1238 (Wyo. 1995); Claremont School District v. Governor, 703 A.2d 1353 (N.H. 1997) (Claremont II). ↩︎
Seattle School District No. 1 v. State, 585 P.2d 71 (Wash. 1978); McCleary v. State, 269 P.3d 227 (Wash. 2012). ↩︎
Green, P., Baker, B. D., & Eckes, S. (2024). The potential for race discrimination in voucher programs in a post-Carson world. Peabody Journal of Education, 99(4), 403–415. https://doi.org/10.1080/0161956X.2024.2381370↩︎
Back in January 2013, I wrote about three Kansas judges who saw right through the state’s claim that deep funding cuts would cause no harm. The Shawnee County District Court panel in Gannon v. State of Kansas (decision, p. 188) put it this way:
Simply, school opportunities do not repeat themselves and when the opportunity for a formal education passes, then for most, it is most likely gone. We all know that the struggle for an income very often – too often – overcomes the time needed to prepare intellectually for a better one.
If the position advanced here is the State’s full position, it is experimenting with our children which have no recourse from a failure of the experiment.
The Kansas experiment was a legislature cutting school budgets and betting that nobody would be hurt. That was bad enough. But at least in Kansas, the children were still in schools. There were still teachers, curricula, and test results that a court could look at.
A decade later, Arizona and Florida are running a different experiment. They hand public money to parents, place few limits on how it is spent, and ask almost nothing about whether the child learned anything. If that experiment fails for a particular child, who answers for it? Who does the 18-year-old sue?
The new experiment: money out, no questions asked
Arizona’s universal Empowerment Scholarship Account (ESA) program, expanded to all students in 2022, now serves more than 100,000 children and is expected to cost over $1 billion a year. Florida followed in 2023 with universal eligibility and a homeschool ESA, the Personalized Education Program (PEP), worth roughly $8,000 per child.
Consider what the statutes actually require of the parent. Under A.R.S. § 15-2402, the Arizona parent signs an agreement to use “a portion” of the money to provide instruction in reading, grammar, mathematics, social studies and science. That is the whole of the academic obligation. Then comes the remarkable part, subsection I: a signed agreement “constitutes school attendance” for purposes of the state’s compulsory attendance law. The contract is the education, as far as the state is concerned.
There is no testing requirement for ESA students in Arizona, no curriculum approval, no portfolio, and no evaluator. Even homeschool guides that are friendly to the program say so plainly. The state checks receipts, not learning.
Florida asks slightly more. PEP families must submit a student learning plan and have the child take a nationally norm-referenced test each year, with results sent to the scholarship funding organization (FLDOE PEP FAQ; Step Up PEP Family Handbook). But what triggers loss of funding is failing to take and submit the test, not the score. A child can test at a first-grade level in tenth grade and the money keeps flowing.
That is the experiment. The state funds the choice, defines the choice as compliance, and measures nothing that would tell anyone whether the child is learning.
What the money has bought
Reporters in both states have spent three years documenting what this money buys. Some of it was approved under the rules. Some was flagged as improper only after the fact. All of it was spent from accounts that exist, by law, to educate a child.
State
What was bought
Allowed or flagged?
Source
Arizona
Disney parks, Disney stores and Disney+ subscriptions — at least $21,000 across 100+ accounts; trip-related expenses in 44 states and 13 countries
Disney and personal travel are not allowed; spent anyway
Swing sets, foosball and air hockey tables, trampolines, dolls, stuffed animals; parents in private groups planning an $800 LEGO set as a Christmas gift
Allowed items; the gift use was parents’ own description
In fairness to the programs’ defenders, Arizona’s education department maintains that most purchases are valid and that misspending is a small share of the total. Florida’s administrator, Step Up For Students, requires a statement of educational benefit for theme park tickets and caps them at $500 a year (WFTV). When Florida legislators tried to tighten the list in 2024, families lobbied against it and the restrictions failed.
But “small share” is the wrong frame. Arizona auto-approved purchases under $2,000 — over a million requests and $124 million — to clear a backlog, with plans to audit later. Of 18,000 parents flagged for $10.3 million in banned purchases, only six were referred for prosecution. And every audit is an audit of purchases. None asks the only question that matters to the child: was anyone teaching me to read?
The legal question: who does the 18-year-old sue?
Imagine a young woman turning 18 in Phoenix or Orlando. For a decade, her ESA paid for theme park passes, a television, a trampoline and a lot of LEGO. Nobody ever taught her to read beyond a primer. She has no transcript and no diploma. The state that funded all of it called her “in attendance” the entire time. What are her options?
I’m not a lawyer, and what follows is a policy researcher’s tour of the doctrinal terrain, not legal advice. But the terrain is not encouraging.
1. Sue the parent. Arizona abolished parental immunity in Broadbent v. Broadbent (1995), replacing it with a “reasonable and prudent parent” standard. Florida has never gone that far. So in Arizona, at least, a negligence claim against a parent is not barred at the door. But she would then run into the doctrine of educational malpractice. Since Peter W. v. San Francisco Unified School District (1976), courts have refused to recognize a duty of care for academic outcomes. They cite the lack of a workable standard of care, uncertain causation, and the burden on schools. If courts won’t hold trained, licensed educators to a duty to teach a child to read, a court is unlikely to impose one on a parent the legislature expressly freed from any measurable standard.
A narrower theory may be stronger: misappropriation. The Arizona statute says ESA money may be used “only” for the expenses of the qualified student. A diamond necklace or a family Disneyland trip is not that. A custodial-account or constructive-trust theory, treating the parent as having diverted money held for the child’s benefit, at least fits the facts. But that recovers the misspent dollars, not the lost education. And a judgment against a parent with no assets is worth little.
2. Sue the vendor. The private school, the online program, the tutoring center or the “ESA-approved” camp are private actors. A contract or consumer-fraud claim might reach a vendor that took money and delivered nothing. But a vendor that delivered exactly what was purchased (a ski pass, a paddleboard) did nothing wrong. And educational malpractice bars claims that the instruction itself was inadequate.
3. Sue the state, under the federal Constitution. This is where the Kansas panel’s warning bites hardest. San Antonio v. Rodriguez (1973) held there is no fundamental federal right to education. DeShaney v. Winnebago County (1989) held the Due Process Clause generally imposes no duty on the state to protect a child from harm inflicted by a private actor, including a parent. The one federal appellate ruling to recognize a right to a basic minimum education, Gary B. v. Whitmer (6th Cir. 2020), was vacated when the full court took it up after the case settled. She might argue that the state created the danger by funding the deprivation and deeming it lawful attendance. That theory is untested in this setting.
4. Sue the state, under the state constitution. Both states have education clauses. Florida’s is among the strongest in the country, declaring education a “paramount duty” and requiring a “high quality system of free public schools.” In Bush v. Holmes (2006), the Florida Supreme Court struck down a voucher program for diverting public funds to private schools outside that uniform system. But in Citizens for Strong Schools v. State Board of Education (2019), a divided court held that “high quality” offered no judicially manageable standard. More fundamentally, state adequacy litigation produces prospective, system-wide remedies. It is not a damages action for an individual who already aged out.
5. Ask the state to step in. Ordinarily, a child receiving no education might trigger truancy enforcement or an educational neglect inquiry. In Arizona, that door is closed by statute: the signed ESA agreement constitutes school attendance under § 15-2402(I). When the state does catch misspending, its remedy is to suspend the account or send it to collections. Any money recovered goes back to the state, not to the child whose education it was meant to buy.
So the honest answer to the legal question is: almost none. The 18-year-old is, in the Kansas panel’s words, a subject of an experiment with no recourse from its failure. The difference is that in Kansas, the state was cutting the budget of institutions still obligated to teach her. In Arizona and Florida, the state has written itself out of that obligation and handed the obligation, and the money, to someone the law does not hold to any measurable standard.
Tallying the damages
If she could get into court, what would she claim? The Kansas panel named the core harm: the opportunity does not repeat itself, and for most people, once it passes, it is gone. The U.S. Supreme Court said much the same in Plyler v. Doe (1982): the inability to read and write “will handicap the individual deprived of a basic education each and every day of his life.”
Start with what can be counted. Using 2025 Bureau of Labor Statistics data on earnings by educational attainment (full-time workers, age 25+):
Highest attainment
Median weekly earnings
Annual (×52)
Annual gap vs. no diploma
Gap over a 40-year career (undiscounted)
Unemployment rate
Less than high school diploma
$770
$40,040
—
—
6.1%
High school diploma
$966
$50,232
$10,192
~$408,000
4.3%
Some college, no degree
$1,062
$55,224
$15,184
~$607,000
3.8%
Bachelor’s degree
$1,578
$82,056
$42,016
~$1.68 million
2.8%
These figures understate her loss. The “less than high school” group includes people with ten or eleven years of real schooling who can read, write and do arithmetic. She has none of that. And the earnings figures cover only those working full time. Her higher odds of unemployment, part-time work and no work at all are not in the table.
Then add what is harder to price:
No credential. Without a recognized diploma or transcript, she must first earn an equivalency credential before she can enroll in most colleges or apprenticeships. That means years of remedial work as an adult, while also trying to earn a living, exactly the trap the Kansas panel described.
Foreclosed paths. Military enlistment, many licensed trades, and most postsecondary programs screen on a diploma or basic skills she does not have.
Lost literacy and numeracy. Learning to read as an adult is possible but far harder, and adult literacy services are thinly funded.
Civic and personal costs. Reading a lease, a ballot, a prescription label or a court notice.
The money itself. At roughly $7,000–$10,000 a year in Arizona and about $8,000 in Florida, a K–12 career in the program represents on the order of $100,000 in public funds spent in her name. Whatever went to theme parks and televisions was money the state set aside for her education and allowed someone else to spend.
And under the current statutes, the state has no obligation to notice any of this until she shows up, at 18 or 25, needing an adult education program that the same legislatures have every incentive to underfund.
Closing: whose choice?
Voucher advocates frame all of this as parental choice, and most parents in these programs surely are trying to educate their kids. But a choice program that funds a parent’s decision, defines that decision as legal attendance, and never checks whether the child learned anything has made a choice of its own. It has chosen not to know.
The Kansas judges understood that the burden of a failed policy experiment falls on the children, who did not consent to it and cannot undo it. Arizona and Florida have built that lesson into statute in reverse. If the experiment fails a particular child, the law offers her almost nothing: no duty anyone owed, no standard anyone missed, no defendant she can realistically sue.
At a minimum, a state that funds a child’s education should be able to tell that child, at 18, what it bought. Right now, Arizona can tell her how much it spent at Disneyland.
Policy brief
The full policy brief, No Recourse: Universal Education Savings Accounts, Public Money, and the Students They Leave Uneducated, includes a side-by-side comparison of the Arizona and Florida program requirements and six recommendations for legislators.