My critiques of Marguerite Roza, the Edunomics Lab, and Education Resource Strategies — with receipts. Every quotation is verbatim from the linked post or article.
| 24 blog entries, Aug 2009 – Aug 2026 (and counting) | 21 taking on Roza, from CRPE to Gates to Georgetown | 4 taking on ERS or Karen Hawley Miles | 3 on Edunomics graphs, so far |
The short version
I’ve spent an embarrassing share of my career, seventeen years and counting, cleaning up after Marguerite Roza. It has come in two waves. The first ran from 2009 to 2014, when she was at the Center on Reinventing Public Education (CRPE) and then advising the Gates Foundation, and her work was all over the federal policy conversation. The second started in 2025, when the Edunomics Lab she now runs at Georgetown began handing state policymakers graphs so bad I made a video about them. Education Resource Strategies (ERS) comes up less often, but it keeps turning up in the same places. Its founder, Karen Hawley Miles, co-wrote the Houston/Cincinnati weighted student funding (WSF) “success story” with Roza. Stephen Frank presented ERS slides alongside Roza’s fabricated graph at the 2011 Regents symposium. And ERS graded Baltimore’s Fair Student Funding against Baltimore’s own formula.
It comes down to the same four problems, over and over:
- Blame the districts. The claim goes like this: states have fixed between-district inequity, so the problem left is within districts, and weighted student funding fixes that. The evidence for that sweeping national claim turns out to be “one or a handful of deeply flawed analyses,” mostly Roza’s Texas Weighted Student Index study. That study checks schools against the district’s own spending priorities, not against what kids actually need.
- Productivity without the arithmetic. Stretching the School Dollar, Curing Baumol’s Disease, and the USDOE productivity page that showcased them offer spending cuts relabeled as “cost savings,” without a single cost-effectiveness analysis. Hank Levin laid out how to do one back in 1983. It isn’t a secret.
- Evidence that was simply made up. Roza’s 2011 “productivity curve” had no data, no definitions and no connection to anything real. Researchers in the room said the claims were “simply made up.” ERS’s contribution at the same event: all teacher pay above the starting salary is waste.
- Money-doesn’t-matter graphics. Edunomics’ long-term trend graphs start the clock in 2013, the one year that all but guarantees spending up and scores down, then skip the cost adjustment and stretch the axes. Their scatterplots throw every school onto one chart with no cost adjustment and call the resulting cloud a finding.
Yes, my tone has changed. In 2011 I called this work “methodologically flimsy” and “hack research.” By 2025 I was calling it “intentionally deceitful,” and I stand by that. Once you’ve been told, repeatedly and in public, exactly why a graph misleads, and you keep putting it in front of legislators anyway, “sloppy” stops being the right word. As I put it on Bluesky: “for anyone still using this kind of garbage, you’ve been on notice for years.”
The peer-reviewed version is politer, but it says the same thing. I’ve never said within-district inequity isn’t real. It is. What I have said, with data (EPAA, 2009), is that the WSF showcase districts were no more responsive to student need than districts without WSF. WSF was sold on advocacy research that “identifies the politically motivated solution then seeks to prove that it works.” And you can’t fix a district its state has starved by rearranging what’s left inside it. My 2013 NEPC review gave ERS’s Baltimore analysis the same treatment: grading a formula against itself isn’t an equity analysis. It’s a tautology.
The timeline, at a glance
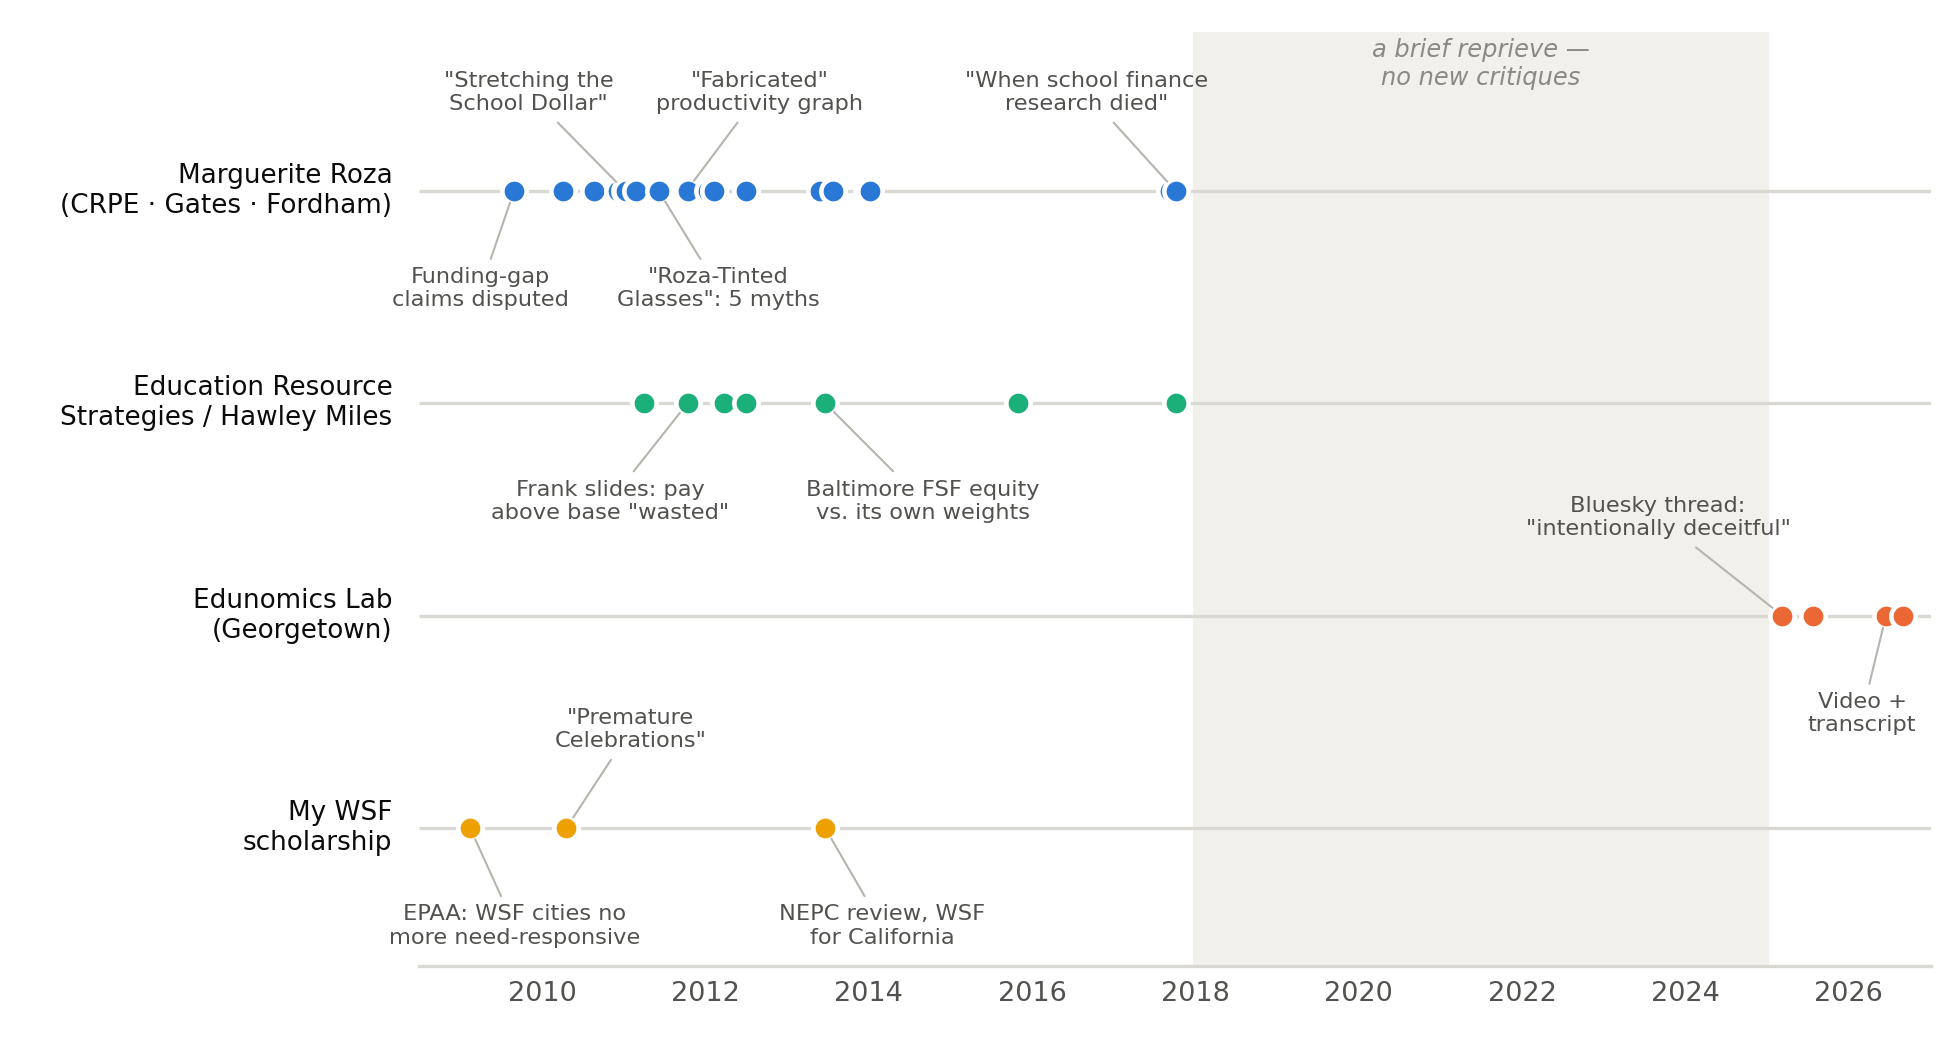
The receipts, post by post
Who’s in the crosshairs: 🟦 Roza · 🟩 ERS / Hawley Miles · 🟧 Edunomics Lab. Titles link to the original posts, so you can check my work (unlike some people’s).
2009–2010: The “it’s the districts’ fault” era
Aug 29, 2009 — Ed Trust, DFER and Center for American Progress misguided
🟦 Roza
My opening shot. Ed Trust, CAP and DFER were busy announcing that states had basically fixed between-district inequity and that the real villains were districts shuffling money between their own schools. Follow the footnotes and they all end up at Marguerite Roza and CRPE.
What I said:
“Okay, so this is just Baker, a school finance techie geek bitching and moaning about trivial statistical problems with research largely conducted by Marguerite Roza and colleagues at the Center for Reinventing Public Education and the reliance of CAP, DFER and Ed Trust on that work. Perhaps – BUT – we are talking about billions of dollars here.”
“State school finance systems – not Title I and not district allocation policies – are the primary underlying cause of resource disparity across children in public schools”
Apr 5, 2010 — Ed Trust Getting Loopy Again
🟦 Roza
Ed Trust again, this time leaning on Roza’s New York City “shock” comparisons. This is where I first take apart the Roza & Hill line that sets a $4,000 average gap next to a $10,000 within-city extreme. That apples-to-oranges comparison became my go-to example of how not to compare numbers.
What I said:
“The use of New York City anecdotes to illustrate supposed major national policy concerns, in this case by authors Daria Hall and Natasha Ushomirsky piggy-backs on similar “shock” comparisons used in op-eds by Marguerite Roza – an author cited by the Hall/Ushomirsky brief.”
“Note the rather misleading apples-and-oranges issue. They are comparing the average in one case to the extremes in another.”
Also quoted in the post:
“So, the real problem is not that New York City spends some $4,000 less per pupil than Westchester County, but that some schools in New York [City] spend $10,000 more per pupil than others in the same city.”
Roza & Hill (2005), op-ed after the New York high court ruling
Aug 20, 2010 — New from the Center on Inventing Research Findings
🟦 Roza
CRPE “discovered” that Washington underpays its math and science teachers. What it actually discovered is that younger teachers earn less than older teachers. Stop the presses. So I ran the statewide teacher-level data they didn’t bother with. (The post names CRPE; in June 2011 I identified the study as Simpkins, Roza & Sepe.)
What I said:
“This is an absurd false dichotomy.”
“Unlike the CRPE report, which cherry picks 30 districts, I use the whole state.”
“These data don’t coincide at all with the CRPE “findings.”
Dec 8, 2010 — The problem? Cheerleading and Ceramics, of course!
🟦 Roza
Enter the cheerleading-and-ceramics gambit: poor urban districts supposedly have plenty of money and just blow it on pom-poms and pottery. Never mind that small electives look expensive per pupil because, well, the classes are small. This previews my AERA 2011 paper, where the data told a very different story.
What I said:
“This logic/argument comes from the “research” of Marguerite Roza, who, well, has a track record of making such absurd arguments in an effort to place blame on poor urban districts and take attention away from disparities between poor urban districts and their more affluent suburban neighbors.”
“These shocking anecdotes, however, are unhelpful for truly understanding resource allocation differences and reallocation options.”
Also quoted in the post:
“Imagine a high school that spends $328 per student for math courses and $1,348 per cheerleader for cheerleading activities. Or a school where the average per-student cost of offering ceramics was $1,608; cosmetology, $1,997; and such core subjects as science, $739.”
Urban Institute event description, based on Roza’s work (quoted again Feb 25, 2011)
2011–2014: Stretching dollars, curing diseases, and a graph based on nothing
Jan 7, 2011 — Stretching Truth, Not Dollars?
🟦 Roza
Petrilli and Roza’s 15-point Stretching the School Dollar brief: school finance reform in a can, heavy on ideology and allergic to cost-benefit analysis. That includes the weighted student funding recommendation, which saves nothing and has no demonstrated equity payoff. The footnotes alone could have been their own post.
What I said:
“The new policy brief reads like School Finance Reform in a Can.”
“In fact, I can’t imagine a circumstance where adopting weighted student funding can be expected to either save money or improve outcomes for the same money. There’s simply no proof to this effect.”
“Petrilli and Roza seem to be belligerently and ignorantly declaring that there is simply never a legitimate reason for a funding formula to include small school district or declining enrollment provisions.”
“Read the footnotes. They are downright embarrassing, and in some cases infuriating. At the very least, they border on THINK TANKY MALPRACTICE.”
Also quoted in the post:
“Typical U.S. teacher contracts are for 36.5 weeks per year and include 2.5 weeks sick and personal days for a total work year of 34 weeks, or 18 weeks time off.”
Petrilli & Roza, Stretching the School Dollar, footnote 2
Jan 12, 2011 — Thinking through cost-benefit analysis and layoff policies
🟦 Roza
Part 2. I did the cost-benefit framing Petrilli and Roza couldn’t be bothered with, applied to their flagship idea of quality-based layoffs. Firing the “bad” teachers and cutting everyone else’s pay comes with costs they left off the ledger.
What I said:
“The tradeoff being made in this case is a tradeoff NOT between “keeping quality teachers” versus “keeping old, dead wood” as Petrilli, Roza and others would argue, but rather the tradeoff between laying off teachers on the unfortunately crude basis of seniority only, versus laying off teachers on a marginally-better-than-random, roll-of-the-dice basis.”
“Petrilli and Roza make the assumption that there is big savings to be found from cutting teacher salaries directly and also indirectly by passing along benefits costs to teachers. That’s a salary cut!”
Feb 25, 2011 — School Funding Equity Smokescreens: A note to the Equity Commission
🟦 Roza
A note to the federal Equity and Excellence Commission: please don’t fall for the cheerleading-and-ceramics smokescreen, which the Urban Institute was advertising on the strength of Roza’s anecdotes.
What I said:
“Surely no-one is advancing an argument – SMOKESCREEN – that utterly absurd.”
Apr 1, 2011 — Public Impact’s Persistent Pattern of Shoddy Analysis
🟩 ERS / Hawley Miles
ConnCAN’s Spend Smart brief, courtesy of Public Impact, came with a long list of signatories, ERS founder Karen Hawley Miles and CRPE’s Paul Hill among them. Plenty of names, and no sign any of them checked the basic data. (I also reviewed Spend Smart for NEPC.)
What I said:
“Yet they are willing – all who signed on to this brief, including Hassel, Hawley-Miles and Paul Hill – to go out on a limb and make these proclamations – proclamations and policy proposals which are simply bad, wrong, misguided – and irresponsible.”
Jun 6, 2011 — School Finance through Roza-Tinted Glasses: 5 School Funding Myths from a single Misguided Source
🟦 Roza
The big one. USDOE rolled out an “educational productivity” resource page stocked with non-peer-reviewed Roza material and billed it as “the work of leading thinkers in the field.” I’d had enough. Five myths, one source: (1) states have fixed between-district inequity; (2) public schools have “Baumol’s disease”; (3) poor districts squander money on cheerleading and ceramics; (4) Washington underpays STEM teachers; (5) a basket of reformy tricks will cut spending and raise productivity.
What I said:
“This post is specifically about the body of methodologically flimsy research produced in recent years by Marguerite Roza, previously of the Center on Reinventing Public Education and currently an advisor to the Gates Foundation.”
“Why this post now? I’ve simply lost my patience.”
“Amazingly, this site lists primarily non-peer reviewed, shoddy work by Marguerite Roza and colleagues and bypasses entirely more serious research on educational productivity or methods for evaluating it.”
“And it’s just lazy, hack thinking.”
“That is, the conclusions of the study itself and the press release are, well, not consistent. But this pattern of behavior is entirely consistent for Roza and CRPE.”
Also quoted in the post:
“While these indicators clearly point to increased costs for education, efforts to quantify productivity changes have been hampered by measurement challenges on the outputs side of the equation. By most accounts, key indicators of outcomes have not shown comparable gains.”
Hill & Roza, Curing Baumol’s Disease (p. 3)
“The subject-neutral salary schedule works to ignore these differences.”
CRPE press release (Simpkins, Roza & Sepe STEM study)
“That said, the lower teacher experience levels are indicative of greater turnover among the math and science teaching ranks, lending support to the hypothesis that math and science teachers may have access to more compelling non-teaching opportunities than do their peers.”
The CRPE study itself (p. 5), which I contrast with the press release
Oct 9, 2011 — Dumbest completely fabricated (but still serious?) graph ever! (so far)
🟦 Roza
At the NY Regents symposium (September 13, 2011), Roza unveiled a “productivity curve”: three straight lines promising that “tech-based learning systems” and “teacher effectiveness” would multiply the return on every dollar. The data behind it: none. The definitions: none. Diminishing returns: apparently repealed.
What I said:
“And this one rises above all of these previous graphs because IT IS ENTIRELY FABRICATED. IT IS BASED ON NOTHING.”
“Indeed this graph is intended to be illustrative… not real…. but the really big problem is that it is NOT EVEN ILLUSTRATIVE OF ANYTHING REMOTELY REAL.”
“Put into context, this graph isn’t funny at all. It’s offensive. And it’s damned irresponsible! It’s reprehensible!”
Oct 14, 2011 — On the Real Dangers of Marguerite Roza’s Fake Graph
🟦 Roza · 🟩 ERS / Hawley Miles
Then Commissioner John King started showing the graph to superintendents, so I explained why it’s dangerous and not just dumb: the effects it implies would dwarf any credible reform study ever published. At the same symposium, ERS’s Stephen Frank argued that teacher pay for experience, degrees and benefits was essentially waste to be reallocated. His example district had a senior workforce, naturally.
What I said:
“A full standard deviation of improvement would be like moving a class of kids from the 50%ile to the 84.1%ile.”
“I have no problem with the idea of exploring outside the box for options that might shift the productivity curve. I have a big problem with assuming… no… declaring outright that we know full well what those options are and that they will necessarily shift the curve in a HUGE way.”
“This assumption is also simply not supportable – certainly not by any of the ill-conceived fodder presented at the Regents Symposium by Marguerite Roza or Stephen Frank of Educational Resource Strategies.”
“But this is all based on absurdly bold assumptions and slipshod analysis (intentionally deceptive since it’s based on a district with a senior workforce).”
“we are most often talking about experimenting with the lives and educational futures of the most vulnerable children and families.”
Jan 11, 2012 — Differentiating “cost savings” from “expenditure reduction”
🟦 Roza
Stretching the School Dollar again, as Exhibit A for relabeling plain old spending cuts as “cost savings.”
What I said:
“Similarly, the “stretching the dollar” brief released last year by the Fordham Institute provides little or no valuable information regarding “cost savings” but does provide a laundry list of ideas for cutting services (with no evidence or measure of the results of such cuts)”
Feb 7 & 9, 2012 — Productivity Agenda Yes! But based on real research & rigorous analysis! / Productivity continued…updated…
🟦 Roza
Hill and Roza answered the NEPC productivity report Kevin Welner and I wrote by calling us curmudgeons with no ideas of our own. Curmudgeons, fine. But a bad idea is still a bad idea when nobody offers a better one, and we did offer better ones. Mark Dynarski then proposed research standards that their work doesn’t come close to meeting.
What I said:
“My first response would be that bad ideas are bad ideas, even in the absence of alternatives.”
“In sum, the report begins with two highly contestable claims. It then draws an unsupported causal connection between the two claims.”
“we should not be using a budget crisis to justify unwarranted haste and recklessness.”
“The third “study” is not a study at all, but rather an opinion brief by Roza with relatively meaningless national ball park estimates of job loss under alternative dismissal scenarios.”
Also quoted in the post:
“Applying these standards might result in excluding a lot of current research (even peer-reviewed research), but I think that would be the point Welner and Baker are making.”
Mark Dynarski, responding to Baker & Welner (Feb 9 post)
Mar 26, 2012 — SB24 won’t solve CT’s real Teacher Equity Problems
🟩 ERS / Hawley Miles
A footnote, recycled in June 2012 and again in October 2015, because the ERS argument that most teacher pay is “non-productive” kept turning up in policy debates and needed a citation every time.
What I said:
“Some go so far as to argue that half or more of teacher pay is allocated to “non-productive” teacher attributes, and so it follows that that entire amount of funding could be reallocated toward making schools more productive.”
Jun 29, 2012 — Friday Finance 101: What Can we Learn about Education Costs & Efficiency by Studying Existing Public Schools?
🟦 Roza
Back to Curing Baumol’s Disease: the claim that 100,000 public schools have nothing to teach us, so the answers must come from home schooling, franchise tutoring and swimming lessons.
What I said:
“Specifically, Marguerite Roza and Paul Hill in one working paper titled Curing Baumol’s Disease argue that the entire public schooling system suffers from a disease of inefficiency and thus any lessons for improving educational productivity must be sought outside of the current system.”
May 30, 2013 — Follow-up: Title I Funding DOES NOT Make Rich States Richer!
🟦 Roza
Carey & Roza’s School Funding’s Tragic Flaw was among the pieces pushing the idea that Title I makes rich states richer. My colleagues and I ran it with better poverty measures in Education Finance and Policy. It doesn’t.
What I said:
“So, no matter what we do, Title I will not solve our biggest funding equity issues. That remains largely a state problem.”
Jul 23, 2013 — School Finance 101: Reformy Distractions, Diversions & Smokescreens from What’s Really Needed
🟦 Roza
“The Intradistrict Distraction”: the Premature Celebrations argument in short form, including how neatly the within-district story fed Roza’s weighted student funding pitch.
What I said:
“This argument is also often attached to the remedy of weighted student funding (see Roza, 2006, pointing readers to the Fordham Institute’s “Fund the Child” campaign).”
“Notably, no leading researchers in economics and school finance have joined this overwhelming shift in emphasis away from state-level concerns.”
Dec 26, 2013 — Ignorati Honor Roll 2013: Pundit Version
🟦 Roza
My Ignorati Honor Roll entry for Mike Petrilli let me revisit the Petrilli–Roza brief one more time. Fordham replied with the depth and rigor we’ve all come to expect.
What I said:
“Among the most egregious examples was his policy brief a few years back with Marguerite Roza on Stretching the School Dollar which included many examples of policies and spending practices he’d like to see changed in schools, many of which actually had little or nothing to do with stretching dollars at all.”
“(no, I can’t believe I wasted so much time rebutting utterly foolish schlock!)”
Also quoted in the post:
“Baker’s a quack”
Fordham Institute (@educationgadfly) on Twitter, Dec 28, 2013
Jan 6, 2014 — Thoughts on Elite Private Independent Schools and Public Education Reforms
🟦 Roza
A heads-up for anyone going to the NAIS research meeting: bring some skepticism about Roza’s technology-efficiency claims. NAIS’s John Chubb wrote back to say I had it all wrong.
What I said:
“Heads up to anyone attending this event, please see this completely absurd claim by Marguerite Roza regarding the supposed efficiency gains achieved by implementing “technology” solutions.”
Also quoted in the post:
“I think you will find that the meeting has a very different aim than you suggest.”
John Chubb, NAIS, reply appended to the post
2015–2017: Footnotes and look-backs
Sep 10, 2017 — Reality Check: Edupreneurs, “Tech-based Solutions” & Misguided Innovation
🟦 Roza
Book-draft material. Six years on, the 2011 productivity graph still earned its spot in the hall of shame.
What I said:
“Roza used her graph to assert that, for example, for $20,000 per pupil, tech-based learning systems could provide nearly 4x the bang for the buck as the status quo, and double the bang for the buck as merely investing in improved teacher effectiveness.”
“(actually, totally made up! Fictional!)”
Oct 4, 2017 — When school finance research died & why it matters #MSFRGA
🟦 Roza · 🟩 ERS / Hawley Miles
Remembering when the Regents symposium featured real research. In 2011 it got Roza’s graph instead, plus an ERS salary graph. (The critique I received names the presenter as “Dr. Fisher”; my 2011 post credits the ERS slides to Stephen Frank.) I wasn’t the only one who noticed. Researchers in the audience sent me their own critiques, and they didn’t mince words either.
What I said:
“More disconcerting, these efforts were replaced by far less rigorous, often purely speculative policy papers, free of any substantive empirical analysis and devoid of any conceptual frameworks.”
Also quoted in the post:
“How can the productivity gain produced by service models used in a very small number sites for a very short time be determined? They can’t. It is not an overstatement to say that the claims about productivity improvement were simply made up.”
Researchers who attended the 2011 Regents symposium, on Roza’s graph
“Particularly, the suggestion that any spending on teacher salaries above the starting salary is unproductive is, well, wrong.”
Same researchers, on the ERS salary graph
2025–2026: Edunomics, or: same tricks, new logo
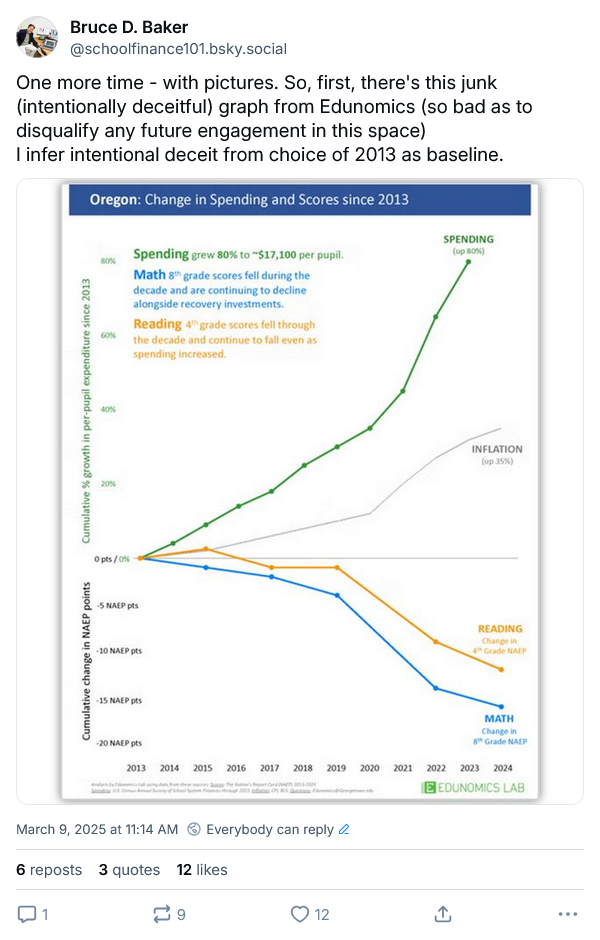
Mar 9, 2025 — My Bluesky thread (@schoolfinance101.bsky.social), reproduced in the Jul 24, 2025 post
🟧 Edunomics Lab
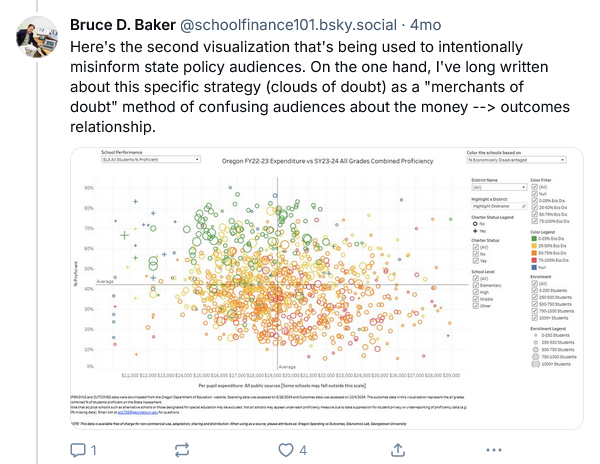
Edunomics Lab’s Oregon “Change in Spending and Scores since 2013” graph, plus its school-level spending-versus-proficiency scatter. I answered with Kirabo Jackson’s EducationNext analysis, NAEP and labor-cost-adjusted spending for every state, and the AIR Oregon cost study. (Quotes transcribed from the screenshots in my July 2025 post.)
What I said:
“there’s this junk (intentionally deceitful) graph from Edunomics (so bad as to disqualify any future engagement in this space) I infer intentional deceit from choice of 2013 as baseline.”
“Here’s the second visualization that’s being used to intentionally misinform state policy audiences.”
“So, for anyone still using this kind of garbage, you’ve been on notice for years.”
“I encourage anyone who is confronted with the Edunomics figures above, especially in public forum, to call them out for what they – and do so bluntly – as that will be the only way to be heard.”
Also quoted in the post:
“Spending grew 80% to ~$17,100 per pupil.”
Edunomics Lab graph annotation (Oregon)
“Math 8th grade scores fell during the decade and are continuing to decline alongside recovery investments.”
Edunomics Lab graph annotation (Oregon)
Jul 24, 2025 — Revisiting Deceitful Claims about School Funding and Outcomes (a thread)
🟧 Edunomics Lab · 🟦 Roza
The Edunomics graphs are just new editions of two very old tricks: the “long term trend” and the “clouds of doubt.” I linked straight back to my 2011 Roza posts, because this is not a first offense. We lost real time in Oregon walking policymakers back from this stuff.
What I said:
“So they are bogus and INTENTIONALLY deceitful. Period. Full Stop. (and not this author’s first offense by any means)”
“because we had to spend a stupid amount of time explaining why the Edunomics analysis was garbage to policymakers in that state”
Jun 16 & Aug 29, 2026 — Make it stop! Please! (video) / Transcript of Video Critiquing Edunomics Graphs
🟧 Edunomics Lab · 🟦 Roza
Twenty minutes of me venting on video (June 16), then the transcript (August 29). Graph 1: start the clock in 2013, when spending had bottomed out and NAEP had peaked; adjust for nothing, stretch the axis, and presto, money doesn’t matter. Graph 2: dump every school in the state onto one scatterplot with no cost adjustment, then act surprised when there’s no pattern. Then I show what the same data look like when you do it right. (The transcript comes from auto-captions, lightly edited.)
What I said:
“The Edunomics Lab at Georgetown University — I’ll call them out by name — and Marguerite Roza have put out data visualization tools that let you make this graph for every state”
“At this point, anyone who’s putting these kinds of graphs out there is doing so knowingly and intentionally to deceive policymakers, courts, judges — whatever.”
“So if you pick 2013 as your starting point, what you’re actually picking is the year when the cuts to funding had hit bottom and test scores had hit their peak.”
“This other stuff — the raw scatterplot — is garbage. Just say it bluntly: it’s garbage. It’s intentionally deceitful.”
“Putting that unadjusted version in front of policymakers or any audience — or, for that matter, using it to teach and train people in a school finance certificate program — is reckless, irresponsible, and needs to stop.”
The peer-reviewed version (and NEPC reviews)
Same critiques, now with regression tables and page numbers. These are my weighted student funding and within-district allocation pieces that were available in full text, searched for every mention of Roza, Hawley Miles, and ERS. They run in date order, except that the 2009 Reason review, which lets Roza off the hook, comes last.
Feb 13, 2009 — Baker, B.D. (2009). Within-district resource allocation and the marginal costs of providing equal educational opportunity: Evidence from Texas and Ohio. Education Policy Analysis Archives, 17(3). (Listed on the CV as “Evaluating Marginal Costs with School Level Data: Implications for the Design of Weighted Student Allocation Formulas.”)
🟨 My WSF work · 🟦 Roza · 🟩 ERS / Hawley Miles
I tested the WSF showcase districts, Houston and Cincinnati, against the other big cities in Texas and Ohio. Credit where it’s due: both did fine on cost-adjusted equity. But neither was any more responsive to student need than districts that never adopted WSF, which rather deflates the “success story.” The literature review takes apart the Weighted Student Index method behind Roza & Hawley-Miles (2004) and Roza et al. (2007).
What I wrote:
“Unfortunately, much of this recent highly politicized and methodologically problematic research seems to have drawn attention away from more rigorous and more conventional studies of within-district resource inequity and potential causes of that inequity. Further, this more recent advocacy research has made the bold leap toward the conclusion that weighted student funding is a logical if not the sole solution.”
“A district could receive a perfect equity index score under this method by allocating $0 per poverty child across all schools and $1,000 per gifted child across all schools, ultimately driving thousands more per pupil in low-poverty schools serving larger gifted populations.”
“The authors attribute these changes to a shift from staffing-based budgets to weighted pupil funding, neglecting the possibility that similar changes could be possible through other budgeting approaches.”
“I find first that widely reported WSF success stories provide no more predictable funding with respect to student needs than other large urban districts in the same state.”
“I remain unconvinced that the data make a strong case one way or the other for weighted student funding as a district budgeting method to achieve greater rationality in cross-school expenditures.”
“rather than taking the approach of more recent advocacy research which identifies the politically motivated solution then seeks to prove that it works.”
Also quoted in the article:
“virtually eliminating inequity in its schools budgets, in part by eliminating the higher funding levels for the high cost school designs and other magnet programs”
Roza & Hawley-Miles (2004), on Cincinnati (p. 22)
“We then calculate a ratio, called a Weighted Student Index (WSI), of the actual funding received by each school to the funding we would expect if schools received the district’s average allocation for its particular mix of students”
Roza, Guin, Gross & Deburgomaster (2007), Education Next (p. 78)
Apr 20, 2010 — Baker, B.D., & Welner, K.G. (2010). Premature celebrations: The persistence of inter-district funding disparities. Education Policy Analysis Archives, 18(9).
🟨 My WSF work · 🟦 Roza
Kevin Welner and I trace the “states are done, districts are the problem” claim, and its WSF remedy, back to a handful of Roza analyses, then take the Texas WSI study apart piece by piece. Roza’s name appears 39 times, rarely in a flattering light.
What I wrote:
“we offer a critique of the empirical basis for the claims that within-district gaps are the dominant form of persistent disparities in school finance, finding instead that claims to this effect are largely based on one or a handful of deeply flawed analyses.”
“A significant shortcoming of the WSI approach, however, is that it fails to measure differences in resources with respect to student population variation across schools.”
“In reality, what an analysis like Roza’s effectively shows is only that the state school finance formula does what the state school finance formula does.”
“produces findings that are difficult to interpret at best, and entirely meaningless at worst. Yet this Education Next study has arguably become the most frequently cited basis for the broader assertion that within-district inequity should supplant between-district inequity as the funding policy concern du jour.”
“First, Hill, Roza and Harvey cite only a piece coauthored by Roza which considers only Texas data, not national data or data on any state other than Texas.”
“But policymakers should be skeptical of claims that the resource needs of high-poverty schools can generally be met merely via a reshuffling of district-level resources.”
Also quoted in the article:
“At least in Texas, funding decisions within districts currently have a greater impact on a school’s resources than inequalities in access to resources across school districts”
Roza, Guin, Gross & Deburgomaster (2007), p. 70
“What is true in California happens to some degree in every other state and every large district”
Hill, Roza & Harvey, CRPE school finance reform report
“Several studies give cause for concern by demonstrating that spending differences among schools within districts at times exceed spending differences across districts”
Roza, Guin & Davis (2007), the “more measured wording” Baker & Welner contrast
“So, the real problem is not that New York City spends some $4,000 less per pupil than Westchester County, but that some schools in New York [City] spend $10,000 more per pupil than others in the same city.”
Roza & Hill (2005)
Jun 2013 — Baker, B.D. (2013). Review of “Weighted Student Funding for California” (Reason Foundation). Boulder, CO: National Education Policy Center.
🟨 My WSF work · 🟦 Roza · 🟩 ERS / Hawley Miles
Reason Foundation’s California WSF pitch leaned on Hawley Miles & Roza and on an ERS study of Baltimore’s Fair Student Funding. The ERS method is a marvel of circularity: to test whether the formula is fair, measure the schools against… the formula.
What I wrote:
“In particular, these studies provide a more compelling argument than do citations to the work of Roza and Hawley Miles.”
“But the Hawley Miles and Roza study suffers serious methodological flaws”
“The new report also cites comparably flawed work by Frank and colleagues from an organization called Educational Resource Strategies (ERS).”
“That is, the study merely asks to what extent does spending deviate from the adopted formula. It does not question whether the adopted formula itself introduces inequities.”
“Notably, the report overlooks many such key peer-reviewed studies that give reason to be substantially more skeptical of the successes of weighted student funding and the potential of this approach to address within-district inequities.”
Also quoted in the article:
“a study of Houston and Cincinnati’s weighted student funding significantly improved equity between schools within the district”
Reason report’s characterization of Hawley Miles & Roza (2006), p. 7
“ERS measures school-to-school equity by comparing per-pupil funding after adjusting for student needs (in Baltimore, by using the student weights from the district’s formula) and then calculating the percent of schools that are within 10% of the median dollar per pupil”
Frank (2012), ERS, Fair Student Funding in Baltimore (p. 8)
May 13, 2009 — Baker, B.D. (2009). Review of “Weighted Student Formula Yearbook 2009” (Reason Foundation). Boulder and Tempe: EPIC/EPRU Think Tank Review Project.
🟨 My WSF work · 🟦 Roza
Roza shows up here only in one neutral footnote. I don’t critique her in this one; it’s here because it’s one of my WSF reviews. The Reason report itself is another story.
What I wrote:
“Overall, the policy guidance provided by the Reason report is reckless and irresponsible.”
Not mined here (full text unavailable)
These WSF pieces of mine are paywalled or no longer online, so they aren’t mined here. There’s probably more Roza material in them:
- Baker, B.D., & Elmer, D.R. (2009). The politics of off-the-shelf school finance reform. Educational Policy, 23(1), 66–105.
- Baker, B.D. (2012). Re-arranging deck chairs in Dallas: Contextual constraints on within district resource allocation in large urban Texas school districts. Journal of Education Finance, 37(3), 287–315.
- Baker, B.D. (2008). Review of the Fordham Institute report Fund the Child: Bringing Equity, Autonomy and Portability to Ohio School Finance. EPRU Think Tank Review Project.
- Baker, B.D. (2007). Review of the Buckeye Institute report Shortchanging Disadvantaged Students. EPRU Think Tank Review Project.
- Baker, B.D., & Rebell, M. (2006). Robbing Peter to pay Paul: Weighted student funding is not the 100% solution. Education Week.
Also worth a look, though not WSF: Kevin Welner and I, Productivity Research, the U.S. Department of Education, and High-Quality Evidence (NEPC, 2011), and “Evidence and Rigor,” Educational Researcher 41(3) (2012). Both are the formal version of my complaints about the Roza/Hill productivity materials; the blog entries above quote the key passages.
Sources and fine print
Blog: all 548 School Finance 101 posts were searched in full text for Roza, Edunomics, Education Resource(s) Strategies, ERS, Hawley Miles, and CRPE. Posts that only cite a Roza paper without comment were left out. The Bluesky quotes (March 9, 2025) are transcribed from the screenshots in my July 24, 2025 post. The 2026 video quotes come from the posted transcript, built from auto-captions and lightly cleaned up.
Scholarship: titles come from my CV, and the full texts from ERIC and NEPC. Quotations from Roza, Hawley Miles, Frank, and others appear exactly as I quoted them, with the page citations I gave. Every quotation in this post was checked word for word against its source, which is more than the productivity curve can say.
Postscript: compare the records
A closing note on credentials, since Hill and Roza once cast me as the curmudgeon with nothing to offer. My CV lists 89 journal and law review articles, most of them peer-reviewed, in outlets like the American Educational Research Journal, Education Finance and Policy, Economics of Education Review, Educational Evaluation and Policy Analysis, Educational Policy and the Journal of Education Finance. It also lists six books, three with Harvard Education Press, 17 research chapters, nearly three decades of cost modeling built for state legislatures and courts, and expert testimony in 19 school finance cases. As of September 30, 2026, my Google Scholar profile shows 9,057 citations, an h-index of 53 and an i10-index of 118; that is, 53 of my works have each been cited at least 53 times. Roza doesn’t maintain a Google Scholar profile, so there’s no h-index to compare. Her Georgetown faculty bio lists where her work has appeared: the Brookings Institution, Public Budgeting and Finance, Education Next, Governing, the Peabody Journal of Education and the American Journal of Education, plus one book, Educational Economics: Where Do School Funds Go? That’s three peer-reviewed journals alongside a think tank, a magazine and a policy website. That isn’t a slur; it’s her own bio. And it’s the heart of the problem: a policy conversation that treats a slide deck and a Governing column as the equivalent of a cost function estimated on a statewide panel. Some of us show our work. The productivity curve never did.


One thought on “Seventeen Years of Roza-Tinted Glasses”
Comments are closed.