
Economists around the world treat schooling as an investment in human capital: the skills and knowledge that make people, and economies, productive. The international evidence that this investment pays is about as settled as anything in the field. Yet here in the U.S., we keep having the same argument about whether school money matters.
Here’s what I find across the 50 states. Count the school dollar the usual way, adjusted only for teacher wages, and it tells you nothing useful about economic growth since the 1990s. If anything, it points the wrong way. Count it against what it actually costs to build skills, given the kids a state serves, and the human capital chain appears: adequate funding goes with higher 8th-grade scores, higher scores with more college-educated adults, and more college-educated adults with faster income and GDP growth.
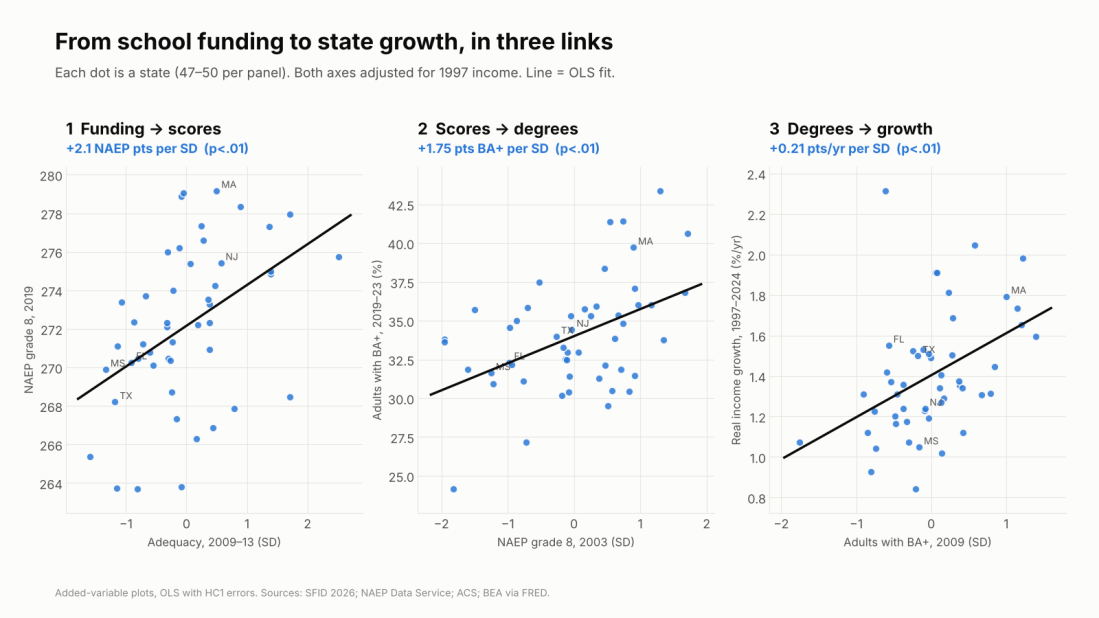
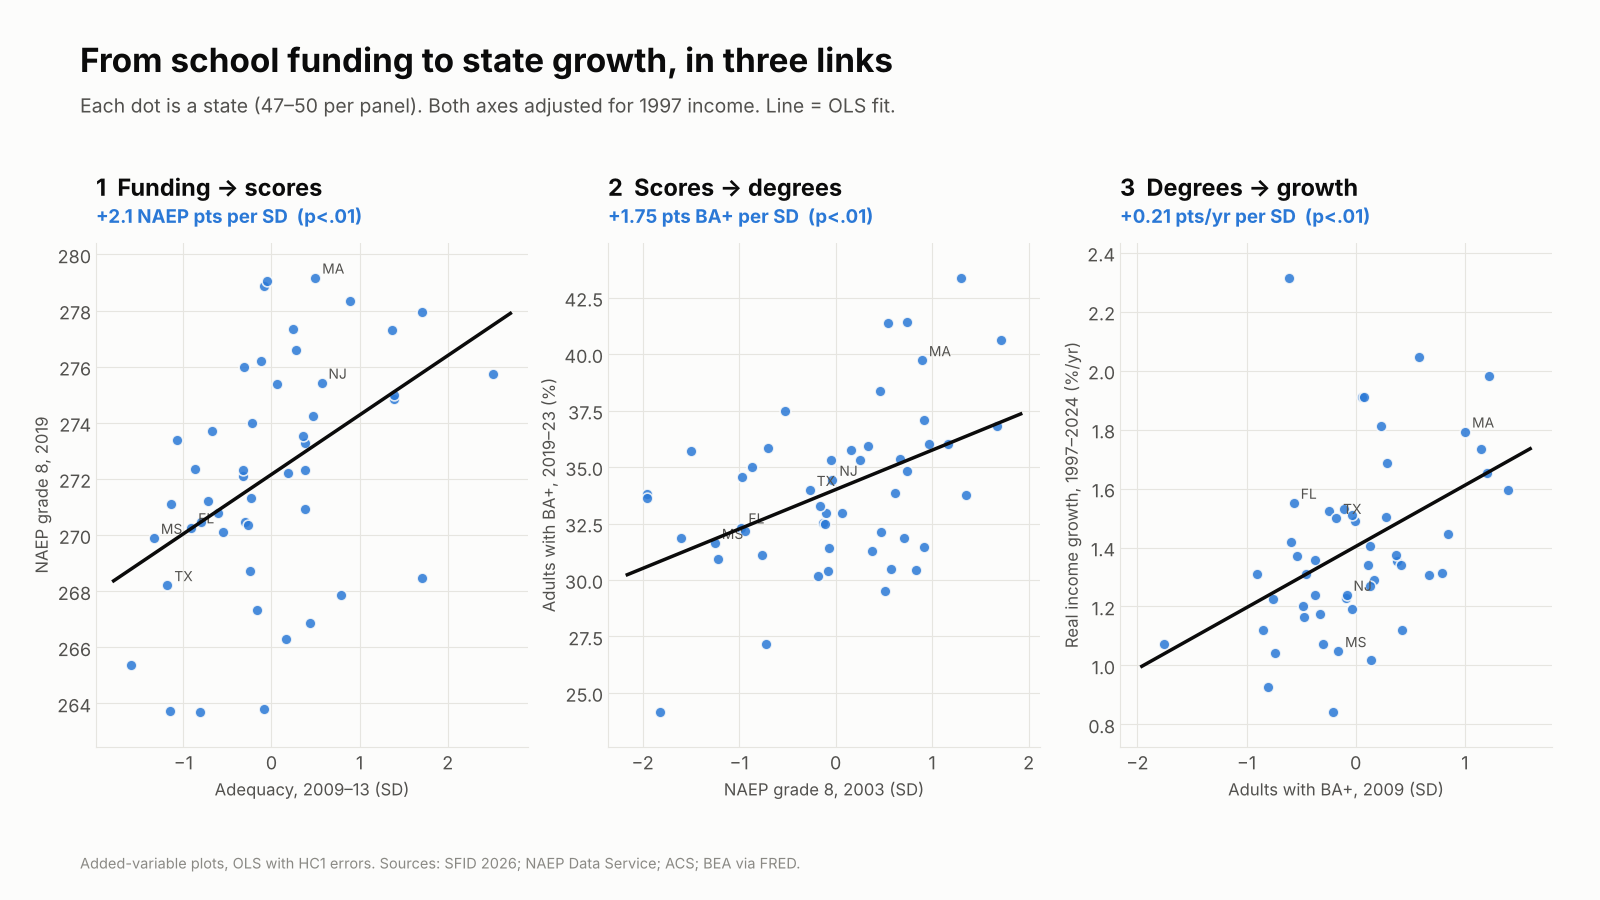
The numbers, per standard deviation across states, holding 1997 income constant:
- Funding → skills: about +2 NAEP points in 8th grade (2019), +1.2 for low-income students, and a 1.5-point smaller gap between them and their peers.
- Skills → degrees: +1.75 points more adults with a BA in states that scored higher in 2003.
- Degrees → growth: +0.21 points a year faster real income growth and +0.43 points a year faster GDP per capita growth over 1997–2024.
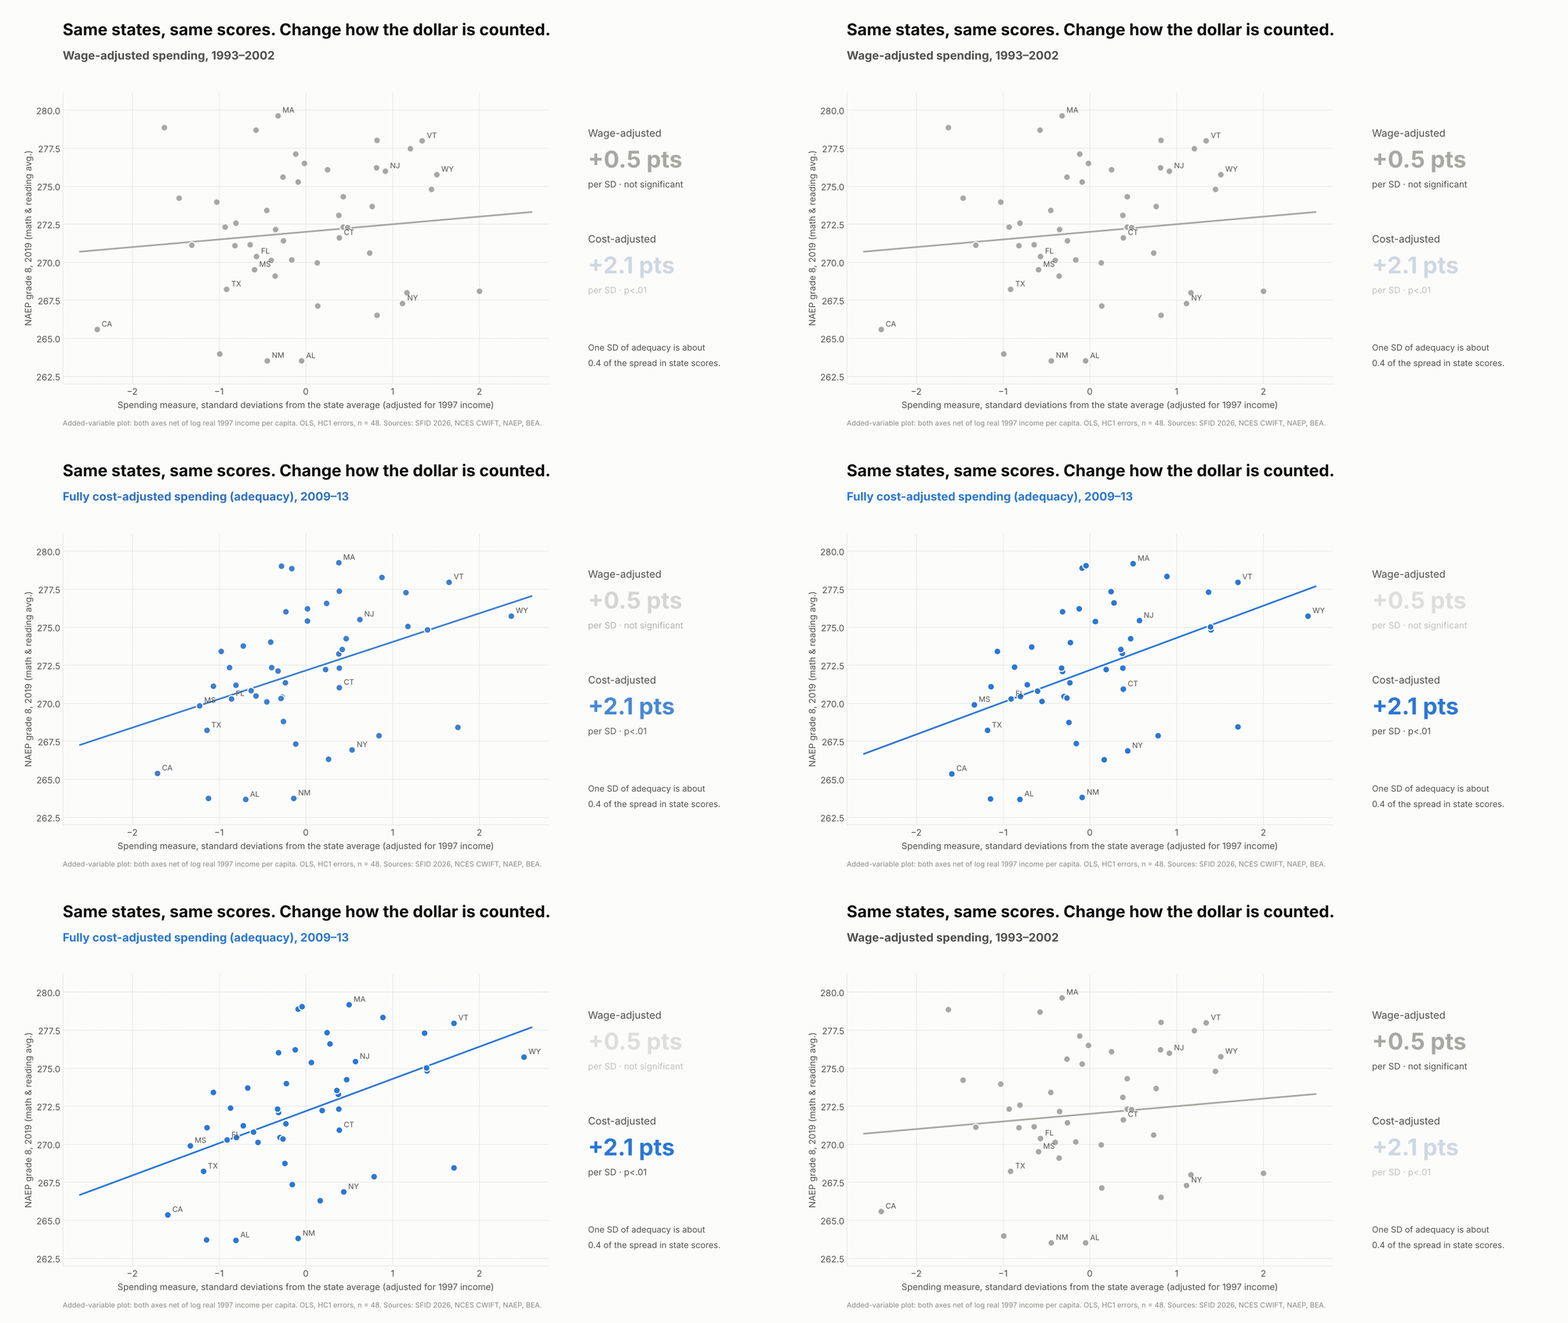
Put the wage-adjusted dollar and the cost-adjusted dollar in the same model and they split: adequacy predicts +0.39 points a year faster income growth, wage-adjusted spending −0.31. Same states, same years, opposite answers. The difference is whether you counted cost.
Full policy paper (PDF, 24 pages), with complete data sources, variable definitions, model specifications and results: Investing in Human Capital: Does Long-Run K-12 Investment Fuel State Economic Growth?
Schools are a human capital investment, and the world knows it pays
Years of school pay. Harry Patrinos and George Psacharopoulos have spent decades compiling returns to schooling. Their 2018 review pulls together 1,120 estimates from 139 countries and finds an average private return of about 9% per year of schooling (Psacharopoulos & Patrinos, 2018). Their 2025 follow-up looks only at causal estimates, 182 of them from 55 countries, and the return goes up, to 9.7%, about 38% higher than the correlational estimates (Patrinos & Psacharopoulos, 2025).
Learning pays more. One standard deviation higher test scores raises earnings about 15%, roughly one and a half times the value of an extra year of school (Patrinos & Psacharopoulos, 2025). Among adults in 23 countries, a standard deviation of numeracy is worth 18% in wages, and the U.S. pays the most for skills, at 28% (Hanushek et al., 2015). With harmonized learning data for 164 countries, human capital explains one-fifth to one-half of income differences across countries (Angrist, Djankov, Goldberg & Patrinos, 2021).
Skills drive growth. Across countries, a standard deviation higher achievement goes with 1.3 to nearly 2 points faster annual growth over decades (Hanushek & Woessmann; Heller-Sahlgren & Jordahl, 2021). Across U.S. states, knowledge capital explains 20–30% of differences in GDP per capita (Hanushek, Ruhose & Woessmann, 2017).
And it can be lost. Pandemic closures cost students about 0.17 of a standard deviation, half a year of learning (Patrinos, Vegas & Carter-Rau, 2022). The World Bank’s new Human Capital Index Plus puts the U.S. at 252 out of 325, below the high-income average and well behind Australia’s 270 (World Bank, 2026).
Here’s the gap. This literature measures human capital outputs with great care. Its school inputs are usually just spending per pupil, adjusted at most for prices. If schooling is an investment, the right question is whether a state spends enough to produce a given level of skills with the students it actually has. That is a cost question.
Four ways to count a school dollar
There are four common ways to count a school dollar, each correcting for more than the last: nominal; inflation-adjusted; labor-cost-adjusted, using a wage index like NCES’s CWIFT; and fully cost-adjusted, comparing spending with what it would cost to reach a common outcome goal given wages, scale and, above all, student needs. Only the fourth asks whether the money is enough for the job. That is what the School Finance Indicators Database’s National Education Cost Model measures. I’ve made this case in Why “Cost” Matters and Efficiently Mediocre.
Brookings’s state-level report (Reber & Goodman, 2025) stops at number three. Student need goes in as a control variable, not as a cost. That treats a dollar spent on a high-poverty student body as worth the same as a dollar spent on a low-poverty one, then controls away the very poverty that makes those dollars unequal. (See Mark Weber’s NEPC review.)
The human capital chain: investment → skills → degrees → growth
The setup is simple. Take state economic outcomes over 1997–2024 from BEA, and compare them with K-12 conditions earlier in the period: wage-adjusted spending from 1993–2002, NECM adequacy from 2009–13, NAEP from 2003, and adult BA attainment. Control for each state’s real income in 1997 so rich states don’t win just for starting rich. Everything is per standard deviation across states, with robust standard errors.
Link 1: investment → skills. A standard deviation of adequacy goes with about 2.1 NAEP points on the 2019 state average, +1.2 for low-income students, and a 1.5-point smaller gap. Wage-adjusted spending: +0.5, not significant. The adequacy link holds with the Northeast dropped (+2.2).
Link 2: skills → degrees. States whose 8th graders scored a standard deviation higher in 2003 have 1.75 points more adults with a BA today, and they added about half a point more BA holders between 2009 and 2024 as those kids grew up.
Link 3: human capital → growth. A standard deviation more BA holders in 2009 goes with 0.21 points a year faster real income growth and 0.43 points faster GDP per capita growth. Higher 2003 NAEP goes with +0.12 and +0.23. Low-income students’ scores predict growth just as well (+0.14 and +0.21), and those estimates survive dropping the energy and resource states.
How the state numbers stack up against the world
States differ far less than students do. A standard deviation across states on 2003 NAEP is 6.5 points, about a sixth (0.17) of a student-level standard deviation. Scale the international estimates by that and the state results land right where you’d expect:
| Global benchmark, per student SD | Implied for 1 state SD | What I find | |
|---|---|---|---|
| Skills → GDP per capita growth | +1.3 to +1.86 pts/yr | +0.22 to +0.31 pts/yr | +0.23 pts/yr |
| Skills → earnings | +15% (Patrinos & Psacharopoulos); +28% in the U.S. (Hanushek et al.) | +2.5% to +4.6% | About +3.3% higher real income after 27 years |
| Dollars → skills | +0.032 SD per $1,000 for four years (Jackson & Mackevicius, 2024) | — | About +0.012 SD per $1,000 of adequacy |
The growth estimate sits inside the range the cross-country studies predict; +0.23 points a year compounds to a GDP per capita level about 6% higher over 27 years. The funding estimate, per dollar, is about a third of the causal estimate from U.S. school finance evaluations: modest, not inflated. These are rough conversions across different tests, but nothing here is out of line with what the human capital literature would lead you to expect.
Diverging states, diverging futures
Here’s where I want to be blunt. The United States does not have one human capital system. It has fifty, and they are sorting into leaders and laggards.
- Attainment is diverging. States with more college graduates in 2009 added more of them by 2024. The five most-educated states went from 36% to 46% of adults with a BA; the five least-educated went from 20% to 27%. The gap widened from 16 to 19 points.
- The economic extremes are pulling apart. Massachusetts’s GDP per capita was 1.6 times Mississippi’s in 1997 and 2.2 times in 2024. For most of the twentieth century, poorer states caught up with richer ones; Ganong and Shoag show that convergence has slowed dramatically over the past three decades.
- The skills gap between states is an international-scale gap. In the most recent state-by-country comparison, the 2011 NAEP–TIMSS linking study, Massachusetts’s 8th graders scored 561 in math, behind only five of 47 education systems, the closest being Japan. Alabama scored 466, statistically tied with Turkey and Armenia. That 95-point spread is close to a full international standard deviation, a gap that across countries goes with 1.3 to 1.9 points of annual growth.
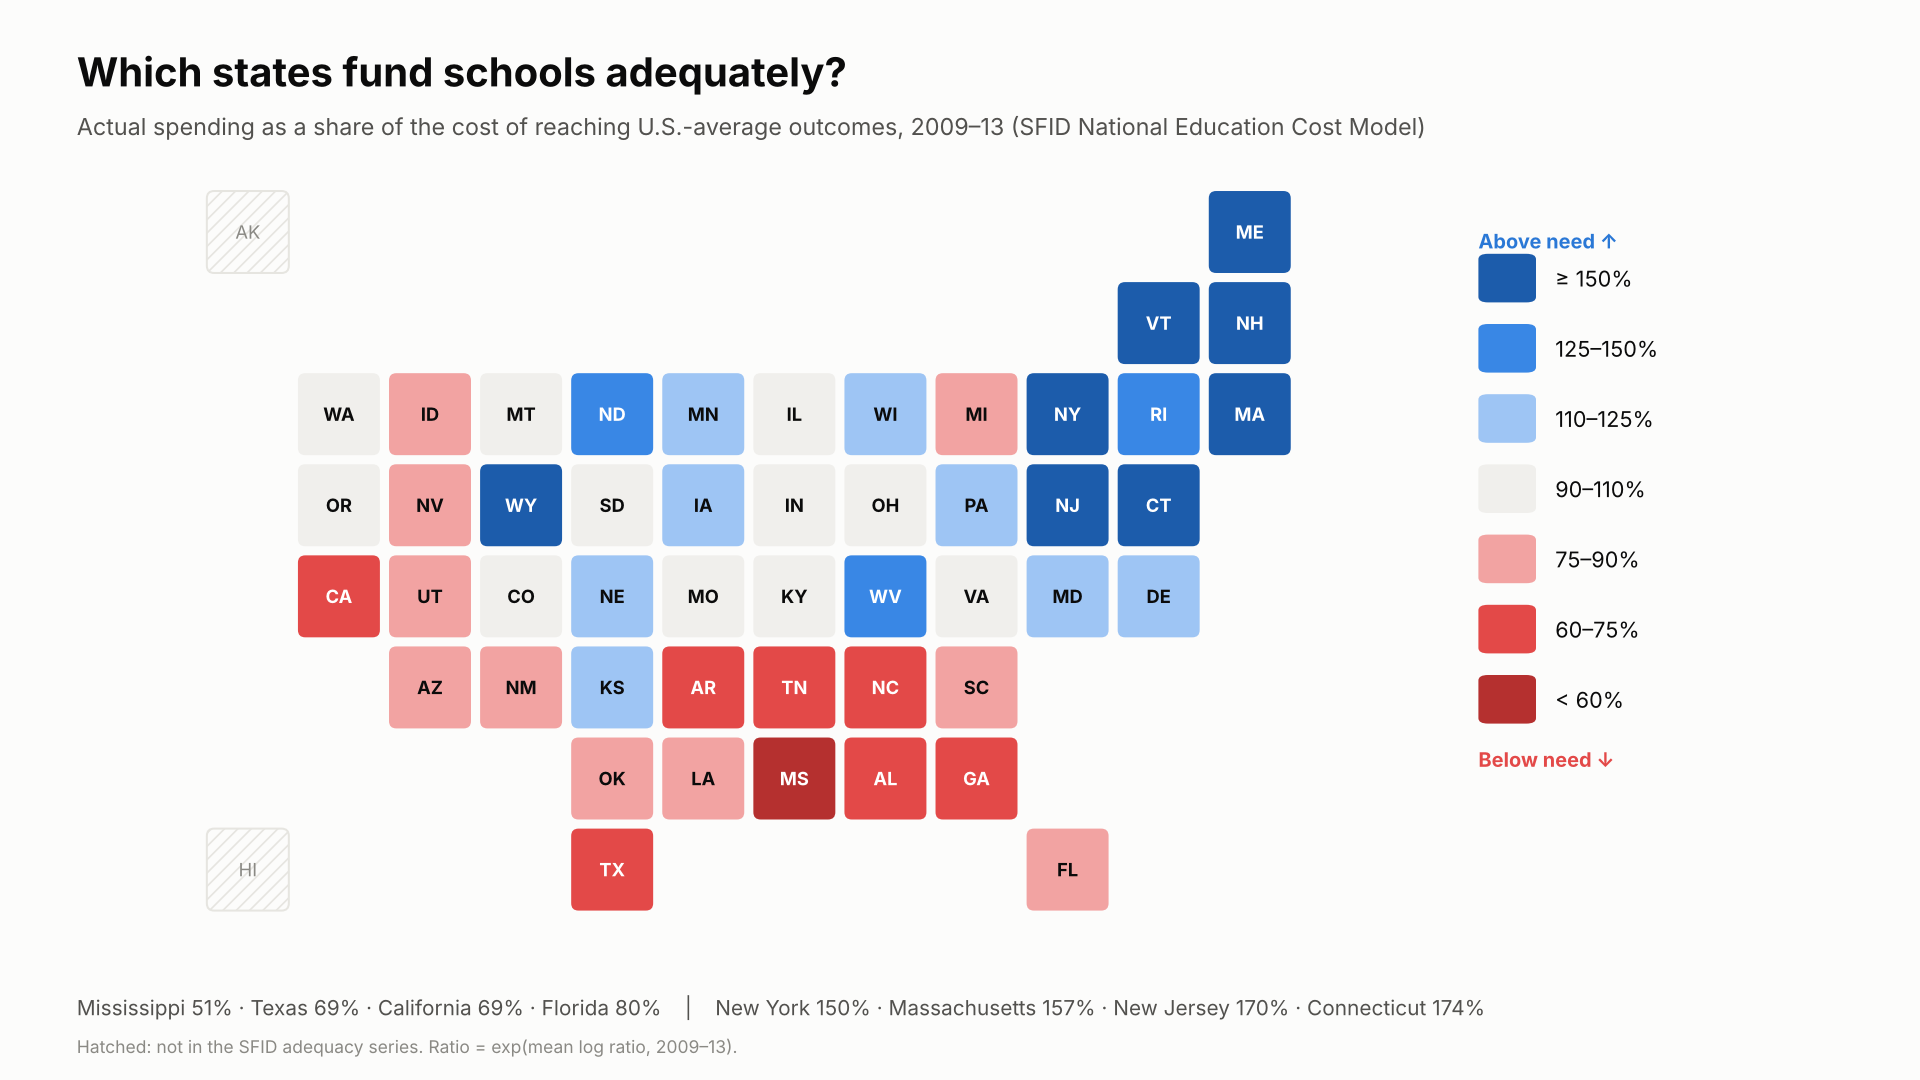
- The funding gaps behind it are persistent. States’ adequacy positions barely move over a decade (correlation 0.92). Mississippi spent about half of what its students needed in 2009–13 and was still $9,300 per pupil short in 2021–23, and $25,100 short in its highest-poverty districts.
The knowledge economy concentrates where human capital is. Research universities, technology industries and scientific talent cluster in states with deep pools of skilled workers, and those states draw more of them. If current funding patterns hold, the leading states will keep compounding that advantage. The lagging states will keep producing fewer skilled workers, attracting fewer knowledge industries, and losing many of the graduates they do produce.
Let me be precise about how far this goes. No state is about to become a developing country in income. Mississippi’s GDP per capita, $41,300 in 2024, is far above most of the world’s, propped up by a national labor market and federal transfers. But on skills, our lowest-performing states already score alongside upper-middle-income countries such as Turkey and Armenia, while our highest-performing states compete with Japan. Skills set the ceiling on what an economy can become. A country that draws its scientists, engineers and entrepreneurs from a handful of states is leaving most of its human capital on the table. Because states and localities supply most K-12 funding, the path forward for American economic and scientific development runs through state investment in human capital, measured against what it actually costs to build it.
A note on California. California sits near the bottom of the map above, which shows 2009–13, and it still falls short of adequate funding today, especially in its highest-poverty districts. But in my analyses, no state has improved more since 2009. As I showed in The Red State Miracle That Wasn’t, California’s highest-poverty districts went from 65% to 79% of adequate funding between 2009 and 2024, most of it after the Local Control Funding Formula began phasing in after 2013, though they remain about $5,600 per pupil short. In the state data behind this post, California climbed from 45th of 48 states on adequacy in 2009–13 to the middle of the pack by 2021–23. California is digging out of a very deep hole. The 1978 tax revolt, Proposition 13, capped property taxes at 1% of assessed value and gutted the local revenue that had supplied about two-thirds of school funding.
What this does and doesn’t show
These are cross-state associations, not causal estimates. College graduates move, so a state’s BA share partly reflects whom it attracts. Adequacy is measured in 2009–13, inside the growth window, so faster-growing states may simply have afforded better-funded schools. And required cost reflects student need, which also lowers scores. The paper documents each of these and the robustness checks behind them.
But the stronger designs point the same way. Jackson and Mackevicius (2024) pool U.S. school finance evaluations and find that $1,000 more per pupil for four years raises test scores by 0.032 SD and college-going by 2.8 points. Jackson, Johnson and Persico find that sustained spending increases raise adult wages. And the international lesson from Patrinos and Psacharopoulos is that causal returns to education run higher than correlational ones. If anything, cross-state associations like mine are more likely to understate the human capital return than to invent it.
The bottom line
Around the world, nobody serious doubts that human capital pays. A year of school is worth about 9–10% in earnings, a standard deviation of learning about 15%, and a country’s skills go a long way toward explaining its growth. The U.S. debate gets stuck because it measures the investment badly. Measure it against the cost of building skills, and the return shows up across the states just as it does across countries: funding to skills, skills to degrees, degrees to growth.
The states are not converging; at the top and bottom they are pulling apart. Whether America remains an economic and scientific leader depends on whether every state invests in the human capital of all its children, and especially the children who rely most on public schools, or whether we settle for a few states that lead and many that fall further behind.
Read the full policy paper (PDF): Investing in Human Capital: Does Long-Run K-12 Investment Fuel State Economic Growth? It includes all data sources, variable definitions, model specifications, robustness checks, a full table of results and replication details.
Data: BEA via FRED; School Finance Indicators Database (2026); NCES ACS-CWIFT; NAEP Data Service; ACS. International sources are listed in the paper.

