The Gender Pay Gap in New Jersey Schools Lives in the Principal’s Office

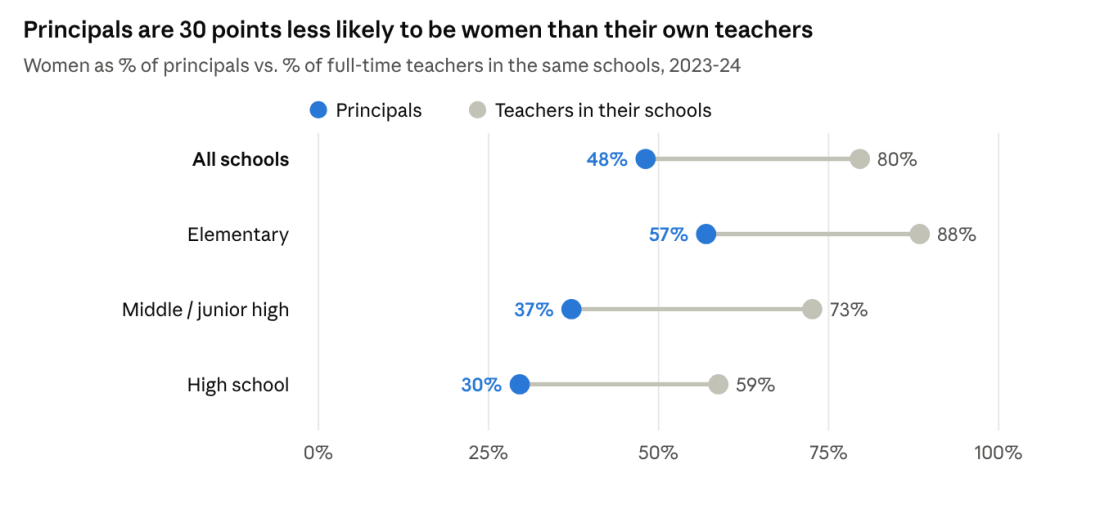
Dot chart: women are 48% of principals vs 80% of their teachers overall; elementary 57% vs 88%; middle 37% vs 73%; high school 30% vs 59%, 2023-24.

Teaching is a predominantly female profession. Nationally, 77% of public school teachers are women (NCES); in New Jersey, women hold 76% of full-time teaching jobs.

It is also an underpaid one. The Economic Policy Institute finds that teachers earned 25.2% less in weekly wages than comparable college-educated workers in 2025, up from 6.1% in 1996. Counting teachers’ better benefits, the penalty is still 14.5% (EPI). New Jersey does better than most states but not well: EPI puts its penalty at about 14%. School Finance Indicators Database estimates found New Jersey teachers earning 15.9% less than similarly educated non-teachers of the same age (SFID via NJPP; Shanker Institute). A mostly female profession paid well below its peers is already a gender pay story.

Within teaching, though, it would at least seem that there should be no gender pay gap. Public school salaries are set by negotiated guides: a step for each year of experience, a column for each degree, the same scale for everyone in the district. A woman and a man with the same degree and years should earn the same.

The data tell a few different stories. I looked at every full-time certificated employee in New Jersey from 2017-18 through 2023-24, more than 800,000 person-years of salary records.

  1. The pay gap does exist. In 2023-24 the typical woman teacher earned $79,069 and the typical man $83,510, about 95 cents on the dollar. Even among teachers in the same district with the same degree, experience and assignment, women earn about 0.6% less.
  2. It is bigger for principals. The typical woman principal earned $145,500, against $155,567 for men. Within the same district, at the same school level and size, women principals earn 3.3% less, about five times the teacher gap. Among high school principals the median gap is $20,496.
  3. Women tend to be in the lower-paying jobs and settings, even within K-12 schooling. Elementary-only districts are 86% women and pay about 6% below average for the same credentials. Principals are 30 points less likely to be women than the teachers in their own schools, and men principals are twice as likely to lead a high school.

The common thread: where pay follows a published rule, the gap nearly disappears. It persists where pay is negotiated person by person, and where women and men end up in different districts and different jobs.

Teachers: the salary guide does its job

Most of the teacher gap comes from who teaches what, and where. Men are concentrated in high schools, in larger schools, and in fields such as science, industrial arts, vocational education and social studies, and those settings pay more. Hold job code, school level and size, and district constant, and the gap all but disappears.
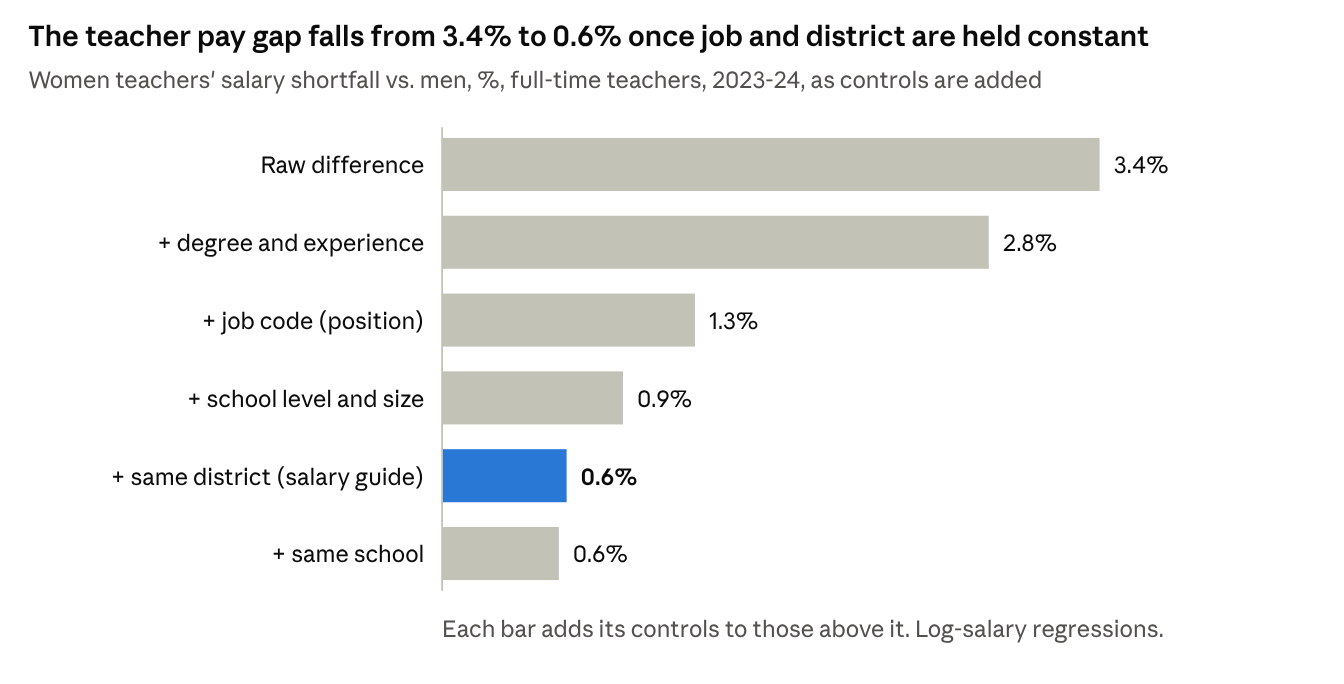
Bar chart: women teachers' pay shortfall falls from 3.4% raw to 2.8% with degree and experience, 1.3% with job code, 0.9% with school level and size, 0.6% within district and 0.6% within school, 2023-24.
Source: NJDOE certificated staff file, 2023-24; 93,263 full-time teachers with name-classified gender.

Within the same district, a woman teacher with the same degree, experience and assignment as a man earns about 0.6% less, roughly $520 a year. In elementary and middle schools it is 0.2–0.3%, and for teachers with 25 or more years’ experience it is essentially zero.

What is left is mostly money outside the guide. In 2022-23 and 2023-24, men teachers’ supplements, such as coaching and club stipends, averaged $1,460 against $814 for women. Measured on base salary alone, the within-district gap shrinks from 0.71% to 0.39%.

Principals: the gap the guide doesn’t reach

Principals are a different story. In 2023-24, women principals earned 3.3% less than men in the same district, at the same school level and size, with the same degree and experience. That is roughly $4,800 a year, about five times the teacher gap. Assistant principals show about 2%. Superintendents show about 2% after accounting for district enrollment.

The gap does not depend on what kind of school a principal leads: it is 2.6% in elementary schools, 2.3% in middle schools and 3.0% in high schools. It does grow with seniority, from 2.0% for principals with under 15 years of experience to 3.2% for those with 25 or more. That is what we would expect if pay is negotiated contract by contract and differences compound over a career.
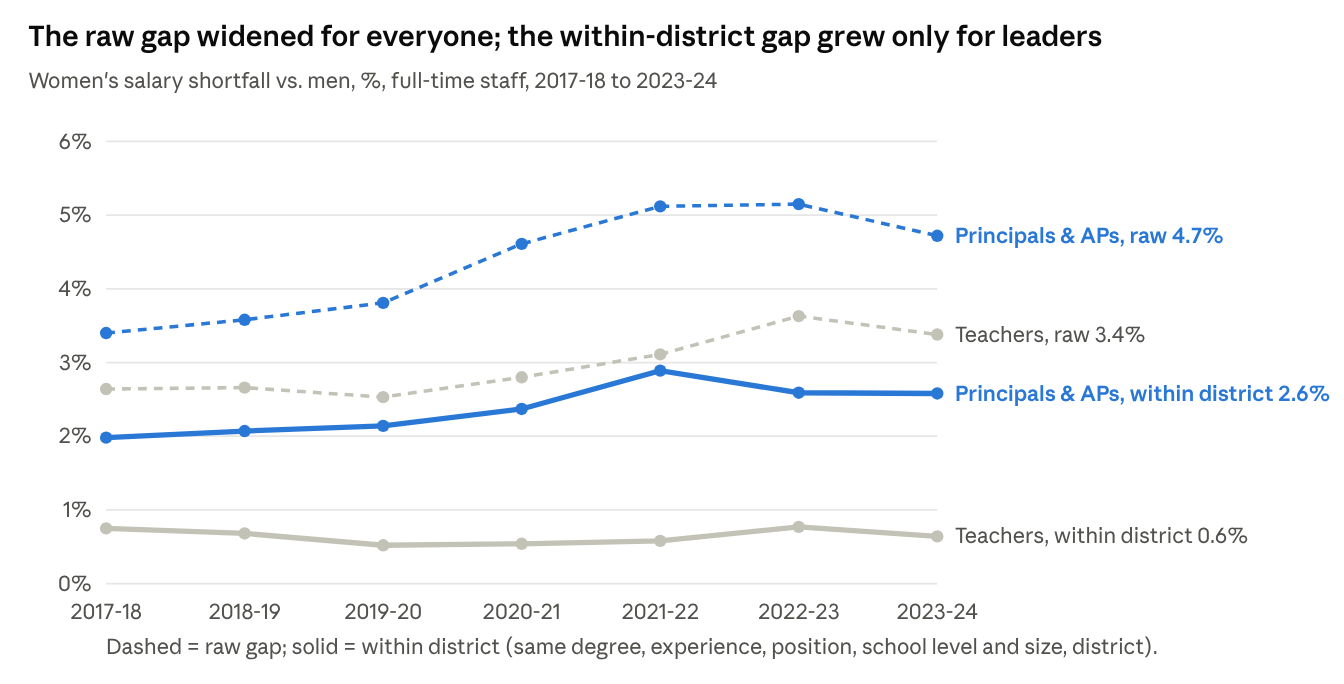
Line chart, 2017-18 to 2023-24: raw gap for principals and APs rose from 3.4% to 4.7%, within-district from 2.0% to 2.6%; teachers raw from 2.6% to 3.4%, within-district flat at 0.5-0.8%.
Source: NJDOE certificated staff files, 2017-18 to 2023-24; log-salary regressions by year.

The trend makes the contrast plain. Raw gaps widened for teachers and leaders alike between 2018 and 2024. For teachers, the gap within the same district held at 0.5–0.8% every year. For principals and assistant principals it grew, from 2.0% to 2.6%.

Representation compounds the problem. Women are 76% of New Jersey’s teachers but 48% of its principals, 37% of its superintendents and 31% of its high school principals, the best-paid principal jobs.

Who works where

Much of the raw gap comes from structure rather than from different pay for the same post. Three patterns stand out.

Different districts, different staffs, different guides. New Jersey still runs hundreds of elementary-only (K-8) districts alongside regional high school and county vocational districts. The elementary districts are 86% women and pay about 6% below the state average for the same degree and experience. Regional high school districts (59% women) and county vocational districts (53% women) pay 2–6% above it.
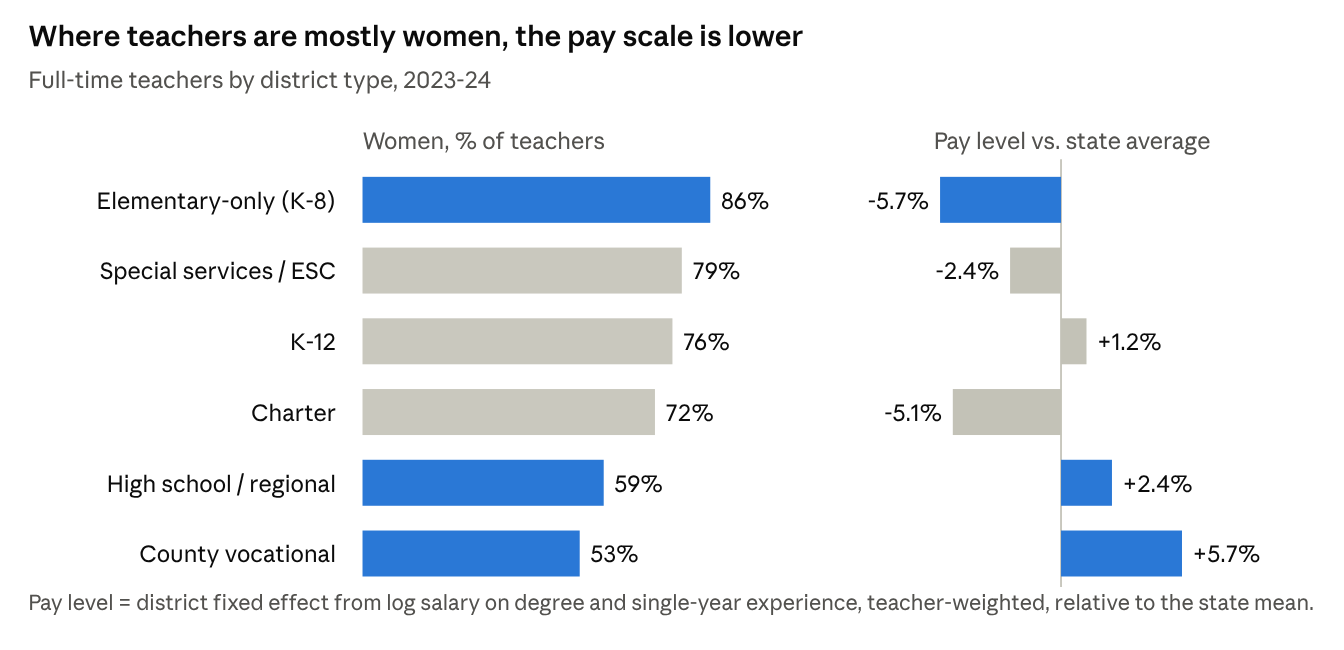
Chart by district type: elementary-only 86% women, pay 5.7% below state average; special services 79%, -2.4%; K-12 76%, +1.2%; charter 72%, -5.1%; high school/regional 59%, +2.4%; county vocational 53%, +5.7%.
Source: NJDOE certificated staff and enrollment files, 2023-24. Pay level = district effect on log salary net of degree and experience.

Men teachers are more likely to work under those higher guides. 8.0% of men teachers work in regional high school districts, against 3.6% of women, and 4.9% of men work in county vocational districts, against 1.7% of women. Nearly one in five women teachers (18.5%) works in an elementary-only district, against one in ten men.

This is not just a difference in job mix. Comparing teachers in the same job code, elementary-only districts still pay 5.1% below average, while regional high school districts pay 0.7% above and vocational districts 2.2% above. District by district the pattern holds: each 10 points more women on a teaching staff goes with a pay scale about 3.5% lower. Which district a teacher works in accounts for about 23% of the raw teacher gap.

Principals don’t look like their staffs. In 2023-24, 48% of principals were women, compared with 80% of the teachers in their own schools. The shortfall is about 30 points at every level: elementary principals are 57% women against 88% of their teachers, and high school principals 30% against 59%. Even in schools where 90% or more of the teachers are women, only 56% of principals were women between 2018 and 2024. If principals mirrored their own schools’ teachers, roughly 620 more women would have been principals in 2023-24. Assistant principals come closer, at 50% women against 70% of their teachers.
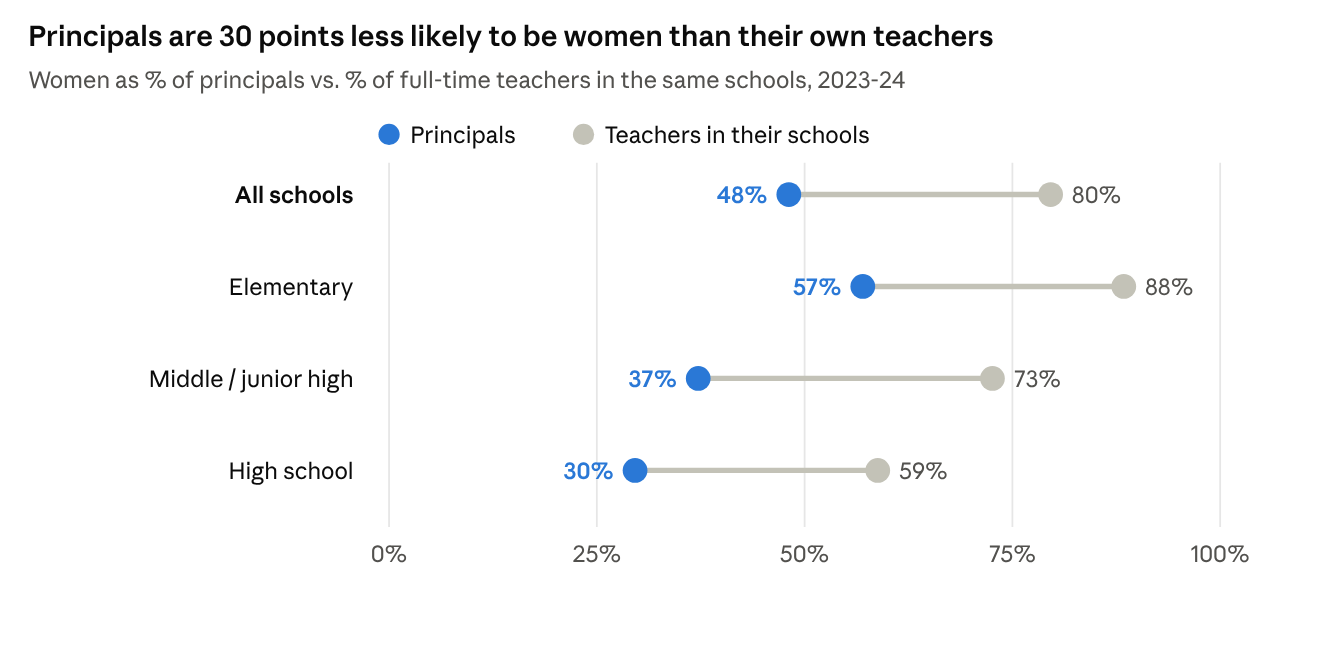
Dot chart: women are 48% of principals vs 80% of their teachers overall; elementary 57% vs 88%; middle 37% vs 73%; high school 30% vs 59%, 2023-24.
Source: NJDOE certificated staff files, 2023-24; 1,967 principals matched to schools with 10+ classified full-time teachers.

Men lead the high schools. A quarter of men principals lead high schools, against an eighth of women; 71% of women principals lead elementary schools, against half of men. In regional high school districts, 7 of 50 high school principals are women.

Principals, 2023-24MenWomen
Share leading high schools25%12%
Median salary, elementary$152,230$145,481
Median salary, high school$169,096$148,600

The high school premium goes mostly to men. Men high school principals earn $16,867 more at the median than men elementary principals; for women the difference is $3,120. Women who lead high schools tend to run smaller ones (median enrollment 735 vs. 1,022), and more often in charters and lower-paying districts. Inside the same district, women high school principals earn about 3% less than men, about the same as at other levels.

Putting it together: for teachers, school level, job, school size and district explain about 60% of the raw gap. Experience explains most of the rest, and about a fifth is left unexplained. For principals, school level explains about a fifth and district and school size about a third. Half the principal gap remains unexplained, among people in the same district, at the same level, leading schools of the same size.

The full policy brief, with data and methods, detailed tables, robustness checks and policy recommendations, is available as a PDF:

A Philadelphia Story of Underfunding

In 2009, the School District of Philadelphia spent about 59% of what it would cost to get its kids to national average outcomes. In 2024, it spent about 55%. Fifteen years, two governors’ worth of “fair funding” talk, one landmark court ruling, and the city sits right about where it started: roughly half of adequate.

Meanwhile, just across City Avenue, Lower Merion spent 333% of adequate in 2009 and 226% in 2024. It’s down, sure. It’s still more than four times Philadelphia’s position on the same yardstick.

I’ve been writing about Philadelphia on this blog for well over a decade. It keeps showing up because it keeps being the clearest case of a pattern I see across states: a state school finance system that provides systematically less to the districts that need the most, and then blames those districts for the results. This is the Philadelphia Story, updated through 2024, and through the state’s response to having its system ruled unconstitutional.

Philadelphia, “screwed,” and the myth of the money pit

Philadelphia has been a fixture on my lists of the nation’s most financially disadvantaged (“screwed”) city school districts for as long as I’ve been making them. Those lists measure state and local revenue per pupil relative to other districts in the same labor market, alongside child poverty relative to that same market. Philadelphia always lands there in good company: Reading and Allentown, often at or near the very top of the mid-size city list. When Next City covered the list in 2013, Pennsylvania had 11 districts on it, more than any other state, and Philadelphia was handing out 3,783 layoff notices to close a $300 million hole.

“They’ve thrown millions at Philly and gotten nothing”

Then there’s the storyline that won’t die. Philadelphia, we’re told, is the cautionary tale: a district that has been handed millions upon millions, with nothing to show for it. Proof that money doesn’t matter. Time to close schools, charter everything, and move on.

I took this on in 2013 in Debunking Reformy “Messaging”: A Philadelphia Story, after claims circulated that Philadelphia received among the most state aid in Pennsylvania. Of course it does, in total. It’s the largest district in the state. Big aggregate numbers (state aid totals, a multi-billion-dollar operating budget) say nothing about whether the dollars per child are sufficient for the children actually enrolled. Per pupil, relative to need and relative to its neighbors, Philadelphia has been short for as long as anyone has been measuring.

The “handed millions, got nothing” argument requires a period in which Philadelphia was actually handed enough. The graphics below show there was no such period. Not in 2009. Not in 2013. Not in 2021. Not in 2024. You can’t conclude money didn’t work when the money never showed up. As I put it back then, “real reform must begin with resources!”

What adequacy actually costs, and which bar we’re setting

In 2014, Jesse Levin and I wrote Educational Equity, Adequacy, and Equal Opportunity in the Commonwealth for the William Penn Foundation. The headline was not subtle. Pennsylvania ran one of the least equitable state school finance systems in the nation. Funding was regressive, with higher-poverty districts receiving less state and local revenue per pupil than lower-poverty ones. Against the state’s own 2008 costing-out targets, shortfalls approached $4,000 per pupil in the highest-poverty quintile, versus about $1,200 in the lowest. Districts with smaller funding gaps, all else equal, posted higher PSSA and SAT results.

The national education cost model (NECM) in the School Finance Indicators Database extends that logic nationally. It estimates, for every district, what it would cost to reach a given outcome target, accounting for poverty, labor costs, scale, and population density. In The Real Shame of the Nation, we found Philadelphia, Reading, and Allentown spending roughly half of what it would take to reach national average outcomes, and performing about where the model would predict for that spending. Lower Merion, next door, spent nearly four times its estimated need.

The formula that almost was

Pennsylvania did once try to fix this. A 2007 state costing-out study found that 474 of 501 districts spent less than an adequate amount, and that closing the gap would take about $4.4 billion more a year, roughly $1 billion of it in Philadelphia alone. In 2008, Governor Ed Rendell pushed through a new need-based formula built on that study, with the goal of raising the state’s share by $2.6 billion a year by 2014. It would have helped. The first year brought a $275 million increase in basic education funding.

Then the Great Recession hit. In 2009-10 and 2010-11, the state cut its own contribution and backfilled with $654 million a year in federal stimulus money, so the formula’s “increases” were largely federal dollars. When the stimulus ran out, the 2011-12 budget under Governor Tom Corbett cut education aid deeply and the formula was abandoned. Philadelphia’s slide in the graphics below, from 59% of adequate in 2009 to the mid-40s, is what that collapse looks like on the ground.

Two bars: national average and Massachusetts average

The graphics below use the national average outcome as the target. That’s worth dwelling on, because it’s a low bar. It doesn’t ask Philadelphia’s kids to be exceptional. It asks only that they score like the typical American child. Philadelphia hasn’t been funded to clear even that.

Now raise the bar to the Massachusetts average, the outcome level of the nation’s consistently top-performing state, and a reasonable stand-in for what a well-funded, high-expectation system can deliver. The cost of reaching a higher target rises, and it rises fastest for districts serving the highest concentrations of poverty. So every gap in this post gets bigger, and Philadelphia’s gets bigger the most.

I raise both because Pennsylvania’s policy debate tends to treat “adequate” as a generous aspiration. It’s not. At the national-average standard, it’s the floor. At the Massachusetts standard, it’s what a state that takes its constitutional obligation seriously would actually be aiming for.

Fifteen years in two pictures

The first graphic maps each district in the Philadelphia metro by its percent of adequate funding: actual per-pupil spending divided by the estimated cost of national-average outcomes. Blue is above 100%. Red is below.

Philadelphia metro, % of funding adequacy by district, 2009-2024. Source: School Finance Indicators Database (NECM/SEDA merged file).

The story in the spotlight panel:

District2009201320212024
Philadelphia City59%53%45%55%
William Penn77%58%49%55%
Upper Darby91%69%59%56%
Norristown105%97%72%82%
Radnor Twp261%218%231%223%
Lower Merion333%292%251%226%

Two things jump out. First, Philadelphia never gets close. It starts at 59%, bottoms out in the mid-40s, and ends no better than it began. Second, the red is spreading. In 2009, 5 of 62 metro districts were below adequate. By 2024, 15 were. The inner-ring Delaware County districts (Upper Darby, William Penn) slid from near-adequate to Philadelphia’s level, and Norristown dropped below the line. Even as the metro average fell from 187% to 138% of adequate, the wealthiest suburbs stayed comfortably above 200%.

The second graphic plots all of Pennsylvania’s roughly 500 districts: percent of adequate funding on the horizontal axis, outcomes relative to the national average on the vertical, bubbles sized by enrollment.

Pennsylvania school districts, funding adequacy vs. outcomes, 2009-2024. Source: School Finance Indicators Database (NECM/SEDA merged file).

The relationship is about as clear as these things get. Districts left of the 100% line sit almost uniformly below the national average. Philadelphia, Reading, and Allentown huddle together in the lower-left corner in every year, roughly 0.4 to 0.7 standard deviations below the national mean. Lower Merion sits in the upper right, around 0.8 above. These districts are not underperforming relative to their resources. They are performing about where their resources predict.

One caution on 2024. Philadelphia’s uptick from 45% to 55% likely reflects, at least in part, temporary federal pandemic relief, which has since expired. And these data end before the first post-ruling state adequacy supplement arrived in 2024-25. Which brings us to the court.

The court ruled. Then what?

In February 2023, Commonwealth Court Judge Renée Cohn Jubelirer ruled in William Penn School District v. Pennsylvania Department of Education that the state’s school funding system was unconstitutional. The roughly 800-page opinion found the system failed students in low-wealth districts and left the remedy to the legislature. Note who the lead plaintiff is. William Penn, in Delaware County, sat at 77% of adequate in 2009 and 55% in 2024.

The legislature’s Basic Education Funding Commission came back in January 2024. Its majority report found 387 of the state’s 500 districts below their adequacy targets and called for $5.4 billion in new money phased in over seven years, plus annual increases for cost growth.

Here’s what has happened since:

Budget yearNew adequacy and tax-equity supplementNotes
2024-25About $526 million$494 million adequacy plus $32 million tax equity. Philadelphia’s share: $136.6 million, against an adequacy gap of $1.25 billion (Philadelphia Tribune)
2025-26$565 millionPassed after a 4-plus-month impasse; Philadelphia’s board authorized borrowing up to $1.55 billion to cover missing state payments (WHYY)
2026-27$565 millionSigned July 12, 2026 (City & State PA)

That’s about $1.66 billion over three years. Even the commission’s own seven-year path implies about $770 million a year. The state is behind a schedule that was already a compromise, and it has now flat-lined the increment at $565 million, two years running, while costs keep rising. State Sen. Vincent Hughes now says this adequacy money means “70 percent of Pennsylvania schools are funded constitutionally.” That framing tells you which 30% are still waiting. Philadelphia, Reading, Allentown, and William Penn are not hard to guess.

And the adequacy targets themselves are modest. The commission benchmarked “adequate” to the spending of districts already meeting state performance thresholds, a successful-schools-style method that Jesse Levin and I flagged back in 2014 as a weak basis for costing out what high-need districts require. Measured against the national-average bar, never mind Massachusetts, the destination is short of where the cost model says it needs to be.

In between Rendell’s formula and the 2023 ruling, nothing was done that actually fixed the problem. Formulas were renamed and tweaked at the margins, but the distribution of state aid never moved much toward need, and the overall level never caught up to what the state’s own cost study said was required.

So: not no money. But little progress where it counts. Three rounds of supplements after a constitutional ruling, and Philadelphia’s own formula gap remains above $1 billion. Measured against national-average outcomes, the city has spent the entire period somewhere between 45% and 60% of adequate.

What it would take

The Philadelphia Story isn’t complicated. It’s just long. A state that relies heavily on local property wealth, a big city with high need and limited capacity, and a ring of suburbs spending two or three times what they need. Cut aid when times are tight, as in 2011. Pass a formula, then let it die. Lose in court, then fund the remedy at a pace that leaves the neediest districts waiting longest.

Getting Philadelphia to adequate means:

  1. Close the gap on a real schedule. Fund the remaining adequacy gap in full within the commission’s seven years. Don’t flat-fund the increment.
  2. Pick a meaningful target. National-average outcomes should be the floor, not the goal. Cost out what it would take to reach Massachusetts-level outcomes and be honest about the difference.
  3. Run all the money through the formula. Make sure state aid actually follows need, and keep the formula funded through the next downturn.
  4. Keep score. Track spending against cost-model estimates year by year, district by district, the way the graphics above do.

And the next time someone tells you Philadelphia proves money doesn’t matter, ask them a simple question: in which year was Philadelphia ever funded adequately? I’ve got fifteen years of data here. I can’t find one.

Sources

Should Think Tanks be Licensed to Think? (and when should a license be revoked?)

We all have our flaws. As social science researchers, writers, reviewers, etc. dealing with highly political and politicized topics, we all let our personal biases creep inappropriately into our work at times. In the world of education policy writing and research, there are many occasions where individuals and organizations are provided opportunities to selectively review and present data and summaries of existing literature in order to make one point or another or argue one side of an issue or another. There will always be reasonable differences of opinion on complex social science issues, both with regard to the methods that should be used to provide definitive answers, and the definiteness of the answers themselves.

All of that aside, there are, I believe some really basic rules of thumb that should be followed and some offenses that should be considered so egregious that they warrant public rebuke and removal from the table around which public discourse occurs on key education policy topics.

My latest example of an offense so egregious comes from a review I completed today on a report from Lisa Snell of the Reason Foundation – the Weighted Student Formula Yearbook 2009. Reason Foundation is a Think Tank, so-to-speak, or at least fashions itself as such. There are many “Think Tanks” across the political spectrum and these Think Tanks frequently chime in with well-publicized findings regarding education policy and finance issues. So, this is not new. That said, this particular report is simply so awful, I can’t shake it from my head.

To summarize, the report touts urban school reforms which involve decentralized management and school choice, two issues on which I personally do not have strong opinions one way or the other, from an ideological perspective (rather, my concern is that if one pursues a particular reform, it should be done using appropriate evidence, and should be done well – or as well as can be – and not half-baked). The report inappropriately casts the varied reforms presented as Weighted Student Formulas  – a specific reform which involves using a student need focused funding formula to drive financial resources to schools – something which, if done well, could be quite a good idea.

So… I digress… what is so awful then about the Reason report? Why do I think their license to think should be revoked and their seat at the education policy debate table eliminated? In an effort to make their case that the reforms implemented in 14 cities and 1 state have all been highly successful, the authors go so far as to cite evidence of improved student outcomes – in one third of their 15 cases – that occurred in years prior to the implementation of the reforms. That is, the reforms somehow, amazingly, through space-time travel perhaps, had retroactive effects on student outcomes. I’m dumbfounded!

Here’s a section of my review:

=====

Most problematic is the fact that in five of the 15 cases discussed (one third of the cases), outcome successes mentioned actually occurred prior to the implementation of WSF or SBB/SBM (see Appendix A). For example, the report commends NYC for winning the 2007 Broad prize, the year before its Fair Student Funding policy was implemented. The report might arguably attribute this success to mayoral takeover, which began in 2002. But this is the WSF Yearbook, and even the expansive definition of WSF used in the report did not encompass mayoral takeovers.

Similarly, the report commends Hartford for raising test scores in 2008, the year before implementing WSF, and it commends Denver for making strong improvements between 2005 and 2008, whereas WSF was implemented in 2008-09. These successes lead one to question why these districts would want to implement WSF and risk undoing their prior achievements.

The most egregious claim of retroactive causation appears in the press release for the report:

The results from districts using student-based funding are promising. Prior to 2008, less than half of Hartford, Connecticut’s education money made it to the classroom. Now, over 70 percent makes it there. As a result, the district’s schools posted the largest gains, over three times the average increase, on the state’s Mastery Tests in 2007-08 (emphasis added).[i]

Yet, the report itself states that Hartford only began implementing WSF in 2008-09, and only expected to achieve the 70 percent target of available resources allocated to schools and classrooms by 2009-2010 (p. 61). It is difficult to conceive of any defense for Reason’s claims.

=====

Link to complete review: http://www.epicpolicy.org/files/TTR-Baker-Reason-WSF.pdf

I’ve personally come to refer to this offense as the Ouchi Retroactive Causation effect, since the first time I encountered such an absurd argument was in the work of William Ouchi who made much the same analytic gaffe in reference to the success of reforms in Houston. Scott Thomas and I, in our report on Weighted Funding for Hawaii noted: “… most obviously problematic is the authors’ touting of Houston’s success in improving performance through its WSF and decentralized governance, based on performance data from 1999 to 2001, when the formula was implemented (first year of phase-in) in 2001-02” (Baker and Thomas, 2006, p. 9).

http://www.hawaiireporter.com/file.aspx?Guid=1e930a29-3017-40fc-b58c-cf1513149ce7

http://www.hcps.k12.hi.us/STATE/COMM/DOEPRESS.NSF/a1d7af052e94dd120a2561f7000a037c/36dfa2492b206d2c0a2571be000450fd/$FILE/WSF-Baker.Thomas-2-07.28.06.pdf

For a more thorough critique of the work of Ouchi on this topic, see my article with Doug Elmer in Educational Policy (vol. 23 no. 1, 2009)

Look… we all make errors of logic and errors of analysis. So too do relatively safe and conscientious drivers get into an occasional auto accident. However, if a driver drives 15 times in one week, and drives drunk 5 times, that driver should lose his/her license. Claiming retroactive causation 5 times in 15 cases in a report which then proposes “best practices” for schools is comparably irresponsible. Arguably, the first or second offense is bad enough.

If nothing else, the Reason Foundation and the Eli and Edythe Broad Foundation which provided support for the Weighted Student Formula Yearbook should evaluate carefully whether such haphazard and arguably reckless thinking really advances the public policy agenda in any productive way. Whatever good elements there may be in the attempts of these districts to improve educational opportunities for the children they serve are severely undermined by the Weighted Student Funding Yearbook.


[i] http://www.reason.org/news/show/1007460.html