Blog

Charter Averages Worse than Originally Estimated

Note: The information below is not a comprehensive research study on the relative effectiveness of New Jersey Charter Schools. Rather, it is a quick summary of average proficiency rates for charters compared to other New Jersey schools by socio-economic strata. Unfortunately, New Jersey Charter schools were not part of two major recent multi-state analyses of charter school effectiveness, which can be found here, along with reviews & critiques of those studies. http://www.epicpolicy.org/think-tank/reviews These studies also found mixed results, with charters in some states slightly outperforming their public school counterparts, in other states performing comparably and in others performing less well. I have put together this post merely to stimulate conversation on how NJ charter schools are doing and perhaps encourage additional more thorough research.

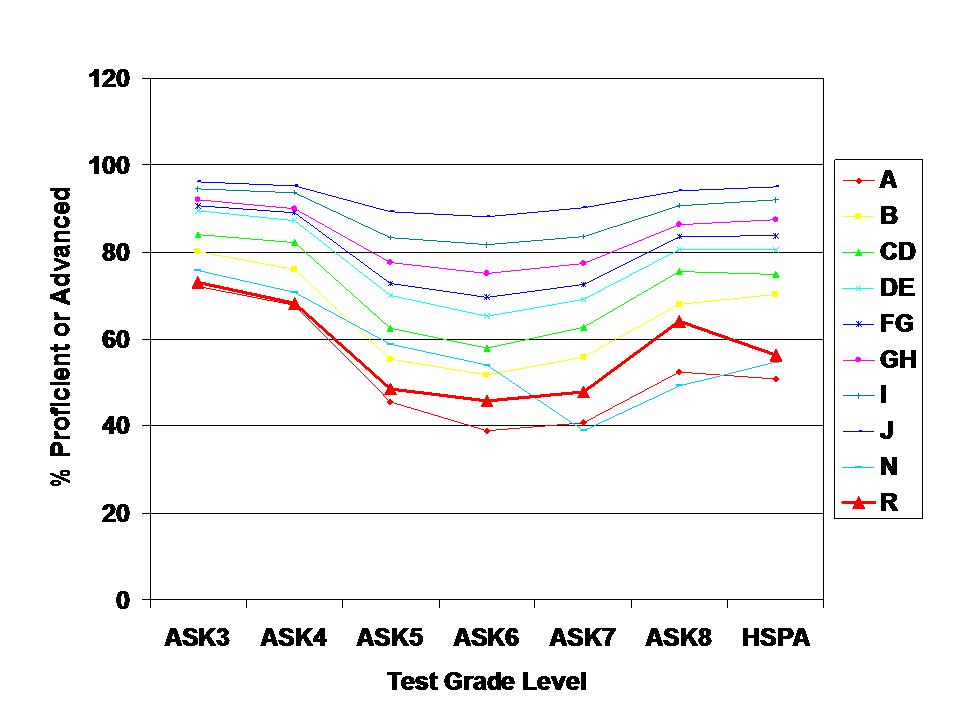
In my original post on NJ Charter School performance, Charter schools appeared to be performing somewhere between performance levels of DFG A and DFG B traditional publics. Here’s one of the graphs to that effect.
% Proficient for All Tested Students

Note that the charter line – R – falls between the DFG A (poorest traditional publics) and DFG B lines. But, this analysis includes all tested students. While I expected that children with disabilties were underrepresented in Charter schools, I had no idea just how under represented until I took a look, here: https://schoolfinance101.com/wp-content/uploads/2009/11/charter-special-ed.jpg

For example, Robert Treat Academy has 3.8% and North Star Academy 7.8% children with disabilities in a district that has 18.1% in 2007. These are higher than many, which actually serve 0%.

So, correcting for this problem by looking only at General Education students, the graph above becomes the graph below:

updated charter rel performance

In this graph, the Charter line maps almost precisely with that of the DFG A line. That is, the slightly higher performance in the first graph is almost entirely a function of the fact that NJ Charters simply don’t serve children with disabilities and don’t have them in their test taking pool. My apologies for this apparently glaring omission.

The biggest change to my analysis however is in the relative probability that a student attends a tested grade level where less than 40% of students are proficient or higher. Making the above correction, leads to the finding that a child in a charter school is 35% more likely than a student in a DFG A traditional school to be in a tested grade level where fewer than 40% of general education students scored proficient or higher.

Here’s the logistic regression, weighted for number of test takers in grade level and on test (general education only), based on the 2008 report card data:

Logistic Regression of Low Performance Grade Level (<40% prof. or adv.)

DFG A is the baseline comparison group. An odds ratio of greater than 1.0 indicates a greater likelihood of being in a grade level with fewer than 40% proficient or advanced than in a traditional DFG A school. Only charters have a greater likelihood – and much greater – 36% greater. Likelihoods vary dramatically for the different tests and subject areas. Apparently, 6th grade tests have cut scores aligned such that many more students do poorly on them. I don’t think that it’s just that 6th graders get dumb for  a year. Newer tests take some tweaking. Note the dip in previous graphs. Note also that in affluent communities (GH through J), there is statistically no chance of being in a low performing grade level.

Here’s a link to the School Reports 2008 Data:

http://education.state.nj.us/rc/rc08/database/nj_rc08.xls

Please – take your own stab at this. I’ve been running these quickly. My Stata data are here.

New Update: Here’s my last shot at it for now. I’ve got the odds for charters down to about 25% greater chance than DFG A schools of being in a grade level where fewer than 40% were proficient or higher. Unfortunately, poverty rates among test takers were only calculable at the district level (and for charters) not school and charters with these data (must use the enrollment data for whole school for that). Also, NJDOE continues the habit of not identifying specific locations of charters in their coding system by county. I have a bridge file somewhere, constructed by zip code, but for charters through 2006. May revisit. Anyway, here’s the logistic regression:

updated logit

Ah the perils of goofing around with data too quickly/on the fly. Fun though.

NJ School Funding Suburban Taxpayer Scam?

I hate wasting so much time countering completely absurd claims, like those that spill out on the E3 Cartel commercials. This is a short reply this time. At the end of one of the commercials, the spokesperson slips in the claim that not only are we wasting a ton of money on our low graduation rates in poor urban schools (I discuss this claim here: https://schoolfinance101.wordpress.com/2009/10/31/cartel-recap/), but this whole inefficient mess is a “suburban taxpayer scam.” Yep, suburbanites (like myself) are being dreadfully over-taxed and our hard earned money is being thrown down the rat-hole. We don’t get any of it back.

A simple question to answer here is whether the property tax effort in suburban communities (however we are supposed to define suburban?)  is that much greater than in “urban” communities. An appropriate way to measure this is by calculating the percent of income paid in property taxes.

Here’s a quick snapshot of tax effort in Essex County by income level and in Monmouth county by income level. These data are taken from http://www.nj.com/news/bythenumbers/, and the data are generally from 2005. Most “Abbott” funding to school districts had scaled up between 1998 and 2005.

Essex Tax Effort

Hmmm… no systematic pattern here. Yep, some pretty big differences, but no systematic pattern between poorer and wealthier communities.

Monmouth Tax Effort

As it turns out, tax effort in Monmouth declines systematically as homeowner income increases. Perhaps this is the “urban tax scam” not suburban one?

Yes, the property tax bill in an affluent suburban community is larger – because it is the tax bill on a more expensive home!  (should I really have to say that?) Yes, low property value, low income communities receive higher rates of state subsidy through the state aid formula for schools. That’s generally how aid equalization formulas work. And yes, New Jersey’s aid is targeted to higher need districts, above and beyond typical equalization (but only since 1998-2003).

Let’s get this straight. If the idea of the funding formula was to send back to communities and school districts exactly the amount submitted to state coffers from residents of those communities – then why the heck would we be collecting it to begin with? This would be a particularly foolish exercise since it costs money to process the tax revenues and send them back. That’s how taxes work – whether collected at the municipal level, providing benefit to the people across the street whose house may be valued (taxable value) less than yours, and tax bill may be proportionately less, or across the state. For those who don’t quite understand this, I recommend the Schoolhouse Rock tune about the Taxman. Pretty good stuff!

In a previous post, I also explain how local media in NJ has distorted comparisons of New Jersey property taxes with other states – https://schoolfinance101.wordpress.com/2009/10/03/should-nj-really-try-to-be-like-de-md-mo-ga-wa/

NJ Charters & Disability Rates

Here’s a quick snapshot of the percent of children classified as having disabilities in Charter schools and in Traditional Public Schools in Essex County. These figures add some context to the spending deficit figures in my previous post. Yes, Charters receive a reduced operating aid subsidy. Charters are most disadvantaged financially by not receiving support for facilities, and having to draw on operating funds for facility leases, or receive substantial private support. But, this piece – special education populations- cuts the other way. Traditional public school districts have about 14% to 18% children with disabilities, which typically run about 90% to 110% above “average” expenditure (to provide typical – not necessarily adequate or great – special education services). For example, if 16% of children qualified as disabled and required additional per pupil expenditure of 100% each, these students would add 16% total cost onto district operating costs – or $1,920 over $12,000 for an average per pupil cost of $13,920. That is – just to provide average/typical special education services – the per pupil cost in a district with 16% special ed would be 16% above the per pupil cost of a district with 0% special ed. In other words, if a district with 16% special ed spends $13,920 and another with 0% special ed spends $12,000, those spending figures are comparable – not vastly different.

Here are the special ed rates among Essex county districts and charters:

https://schoolfinance101.com/wp-content/uploads/2009/11/charter-special-ed.jpg

Note: A knowledgeable reader has informed me that the “0” value for Greater Newark Charter is actually “missing data,” for that year and has assured me that Greater Newark Charter does indeed enroll children with disabilities. At some point, I may get around to updating these analyses. Other “0” values may also represent missing data. But, very low, actual reported rates likely do not.

Charter School Special Education Classification

A Must Read – Mapping State Proficiency Standards

Call me crazy, but I’d have to say that one of my favorite publications of all time is a National Center for Education Statistics report mapping state standards onto NAEP, allowing comparison of where state proficiency benchmarks align with NAEP scores. I’ve likely provided links to that report more than a few times in my blog. Well, they’ve done it again. The new MAPPING STATE PROFICIENCY STANDARDS report is out, and you can find it here:

http://nces.ed.gov/nationsreportcard/pubs/studies/2010456.asp

Connecting some Teacher Quality, Leadership & Ed School Dots

A frequent, but much debated conclusion from teacher quality research is that teachers’ own academic ability, measured by test scores or even more bluntly the “competitiveness” of the colleges teachers attended as undergraduates, is associated with student outcomes. This occurs even when we use such crude classifications as the Barrons Guide rating system. In recent, exceptionally methodologically strong piece, Boyd, Lankford, Loeb and Wyckoff found:

“Furthermore, almost half of the teachers in the most effective quintile (based on student outcomes) graduated from a college ranked competitive or higher by Barron’s, compared to only ten percent of the teachers in the least effective quintile.”(p. 23)

http://www.teacherpolicyresearch.org/portals/1/pdfs/Matching_of_Public_School_Teachers_to_Jobs.pdf

Okay, for some this may hurt, and smacks of elitism. But nonetheless, it is a strong and relatively consistent finding which we should likely give some attention.

This finding is highly relevant to Arne Duncan’s talk yesterday at Teachers College, Columbia University where he took aim at the role of university based preparation programs in Education. Notably, Duncan referred to related work by these very authors, but did not mention this finding. In an effort to be egalitarian, Duncan promoted the virtues of institutions like Teachers College but also those like Emporia State in Kansas.

As I noted in my previous post, one thing we know is that the majority of teachers come through relatively non-competitive undergraduate colleges (on a 6 point rating system, from non-competitive, less competitive, competitive, very competitive, highly competitive, most competitive). On average, public school teachers come from the less competitive and competitive categories (about 2/3 of all teachers in these two categories alone) far more so than the highly and most competitive (about 6.5%). So too do most college students generally. That’s just the way the higher education system is distributed.

Teachers also come in large numbers – 42% – from 1994 carnegie classification – Comprehensive I – colleges and increasingly from less selective liberal arts colleges (carnegie 1994 Liberal Arts II colleges). And these Carnegie classifications from 1994 are somewhat associated with Barrons ratings. In short, the system of teacher education, nationwide, is not set up to produce large numbers of teachers who have the attributes that authors above find to be associated with higher student outcomes. A teacher preparation or administrator preparation program is only as good as its students.

Other authors have argued that the dominance of non-selective colleges in preparing teachers and higher costs of pursing teaching through more selective colleges creates a disincentive for academically strong high school students to pursue teaching. Add this to relatively low salaries, and the problem is exacerbated. Perhaps its the PIPELINE and system as a whole and not so much the individual institutions and prep programs that need reforming. Perhaps we need some incentives to encourage academically talented students to pursue teaching and some incentives to encourage the “highly and most competitive colleges” to get in the game of teacher preparation. At the same time, we may need to make some tough policy decisions about academically weak undergraduate and graduate institutions which have increased their role over time.

An interesting twist related to teacher academic preparation is that principals with stronger academic backgrounds seem more likely to recruit and retain teachers with stronger academic backgrounds (http://eaq.sagepub.com/cgi/content/abstract/41/3/449) So, we’ve got to find some way to get stronger principals into schools where they are needed most, and make sure there is a supply of stronger teachers produced through a better pipeline, from which those principals can build strong teams.

One problem here is that rather than becoming more concentrated in strong academic institutions over time, educational administration programs have become more distributed across more diverse… and quite honestly academically weaker institutions. For example, between 1993 and 2003, comprehensive colleges went from producing about 3% of education leadership doctorates to about 25% (http://eaq.sagepub.com/cgi/content/abstract/43/3/279).

So why does that matter? How does this finding relate in any way to the fact that principals with stronger academic backgrounds (measured crudely by Barrons ratings of undergrad colleges) are more likely to hire teachers with stronger backgrounds, and those teachers are shown to make a difference? Isn’t it likely that there exists no relationship between graduate preparation and undergraduate preparation, and that we should be unconcerned that comprehensive colleges are the ones producing the doctorates? Well, again the dots connect logically. As it turns out, we show in the same article above that about 22 to 25% of doctoral recipients from Top 20 ranked (US News, of all things) education schools and 13% to 15% of doctoral recipients at all Research Universities attended highly or most selective undergraduate colleges, compared to only 5% to 10% of doctoral recipients in comprehensive colleges.

Yes, these are relatively harsh and elitist realities. And yes, I am implying that having a strong academic background is likely an important attribute for someone who wishes to lead an educational institution. That seems to make sense.

In his speech yesterday, Arne Duncan invoked the usual comparison to medical training:

http://www.ed.gov/news/speeches/2009/10/10222009.html

The point, of course, was to emphasize the importance of clinical training. But, let us not forget that the medical model relies on two critical prerequisites to clinical training – 1) highly selective entrance criteria and 2) successful completion of rigorous undergraduate + 2 years of rigorous content upload of basic sciences and other relevant curriculum. Without academically strong candidates to begin with, the model fails. Without rigorous up-front information uploading, and students who can handle it, the model fails. The medical model is equally reliant on all of its parts, not just the clinical training.

Just connecting some dots here. Cheers.

Ed Schools as Cash Cows in the University

Secretary Duncan is again on the stump today, at Teachers College (where I attended) where he is expected to make the case that education schools are “cash cows” of the university, generating large sums of tuition revenue which are then diverted to other parts of the university.

http://www.ed.gov/news/speeches/2009/10/10222009.html

This proposition is hardly new, and appears to come from the pages of past TC president Arthur Levine in his report on ed schools a few years back.

http://elan.wallacefoundation.org/SiteCollectionDocuments/WF/ELAN/2007%20Second%20Half/EducatingSchoolLeaders.pdf

(this is the one on preparing school leaders. there was also one on teacher education)

At the time, my colleagues and I were intrigued by a number of the assertions being made and engaged in a series of research projects trying to untangle the “realities”, but actually did not explore specifically the cash cow notion. But, our research from that time does have a few facts to offer with respect to the cash cow argument, as well as important general context issues.

First of all, who is producing the teachers, and administrators? One implication of the current rhetoric is that major universities like state flagship universities and major private universities which offer a diverse array of programs, undergraduate and graduate majors are also producing large shares of all teachers. As it turns out, the major research universities actually produced about 13% to 15% of teachers who were working in public schools in 2003-04 and 2007-08. 42% of public school teachers received their undergraduate training at regional comprehensive colleges, many of which were the former “normal schools” or “teachers colleges.” In many of these schools, education majors are the dominant major, perhaps helping to sustain the institutions, but with a minority of other program areas to draw on education tuition dollars – except by the role that liberal arts and science departments play in providing undergraduate credit hours to teachers in their content areas. But, this is revenue received for credits delivered – not a redistribution of profit margin, per se.

The role of education schools in major research universities is potentially more interesting, but again, ed schools in research universities produce a relatively small share of all teachers and that share appears to be declining. The same is true of graduate degrees in educational administration. In the early 1990s, regional comprehensive colleges produced about 3% of doctorates in educational administration, and now produce about 25% or more (as of 2003). That is, graduate degrees in educational administration are being increasingly produced by institutions whose primary goal is to produce educators and education related professionals. So, from these perspectives, it’s getting harder to see how ed schools or programs are substantially subsidizing other schools or programs within universities, when increasingly, the production of educators and educational leaders is being concentrated in schools focused on education.

I’m unsure whether there’s other evidence to contradict this pattern. I’ve not studied it for a few years. There is some evidence that small cash strapped formerly undergrad only liberal arts colleges have expanded delivery of online certificate programs including administrative masters degrees, but they are hardly a major producer yet. In fact, they’ve expanded production in areas such as MBAs even more so than teacher and administrator education.

Now, on to the basic premise laid out by Levine and echoed now by Duncan, that ed school tuition dollars subsidize the rest of the university. This could be the case if tuition was constant for a credit hour across all students in all units in the university and if the average cost of providing a credit hour to undergrads was lower for education students than for other students in the university. One might imagine this to be the case, if we assume that education faculty are simply less well paid, for example, than engineering, business or economics faculty and that ed school classes are large. Actually, the bigger driver of cost per credit hour produced is the class size piece.

A few years back Chris Morphew and I did an analysis of data from the National Survey of Postsecondary Faculty, estimating wage models and models of “cost per credit hour” by field in which those credit hours were delivered. We accounted for relative salary of similar rank faculty, share of salary to teaching and class sizes of average undergrad load of teaching faculty. We actually found that ed school credit hour costs were about average, comparable to business for that matter. While b-school salaries were higher, ed school class sizes were smaller, on average across the full range of undergrad courses. Next, we linked our credit hour cost estimates to course taking data on students in different majors to come up with estimates of the relative cost of producing and ed major versus an econ major, etc. based on the full mix of courses students take across units in a university and the relative price of those units. Again, cost of producing an ed major was relatively average – not low.

Now, there are factors we could not and did not consider with our limited data – including shares of undergrad credits delivered by teaching assistants  and whether this rate is significantly higher, or lower for ed schools. We also were unable to generate estimates of other “overhead” costs such as equipment that might be necessary in engineering or sciences, but this would hardly seem to compromise comparisons between ed schools and other areas such as social sciences that would seemingly have comparable non-faculty expenses.

That said, I’d be curious as to what other evidence is now out there to support, or refute this assertion that Duncan is now making. Here’s my preliminary reading list for anyone interested:
Morphew, C., Baker, B.D. (2007) On the Utility of National Data for Estimating Generalizable Price and Cost Indices in Higher Education. Journal of Education Finance 33 (1) 20-49

Baker, B.D, Orr, M.T., Young, M.D. (2007) Academic Drift, Institutional Production and Professional Distribution of Graduate Degrees in Educational Administration. Educational Administration Quarterly 43 (3)  279-318

Baker, B.D., Wolf-Wendel, L.E., Twombly, S.B. (2007) Exploring the Faculty Pipeline in Educational Administration: Evidence from the Survey of Earned Doctorates 1990 to 2000. Educational Administration Quarterly 43 (2) 189-220

Wolf-Wendel, L, Baker, B.D., Twombly, S., Tollefson, N., & Mahlios, M.  (2006) Who’s Teaching the Teachers? Evidence from the National Survey of Postsecondary Faculty and Survey of Earned Doctorates.  American Journal of Education 112 (2) 273-300

A few quick NJ Charter School Facts & Figures

AFTER READING THIS, PLEASE SEE CORRECTIONS AT: https://schoolfinance101.wordpress.com/2009/11/04/charter-averages-worse-than-originally-estimated/

If one watches the trailer clips from the Cartel movie on two highly successful New Jersey charter schools, one might be misled to believe that Charter schools are simply uniformly freakin’ awesome. They can do no wrong. They are clearly the answer to all of our problems in urban schooling in New Jersey.  Indeed there is some, if not much solid empirical research literature out there which finds favorable results for charter schools and much which finds that charters on average, are pretty much a break even option.

For an exceptional review of charter school research, I would recommend Robert Bifulco and Katrina Bulkley’s chapter on Charter Schools in the Handbook of Research on Education Finance and Policy. Neither of these scholars are charter school naysayers, yet they conclude:

Research to date provides little evidence that the benefits envisioned in the original conceptions of charter schools – organizational and educational innovation, improved student achievement, and enhanced efficiency – have materialized.”

I am also not a Charter school naysayer, having written in my own previous work that leaders of charter schools seem more likely to recruit or select teachers with stronger academic credentials than traditional public schools in the same state. But, I’m also a realist when I look at data on charter schools, their students and their outcomes.

For starters, let’s look at how New Jersey charter schools begin with a public subsidy disadvantage – which may explain some of the mixed results that follow. Current expenditures from NJDOE annual financial reports through 2005, show charters spending less than many districts, organized by factor group (A being generally poor urban districts, through I & J, being relatively affluent suburbs).

Per Pupil Spending by DFG

In many parts of the country, Charter schools make up for this difference with private fund raising. In fact, most infrastructure costs are covered by such fund raising especially where states fail to provide any facilities support to charter schools. A few years back, I was able to compile the tax returns of the non-profits that support Washington DC charters to show that they received, on average, 14% of their revenue through private contributions. I ran an extract the other day of New Jersey Charter school IRS 990 forms, but few reported their data. Still working on that.

Now, on to the raw outcomes of charter schools in New Jersey based on 2008 assessments. Again, based on the cherry picking in the Cartel movie, one would think that all charters in NJ are kicking butt like North Star Academy. However, prior Charter research and the logic of deregulation lead to more realistic assumptions that – some do well – some not so well – and on average, there may be little difference (if the system, either the “market” or the accountability system, does not shut down those who do not do well). Under less regulation one would simply expect more dispersion. Higher highs perhaps, but also lower lows.

Here’s a quick run down. I begin with the “averages” by grade level and by district factor group. Here’s the % proficient or advanced by DFG, with Charters labeled “R.”

Charters labeled "R"

Charter schools, most though not all of which serve relatively poor student populations, hang right down there, across grade levels with DFG A and B poor schools – especially at both the beginning and end grades. Charters look little different when viewing only those who score advanced and higher.

% Advanced 2008

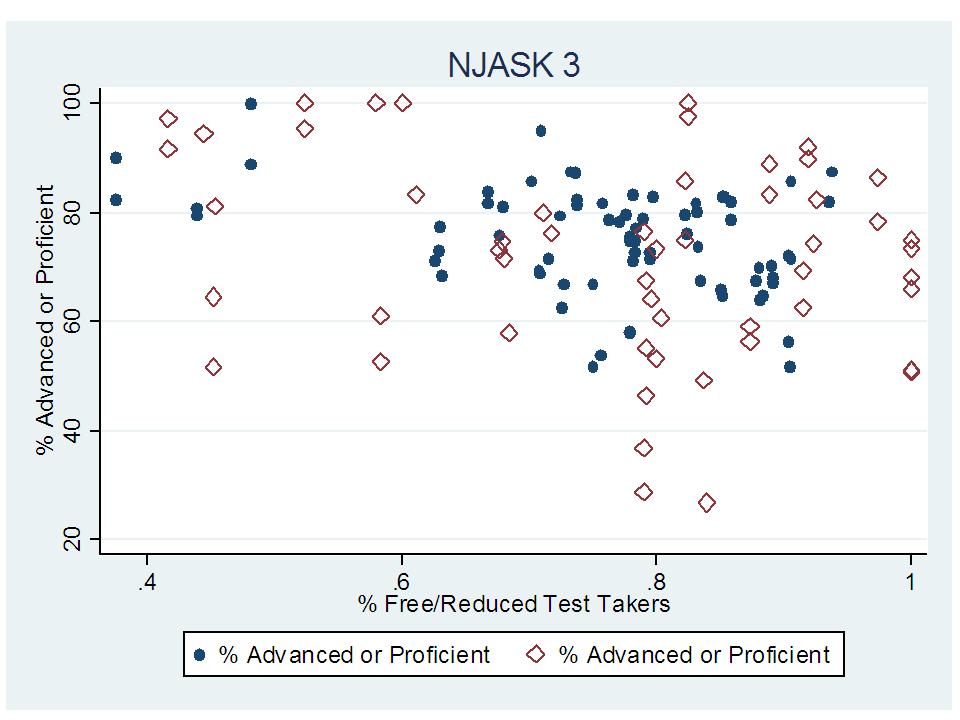
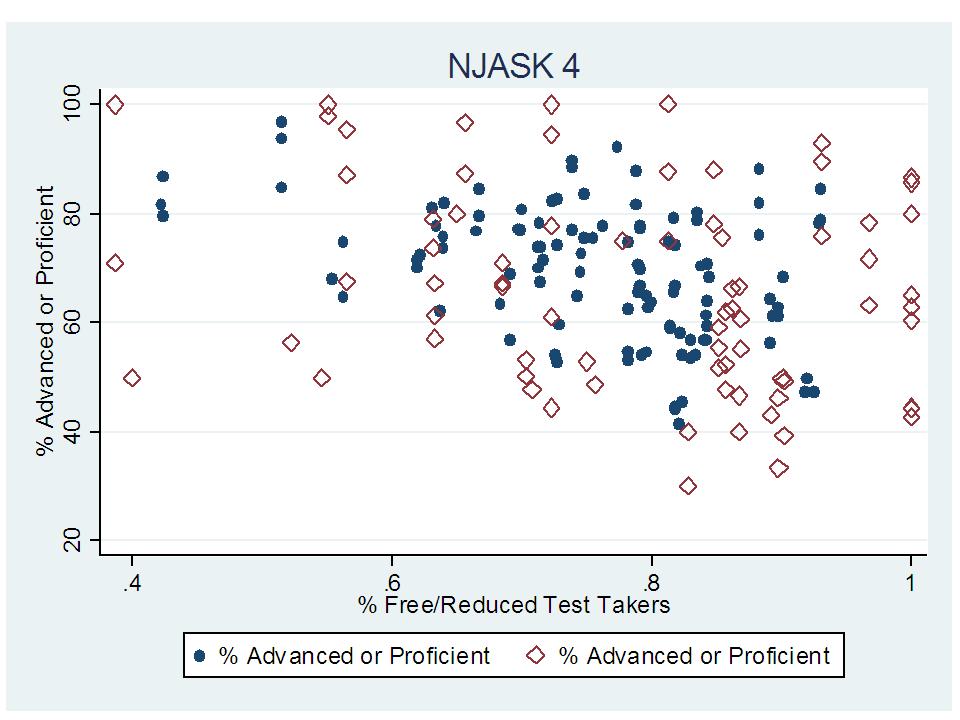
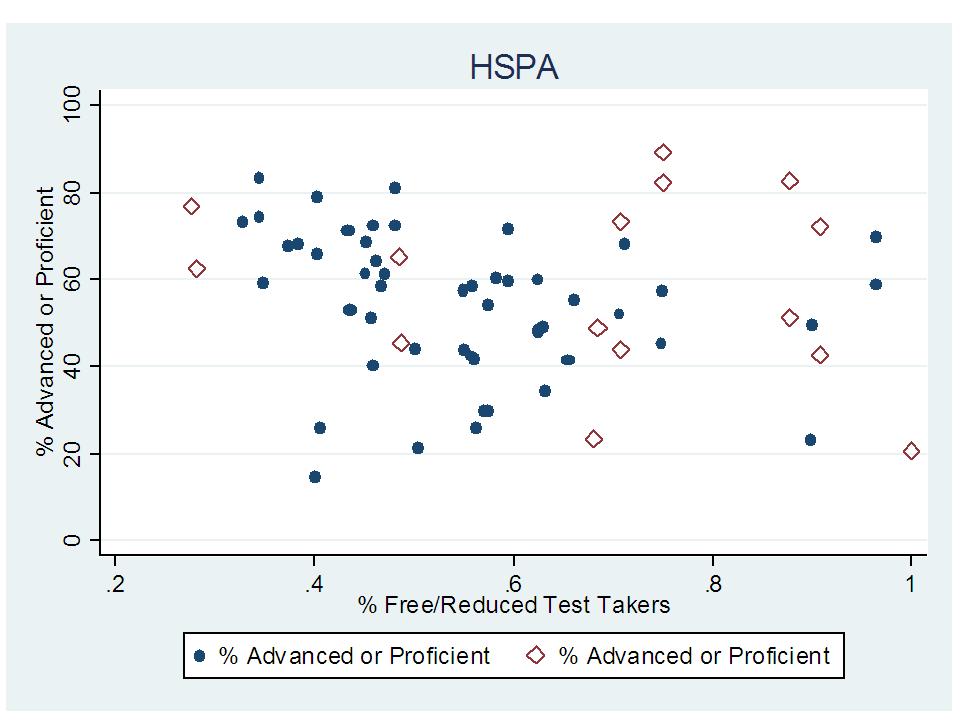
Okay, so these are the averages which conceal the really fun and interesting variations and drag down the superstars. Here’s the 3rd grade assessment data for two groups of schools – those in District Factor Group A and Charters. Schools are sorted by poverty. DFG A – Poor traditional publics are Blue Cirlces and Charters are hollow red diamonds.

Red Diamonds are Charters, other are DFG A (Poor)
Red Diamonds are Charters, Others are DFG A (poor)
Red Diamonds are Charters

In each case above, the schools are sorted by poverty along the horizontal axis and by proficiency rates on the vertical axis. In each case above, charters are represented by the red diamonds and traditional public schools including only those schools in the poorest district factor groups are represented as blue circles.

The bottom line is that Charter school performance varies widely and varies as widely as traditional public school performance in poor districts. What we do not know yet, because of lack of data is whether the successful charter schools are, in part, successful due to their ability to raise substantial additional resources for their schools. It may be the case that the unsuccessful charters – those that do much less well than even the worst traditional publics are suffering from lack of resources.

Sadly, rather than address these real, substantive issues, organizations such as NJ E3 and individuals like Bob Bowdon have decided to pitch a load of baseless propaganda on public audiences that deserve better. In fact, by pitching this schlock that all charters can do no harm (just look at these 2 really awesome ones!), ignorant pundits like Bowdon are arguably compromising the market decisions of parents – leading them to believe that all charters must necessarily be better than all traditional publics. Market decisions must be based on good information regarding product quality. In this case, it would appear that at least some pundits are creating a new “market for lemons” (knowingly marketing bad charters) at the expense of parents and children for purely political gain (or to sell movie tickets and build reputation). This sales pitch may encourage parents to continue choosing low performing charters, sustaining those schools and holding down the charter average – making the case for charters harder to argue.

Recession & State Tax Revenues

Here’s a link to a new report on the effect of the economic downturn on state tax revenues. Particularly interesting is the table ranking overall budget impact across states on Page 20 (Table 12).

http://www.rockinst.org/pdf/government_finance/state_revenue_report/2009-10-15-SRR_77.pdf

More Cartel Garbage! Bowdon still vacuous!

See updated post on this topic: https://schoolfinance101.wordpress.com/2010/04/16/cartel-recap/

=========

Bob Bowdon is once again proving his numerical wizardry with ads for his schlockumentary The Cartel (which I refuse to see because I will likely blow my top in the middle of it, correcting every damn wrong and misguided supposed fact spewed in the film’s narration). There’s a commercial out for the Cartel Movie which lists about 2 or 3 supposed “facts” about New Jersey schools and how they compare to schools in other states – on funding and on graduation rates. 2 or 3 numbers in the commercial, and you’d think Bowdon could get at least one right… or interpret at least one in a way that is not completely misguided schlock. We’re not talkin’ any high level of manipulation here… but rather… at the same childish, buffoon-ish level as previous Bowdon brilliance (the claim that higher state spending lowers SAT scores… Yeah… you go Bob! Awesome. Cool. Freakin’ amazing! https://schoolfinance101.wordpress.com/2009/05/30/idiot-of-week-award-the-cartel-check-this-out/ )  Okay, so what am I complaining about this time?

The claim in the commercial goes… New Jersey is the highest spending state in the nation when it comes to schools… and, even though the NJDOE claims that we are tops in graduation rates, if you count only those kids who actually pass the high school graduation exam we’re really 24th. Yep, we spend all that (first, by a long shot, apparently) and all we can get is 24th in graduation rate.

First of all, graduation rates aren’t particularly a great statistic for comparing across states because graduation is highly dependent not only on varied state standards but varied local rigor. That is partly the (missed) point of the commercial. But the commercial goes on to imply that NJ is necessarily softer on grads than other states. Thus, we must correct those distorted NJ grad rates by the numbers who actually pass the state test… and then and only then… compare against all those rigorous states that really whoop NJ  %$$. Now, if we were going to “correct” New Jersey graduation rates to represent only those kids who can pass the NJ exam, the only legitimate way to compare against other states would be against the same standard – the ability of kids in other states to pass the NJ graduation test. Fun idea… but I don’t think other states are giving the NJ tests.

Hey… you know what… there is actually a report out there (by the gov’t agency charged with doing such analyses) that shows how states’ individual tests compare to specific cut points on the NAEP test (the one national standard assessment)… and thus to each other. But you’d have to do research… reading… actual numbers to find such a crazy thing. You wouldn’t want that kind of thing to taint the “facts” in a “documentary.” Here it is for future reference.

http://nces.ed.gov/pubsearch/pubsinfo.asp?pubid=2007482

This particular report shows the NAEP score that would be associated with scoring proficient or higher on each state’s tests. So, for NJ, a proficient student on 8th grade reading would be expected to score 250 on NAEP 8th grade reading (the national test). The standard was higher (NAEP score associated with proficiency on state test) in about 13 states, but a heck of a lot lower in many states (lower in 19). NJ’s position was similar for 8th grade math. So, the state assessments in NJ fall near the upper portion of the pack among states, though certainly not near the top. Sadly there is no direct comparison of which I am immediately aware for the HS tests.

But, in NJ and many other states, these tests really don’t mean a whole lot to individual children, whether the test is rigorous or not. Yes… if we wish for anyone to take these tests seriously and if they are good and rigorous tests, we should expect kids to pass them to graduate. And we should do what we can to compensate for inequities in the preparation of high school students to succeed on the tests. But this has little or no bearing on state-to-state comparisons of graduation rates and is no excuse for Bowdon’s contorted reasoning (putting a generous spin on it).

As I have pointed out in previous posts (https://schoolfinance101.wordpress.com/2009/06/17/vacuous_bowdon/) , when it comes to NAEP assessments, NJ students do very well, in spite of, or perhaps in part because of our funding levels and distribution of that funding. NAEP is the tool we have for making state by state comparisons, of students on average and by subgroups. Also in my previous post (above), I show how New Jersey compares with countries based on an analysis linking NAEP and international assessment scores.

Here’s a tool for comparing state NAEP scores.  Have fun! http://www.nces.ed.gov/nationsreportcard/statecomparisons/

Other groups produce indices such as “college readiness” indices, and NJ does very well on these (http://www.edequality.com/content/map/ ), though I’m not fully confident in the rigor of such reports and measures.

Oh… and on that funding thing, when comparing total state and local revenues per pupil by state, without any adjustment for regional cost variation or other factors, NJ actually falls behind NY and VT, and barely ahead of WY based on my own run of the district level Census Fiscal Survey for 2006-07 (most recent year: http://www.census.gov/govs/www/school07doc.html ). After cost adjustment NJ drops lower (cost adj. here: http://www.nces.ed.gov/edfin/adjustments.asp ). So, even using the “bad” version (unadjusted) of the numbers, NJ is not #1. NJ was #1 in Current Expenditures per Pupil (including expenditure of federal dollars) in 2005 with no adjustments for regional cost variation, but fell behind Vermont and Wyoming and in a dead heat with New York and Maine in that year when cost adjustment is applied (the NCES Comparable Wage Index).

The point is that NJ is not the undisputed, year-after-year #1 and does not stand out as this huge outlier on public school spending as Bowdon’s grossly distorted and completely a-contextual references would have one believe. NJ does indeed stand out as a state that has put substantial additional funds into large urban, high poverty districts as a function of years of litigation. But, most rigorous accounts (actual research, with real statistics) find positive effects of the infusion of resources on student outcomes (see: https://schoolfinance101.wordpress.com/2009/10/12/real-info-re-nj-and-abbott-districts/ as just one example)

Table 1 and Table 2 of this report on school finances provide some perspective on school funding from the most recent NCES summary of the most recent Census fiscal survey (http://nces.ed.gov/pubs2009/2009338.pdf).

Here are a few related resources which discuss dropout and graduation rates, based on reasonable (albeit still problematic) approaches for measuring such things and comparing across states.

NCES Freshman Graduation Rates

http://nces.ed.gov/programs/coe/2009/section3/table-scr-1.asp

Report on Dropout and Graduation Rates

http://nces.ed.gov/pubs2009/2009064.pdf

Yeah. I know I’m talking to the wall here. Don’t let data and reasonable analysis get in the way. That’s just too geeky. Wouldn’t want a good number or some relevant context to taint the message of a “documentary.”

Cheers!

Real Info. Re: NJ and Abbott Districts

Here’s a link to a solid, recent dissertation out of the University of Michigan regarding New Jersey’s Abbott School districts and the effects of Abbott litigation on overall outcomes and outcome gaps.

http://deepblue.lib.umich.edu/bitstream/2027.42/61592/1/aresch_1.pdf

Here are some highlights quoted from the Intro of the dissertation:

The first essay is an empirical analysis of the e ffects of the Abbott school finance reform on educational expenditures in New Jersey. This reform dramatically increased the funding available to poor, urban schools with the goal of improving achievement in those districts. My analysis suggests that districts directed the added resources largely to instructional personnel. They hired additional teachers and support sta ff.

The second essay asks the obvious next question: Did this increase in funding and spending improve the achievement of students in the a ffected school districts? I focus primarily on the statewide 11th grade assessment that is the only test that spans the policy change. I find that the policy improves test scores for minority students in the aff ected districts by one- fifth to one-quarter of a standard deviation.

Resch’s third essay (following the common 3 essay structure of econ dissertations) is on higher education.

Resch’s analysis is not entirely uncritical of Abbott reforms. Resch expresses concerns that emphasis in later rounds of Abbott on early grades reforms may have diverted resources to early grades education at the expense of upper grades (where early gains had been shown – see above). Resch also questions whether the approach to financing Abbott’s was sustainable, but notes that SFRA introduces significant structural changes to school funding in NJ (I could go on about this part, but not now). Resch is most critical of the state’s own lack of efforts to generate and maintain data useful for evaluating the effects of reforms – either prior Abbott reforms or SFRA.

In any case, if you happen to be trying to decide whether to spend an hour or two with a sound analysis of actual data treated with reasonable rigor, or whether to go see the Cartel Movie filled with misguided and intellectually sloppy assumptions, misleading if not outright fabricated numbers, I would recommend the econ dissertation. Yeah… it’s not as sexy – doesn’t have the slick production – and won’t be in a theater near you. But you can just click and download above, and actually get some decent real numbers and analyses. Cheers.

If you do read my previous posts regarding the Cartel, please see all 3, along with the original materials that prompted me to post (http://www.njecea.org/cartel/?page_id=10)

Post 1: https://schoolfinance101.wordpress.com/2009/05/30/idiot-of-week-award-the-cartel-check-this-out/

Post 2: https://schoolfinance101.wordpress.com/2009/06/02/i-just-cant-let-go-of-this-one/

Post 3: https://schoolfinance101.wordpress.com/2009/06/17/vacuous_bowdon/

Note also that if you disagree with my framing of the film’s objectives, please see the “crisis” page here, where the movie is framed largely as I have framed it.