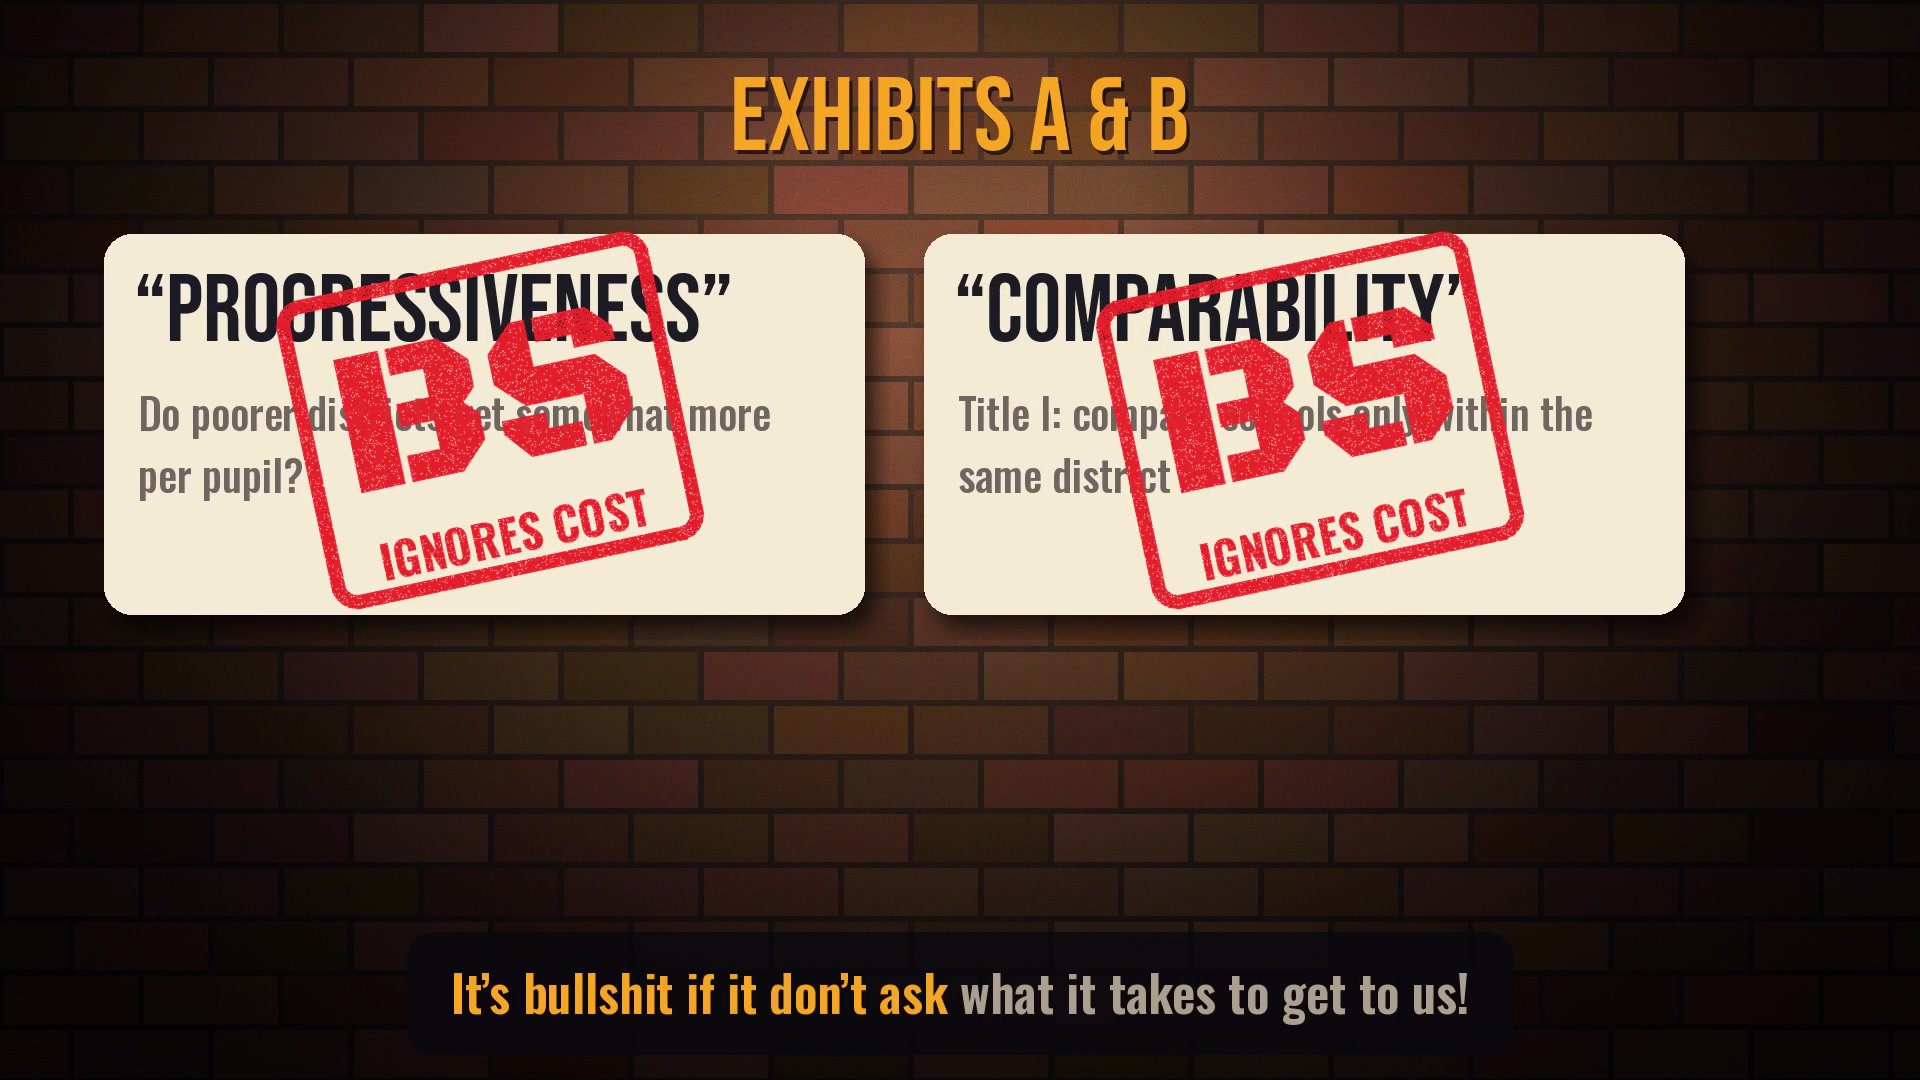
Every few months somebody walks into a hearing room with a chart showing that high-poverty districts get more money per pupil than low-poverty ones, and declares the school funding problem mostly solved. Dan Losen and I have a new EdWorkingPaper explaining why that chart is, technically speaking, BS. It’s the kind of argument that sounds like a methods footnote, so this time I set it to a 12-bar Chicago shuffle. The short version: a dollar ain’t a dollar when the need ain’t spread the same.
Why Cost Matters (a school finance blues)
The receipts
Every number in the video comes from the paper or from our companion work on school practices. Here they are, verse by verse.
Verse 1: The chart they brought
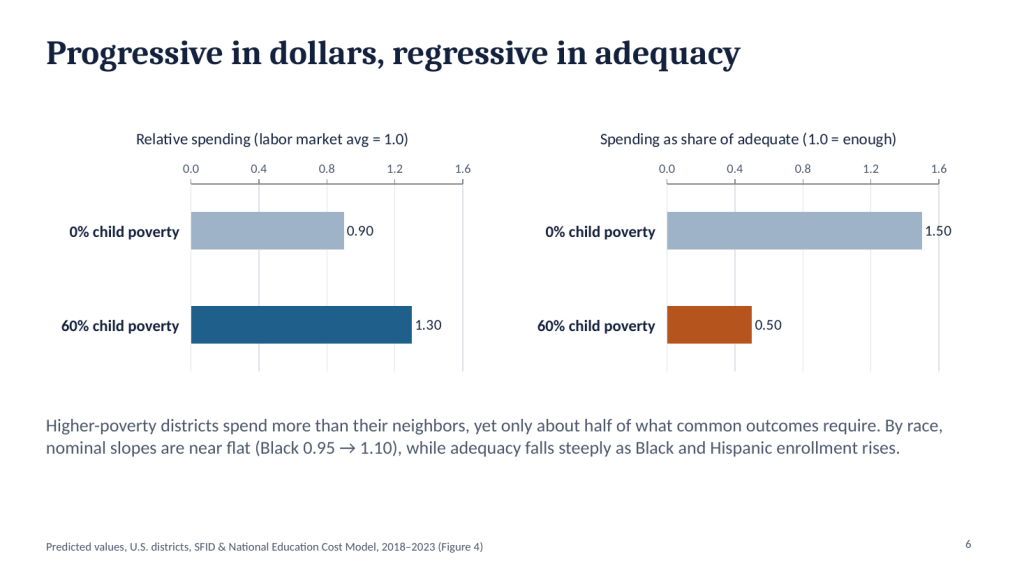
| District type | Relative spending (labor-market avg = 1.0) | Spending as share of adequate (1.0 = enough) |
|---|---|---|
| 0% child poverty | 0.90 | 1.50 |
| 60% child poverty | 1.30 | ≈0.50 |
- On the “progressiveness” yardstick, the 60 percent poverty district spends about 30 percent more than its labor-market neighbors. Looks great.
- Measured against what it actually costs to get kids to common outcomes, that same district spends about half of what it needs, while the zero-poverty district runs about 50 percent above.
- If the nominal slope were progressive enough, the adequacy slope would be flat. It isn’t. It’s steeply regressive, and it gets steeper as Black and Hispanic enrollment rises, even though nominal spending by race is close to flat.
Verse 2: A dollar ain’t a dollar
Cost models ask how spending varies with student needs, labor costs and scale while holding outcomes constant. That’s the whole trick, and it’s an old one: Duncombe and Yinger laid it out in 1999. In very high-poverty settings, the cost of reaching the same outcomes can be double that of low-poverty settings, and racial isolation adds more on top. A spending comparison that doesn’t price in the finish line can’t tell you whether anybody gets there.
Verse 3: Which yardstick predicts outcomes?
- Relative spending explains about 5 percent of the variation in district outcomes, and the sign runs the wrong way: higher-spending districts score lower. That’s the chart people use to argue money doesn’t matter.
- Spending adequacy explains about 40 percent, with the sign you’d expect.
- 85 percent of majority Black and Hispanic districts are both underfunded and below U.S. average outcomes. For majority white districts, it’s 6 percent.
- Nationally, Black students are about twice as likely as white students to attend districts funded below adequate levels, and about three times as likely to attend chronically underfunded ones.
Verse 4: Looking in the wrong place
Title I comparability looks within districts. But in the Northeast, about 91 percent of the Black–white gap (and 97 percent of the Hispanic–white gap) lies between districts (Bifulco & Souders, 2024). And in some cities there’s nothing left to redistribute:
| District | All students | Black students | Hispanic students |
|---|---|---|---|
| Syracuse, NY | 93% | 94% | 96% |
| Buffalo, NY | 88% | 90% | 91% |
| Rochester, NY | 85% | 85% | 87% |
| Mt. Vernon, NY | 81% | 82% | 81% |
| New York City | 73% | 88% | 83% |
| Paterson, NJ | 60% | 69% | 61% |
| Newburgh, NY | 58% | 59% | 60% |
| Newark, NJ | 35% | 41% | 32% |
| Jersey City, NJ | 11% | 15% | 13% |
You can shuffle every dollar in Syracuse and still no school’s doing fine. That’s the state’s bill, not the district’s.
The bridge: what underfunding does inside schools
These numbers come from a companion analysis with Dan Losen and Ramon Flores (in progress), linking cost-adjusted adequacy to the Civil Rights Data Collection (2017–18 and 2021–22).
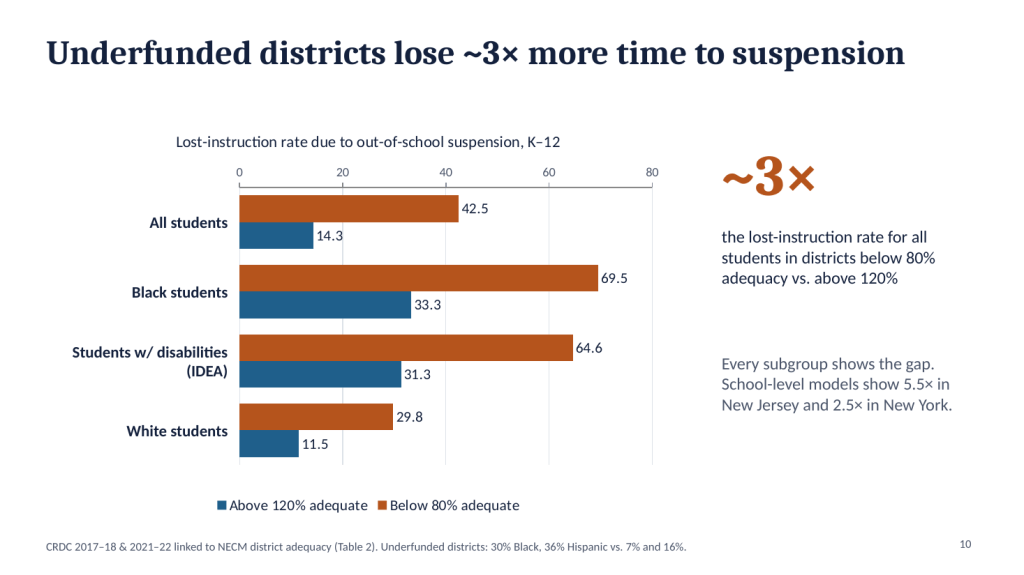
- Districts below 80 percent of adequate funding have a lost-instruction rate due to suspension of about 42.5, versus 14.3 in districts above 120 percent. Three to one.
- AP math enrollment runs about 3.7 percent of high schoolers in underfunded districts versus 6.9 percent in well-funded ones. With school-level adequacy the gap is wider: 4.2 versus 10.3 percent in New York.
- But hold the money steady and the color gap’s still there: in districts with the same adequacy and demographics, Black students lose roughly 28 more days of instruction than white students and enroll in AP math at lower rates.
- So it takes both. The state owes the dollars. The district owes the keys: fair discipline and open doors to advanced coursework.
The slide deck
Here’s the 20-minute version, with the conceptual framework, research questions and all the numbers above.
The lyrics
Why Cost Matters (full lyrics)
Verse 1
They brought a chart to the hearing room, all bar lines climbing high,
Said “the poor kids get thirty percent more, so who are you to cry?”
Ninety cents on the dollar out in the leafy cul-de-sac,
A dollar thirty in the city, so they figured they were on track.
Verse 2
But a dollar ain’t a dollar when the need ain’t spread the same,
Kids who walk in hungry play a whole different game.
You can’t price the finish line by countin’ at the start.
Show me what it costs to get there, or I’ll tear your chart apart.
Chorus
‘Cause it’s cost, cost, that’s the only line that’s true,
Spending over what it takes, that’s the measure, not the view.
Your per-pupil progressiveness, your comparability fuss:
It’s bullshit if it don’t ask what it takes to get to us.
Verse 3
Now the suburbs run at one-fifty, half again of what they need,
While the sixty-percent-poverty district gets half, and that’s the deed.
Put relative spending on the axis: five percent, and the sign is wrong.
Put adequacy there instead: forty percent, it’s been there all along.
Verse 4
Title I says “look within,” so they audit school by school,
But ninety-one percent of the gap is between, and that’s the rule.
Up in Syracuse, ninety-three percent sit below the line.
You can shuffle every dollar there, and still no school’s doin’ fine.
Bridge
Stretch the teachers thin enough, the hallway turns to stone,
Forty-two days lost to suspension, kids sent walkin’ home.
Fund it right, it’s fourteen. Count it, that’s three to one.
And the AP calc room’s double full where the money’s really done.
But hold the money steady and the color gap’s still there,
Twenty-eight more days for Black kids. That ain’t the budget, that ain’t fair.
So fund the cost, then watch the door. It takes the both of these:
The state owes us the dollars; the district owes us the keys.
Final chorus
‘Cause it’s cost, cost, Duncombe and Yinger knew,
Ninety-nine was long ago, and still they’re comin’ through.
So take your nominal ratios and leave ’em on the bus.
It’s bullshit if it don’t ask what it takes to get to us.
(spoken) Spending divided by cost. That’s it. That’s the whole song.
Lyrics by me. Music made with Suno. The guy pointing at the BS is me, more or less. The rubber stamps are editorial. The numbers are not. Spending and adequacy figures are from Baker & Losen (2026); “up to double” refers to cost differences between very high- and low-poverty settings in the cost models; suspension and AP figures are from work in progress with Dan Losen and Ramon Flores and may be revised. These are associations, not proof that any one funding change causes any one result.
Read the real thing
- Baker, B. D., & Losen, D. J. (2026). Unpacking Racial Disparities in School Spending: Why “progressiveness” and “comparability” are not enough. EdWorkingPaper 26-1558, Annenberg Institute at Brown University. doi.org/10.26300/erbj-7k94
- School Finance Indicators Database (SFID) and the National Education Cost Model
- Baker, Di Carlo & Weber, The Adequacy and Fairness of State School Finance Systems
- Duncombe, W., & Yinger, J. (1999). Performance standards and educational cost indexes: You can’t have one without the other. In Equity and Adequacy in Education Finance. National Academy Press.
- Toward a Consensus Approach to Evaluating State School Finance Systems! (and dumping the others!)
- Incompatible Policy Preferences: Comparability & Expanded Choice
- Seventeen Years of Roza-Tinted Glasses
- Money Matters. And the Evidence Keeps Piling Up.
- New Report: Why most international comparisons of spending & outcomes are total BS! (a theme, apparently)


