Blog

Pennsylvania, Illinois and the Stimulus – What is Duncan thinking?

So… I read these two stories this past week as I get more deeply involved in understanding the impact of the stimulus funding for public schools, specifically, the general stabilization money  around which there seems to be increased controversy of late.

In the first story which appeared in many locations, here is one:

http://www.bloomberg.com/apps/news?pid=20601103&sid=aRx4YhYdDW3E

Duncan takes aim at Pennsylvania for not dipping into its rainy day fund to increase education spending – with stimulus included. Duncan sends a letter to the PA governor explaining that the state’s stabilization money might be jeopardized.

In this second story, Duncan appears to apologize to Illinois for previously being critical of their lack of movement on education funding and reform. For some reason, he now believes they’ve made progress.

Here’s my back story on these two states. I repeatedly run state-by-state analyses of the relative levels of spending and more importantly the progressiveness and regressiveness of state and local resources across school districts in states. Progressively funded systems are those that allocated systematically greater support to districts with greater measurable costs and student needs. Regressive states do the opposite.

Through 2006, Pennsylvania and Illinois have been the most regressively funded states in the country, with Philadelphia the least well funded (relative to low poverty surroundings) and Chicago second least well funded major city in the country. Okay… so PA was last and IL second to last. Arne’s critique makes sense? Well, no! Because PA actually adopted a new funding formula which will – if actually implemented over time – change the distribution of resources across PA districts quite significantly, and approporiately. The latest run I have of district by district state aid allotments for PA districts from the PDE web site indicates that the 2009-10 allotments move ever so slightly in the right direction over the 2008-09 allotments. These are March 2009 estimates (http://www.pdeinfo.state.pa.us/education_budget/lib/education_budget/BEF0910_Mar09_Web.xls)

Please… someone out there correct me if I’m wrong, but as far as I can tell, Illinois has done little or nothing to resolve the plight of Chicago Public Schools and perhaps even more importantly, the plight of many even poorer inner urban fringe districts around Chicago. Now that PA has taken some steps to move forward on school funding reform, IL is well positioned to be dead last on measures of “equal educational opportunity” as provided through funding. Is these really deserving of Duncan’s apologetic approach to his old stomping ground?

The article on Duncan’s apology to Illinois specifically goes further to say that Chicago should be able to pay differential wages to teachers in positions where the district is likely to be losing teachers to surrounding districts. Indeed this makes sense, but this problem is directly related to the fact that Chicago simply has less competitive overall resource levels than it’s more affluent neighbors which are also able to provide more desirable working conditions. Rhetoric about differential teacher pay – as a “progressive” strategy – distracts from the main point that Chicago Public Schools and surrounding poor inner urban fringe districts simply don’t have sufficient resources to compete with surrounding affluent suburbs.

Implying that Pennsylvania is a scofflaw for not using rainy day funds (while implementing significant reforms) and exonerating Illinois despite complete inaction on school funding reform – seems inconsistent at best.

I may be wrong… I’m shooting from the hip this morning without my hard drive of data archives.

WHAT MATTERS HERE IS THE ACTUAL TOTAL AMOUNT OF REVENUE PER PUPIL [FED, STATE, LOCAL] AVAILABLE IN EACH LOCAL SCHOOL DISTRICT AND SCHOOL… NOT WHERE THE MONEY COMES FROM AND NOT THE TOTAL – AGGREGATE – AMOUNT SPENT BY THE STATE.

I ASSURE YOU THAT THOSE IN THE TRENCHES AND THE CHILDREN THEY SERVE ARE MORE CONCERNED WITH THEIR LOCAL BUDGET AND THE EDUCATION IT CAN BUY, THAN WITH SOME 9 TO 10 FIGURE STATE BUDGET WHICH IS LARGELY A POLITICAL ABSTRACTION.

A STATE COULD MEET THIS REQUIREMENT OF INCREASING TOTAL FUNDING SIMPLY BY ALLOCATING LARGER SHARES TO AFFLUENT SUBURBS. A STATE COULD CREATE A LESS EQUAL, LESS FAIR SYSTEM, AND IT SEEMS THAT THAT WOULD BE OKAY? DRIVING THE STIMULUS MONEY THROUGH THE CURRENT GENERAL AID FORMULA IN MANY STATES DOES JUST THAT.

Update on PA here:

http://www.heraldstandard.com/site/news.cfm?newsid=20334428&BRD=2280&PAG=461&dept_id=480247&rfi=6

The Intellectually Vacuous Bob Bowdon’s “Cartel”

See updated post on this topic: https://schoolfinance101.wordpress.com/2010/04/16/cartel-recap/

===== Old post

Had a busy week, so I haven’t posted, but saw a new report yesterday which relates nicely back to the shallow logic of Bob Bowdon’s intellectually vacuous Cartel movie.

The Cartel movie is based on the premise that (a) public schools nationally are failing, (b) public schools in the US spend a ton of money to achieve little, (c) New Jersey is the perfect example of a state which spends a ton of money and fails. All of this, of course, occurs because of a self-interested, self-indulgent cartel of teachers unions and greedy bureaucrats (here’s how their salaries stack up to those “real world” “private sector” workers in NJ). I’ll avoid this latter piece for now, and take a closer look at the logic of points “a” through “c.”

Bowdon cherry picks some national average results from the PISA international assessment of 15 year old students to show that the US compared poorly on math in 2003 and worse in 2006. Of course, any national averages in the U.S. combine the performance of children in states that have largely thrown their public schooling system under the bus  – like Louisiana and Mississippi among others – with those that have done quite well like Massachusetts and New Jersey (indeed it is somewhat unfair to compare directly LA and MS to MA and NJ).

As I have shown in recent posts, there does exist at least some relationship between state aggregate spending (controlling for a variety of factors) and national assessment performance – albeit a relationship heavily entangled with socioeconomic conditions and adult population education levels in states.

Further, as I have also explained previously, an extensive body of research on the effects of school finance reforms including infusion of new resources into poor schools, shows significant positive effects.

A new study out this month from the American Institutes for Research seeks to make more appropriate statistical comparisons of student math performance on another international assessment – TIMSS (Trends in International Math and Science Study). The authors construct a statistical cross-walk between NAEP state assessment scores and TIMSS scores which can be used for international comparisons.  From this analysis, the authors are able to evaluate where individual states stack up against countries participating in TIMSS. This is important because of the variance in state level performance and differences in state policies, fiscal effort and students served.

For starters, on international comparisons, the US on average scored just below the mean for OECD (organization for economic cooperation and development) countries at the 4th and 8th grade level (we do lag from 4th to 8th, an issue of concern). At both 4th and 8th grade on math, the US average is well above the international mean for all TIMSS participants. Now, we may wish to do better – and should. AIR assigns grades to the score ranges for each country and points out that we don’t perform at the levels we should. But this is far from the absurd, apocalyptic (and simply irresponsibly misguided) view presented by Bowdon.

But wait, Bowdon’s premise is that states like New Jersey are the perfect example of inefficiency – spending so much yet producing these terrible national averages. Certainly, New Jersey can’t be blamed for the national average – which carries with it the baggage of states like Louisiana and Mississippi.

How does New Jersey compare to the OECD average? New Jersey ranks 3rd among states on 4th grade math with 25 states beating the OECD average performance. Not bad for Jersey, along with Massachusetts and Minnesota! Louisiana, Alabama, New Mexico, California and Mississippi carry up the bottom end of the rankings, falling below the OECD mean, but above the overall international mean. That is, even Mississippi and Louisiana beat the international mean.

New Jersey drops a little on 8th grade math (consistent with other NAEP based analyses of NJ), but still does well, coming in 6th among the 27 states which perform above the OECD mean. Again, even Louisiana and Mississippi exceed the international mean, but well below the OECD mean.

I am by no means arguing for complacency  – saying – hey – that’s good enough. Rather, my point here is to re-emphasize that the US has a wide variety of education systems in place across states – some which spend a great deal and in fact perform very well, even in international comparisons. New Jersey is among them. We also in this country have some states that have seriously neglected their education systems, spent little, and shifted large shares of (primarily upper class) children in private schooling (schools that spend more, not less than the public schools in those states) where their performance goes unmeasured in these international and even state by state comparisons (in fact, these may be the children who do well in those states, but we don’t know). WHAT THESE STATES HAVE DONE IS A NATIONAL CONCERN!

It is foolish stretch of logic to blame New Jersey’s high spending (and the Cartel that demanded it) for the poor national average performance on select international comparisons. Yes, New Jersey spends on education, and in fact, New Jersey does quite well with that spending compared to other states and on international comparisons.

Certainly, spending alone is not the solution. But little is added to the debate by producing bombastic, misguided, poorly conceived and irresponsible slick-production rhetoric posing as documentary.

NJ Teacher and Administrator Wages

I got curious this morning, and ended up spending more time than I wanted to on this quick and dirty analysis. You see… the whole premise of this Cartel movie is that the teacher unions in NJ are a mob cartel that has bullied the state into lining their (union members) pockets with high salaries, guaranteed annual increases, and all for no actual return in the quality of schooling. My slides in a previous post actually speak to the relative quality of NJ schooling in relation to NJ state and local revenues for schooling.

Anyway, this morning I ran a quick check on how elementary and secondary teacher and administrator wages stack up compared to other workers in NJ from 2000 to 2007. You’d think from all the rhetoric that they’ve run away from the pack. As in a much earlier post, I’ve taken data from the U.S. Census Integrated Public Use Micro Data System (Census 2000) and from the subsequent American Community Surveys. I’ve included only individuals with a BA or MA degree and between the ages of 23 and 65. I’ve computed relative “income from wages” from a regression model which controls for the Hours Worked per Week, Weeks Worked per Year, Age of Individual, whether they hold an MA or BA, race and gender (essentially comparing male wages to male wages, female to female, black to black, white to white… which, given gender wage gaps in many fields and the high percentage teachers who are female, potentially leads to overstating teacher relative wages).  Here’s what I got:

Slide33

Yep… teachers have fallen sligthly behind. Administrator estimates have jumped around average. The green line  is the average predicted income from wages for a worker of similar attributes (hours per week, weeks per year, age, sex, race, degree level) as the teacher or administrator. Personally, I’d expect a 40 year old school administrator to make more than “average” for any 40 year old worker with a masters degree working similar weeks and hours per year. But even that has not systematically been the case in NJ over the past several years. Nor have administrator wages grown systematically relative to other comparable workers. (note that by excluding professional degrees and doctorates, I’ve excluded doctors and lawyers, but have not excluded other managers, individuals with MBAs, or architects and engineers).

Idiot of the Week (year) Award… The Cartel… Check this out!

See updated post on this topic: https://schoolfinance101.wordpress.com/2010/04/16/cartel-recap/

====

Okay… so I’m curious about The Cartel movie that documents the failures of New Jersey’s public education system… and the high costs of those failures. One might construct a reasonable statistical case for some of the problems facing New Jersey schools… but not documentary filmmaker Bob Bowdon in “The Cartel.” I’ve not seen it yet…. but their page on Facts and Figures here, includes some of the dumbest assertions I think I’ve seen in a long time:

http://thecartelmovie.com/

Go to the bottom of the page where this complete moron attempts to argue that states which spend more on education have lower SAT scores… that spending more leads to lower SAT scores.

[BOWDON APPEARS TO HAVE REMOVED THE TWO CHARTS WHICH ATTEMPT TO MAKE THIS ARGUMENT. SEE COMMENT BELOW]

QUOTES/LABELS FROM THE CHARTS INCLUDED:

“THE MORE A STATE SPENDS ON SCHOOLS THE LOWER ITS KIDS’ SAT SCORES”

“EVERY EXTRA $100 IN EDUCATION SPENDING LOWERS SAT SCORES BY 1 1/3 POINTS”

He kept this statement “With spending as high as $483,000 per classroom (confirmed by NJ Education Department records), New Jersey students fare only slightly better than the national average in reading and math, and rank 37th in average SAT scores.” On his “The Deal” page…

In fact, there may be a connection… that is… states that spend more which happen to be in the northeast, happen to have higher SAT participation rates… because northeastern colleges and universities use the SAT. 82% of New Jersey students take the SAT.  This figure is 9% in Alabama and 4% in Mississippi, and students taking the SAT in those states tend to be the select few interested in attending competitive northeastern colleges.  So, we’re comparing the top 4% of Mississippi students to the 82% of NJ students. Anyway… that absurdity aside, here’s a better picture of how the relationship between state spending on schools relates to state average outcomes. The following four graphs show the relationship between predicted basic state and local revenue per pupil (controlling for sparsity, econ. of scale, state poverty rates, ELL children and regional wage variation) and National Assessment of Educational Progress 2007 scores. Actually, somewhat to my own surprise there is a reasonably positive relationship here. THAT SAID… I DO NOT ASSUME  THIS TO BE A SIMPLE DIRECT CAUSAL RELATIONSHIP. There are many potentially interesting underlying stories that might be told here about regional differences in income, adult population education levels, tax policy structures, etc.

Anyway… for me… this foolishness has reduced significantly any interest I may have had in actually seeing the movie.  Ignorant… juvenile… silly… I’m not even sure how to classify this attempt at a “brilliant revelation” from a scatterplot (FYI – I used to teach my 7th graders how to do this stuff… and draw appropriate inferences…not this kind of crap.)

I was initially pleased to see that the “facts and figures” page on the site actually had links to reasonable facts and figures and reports… rather than making them up off the cuff…(a topic I’ve written about with regard to teacher salaries, administrative salaries, Abbott spending and many other related topics – https://schoolfinance101.wordpress.com/2008/12/09/notes-from-a-school-finance-curmudgeon/).

Here’s the relationship between SAT participation rates and SAT combined scores.

Presentation1

By the way… this graph I previously posted compares teacher salaries other professions holding similar degree levels, at similar age, over time in NJ. And these are hourly wage comparisons. Interestingly, teachers have fallen further and further behind over time.

https://schoolfinance101.wordpress.com/2009/01/14/those-darn-overpaid-nj-teachers-sucking-the-life-out-of-the-lagging-economy/

========

And here’s where NJ actually stands on corrected spending measures and standardized outcomes:

Do School Finance Reforms Make Any Difference?

Well… here’s what a number of reasonably strong empirical studies have shown…

•   David Card & A. Abigail Payne, School Finance Reform, The Distribution of School Spending, and the Distribution of Student Test Scores, 83 J. Pub. Econ. 49 (2002)
–    Using micro samples of SAT scores from this same period, we then test whether changes in spending inequality affect the gap in achievement between different family background groups. We find evidence that equalization of spending leads to a narrowing of test score outcomes across family background groups. (p. 49)
•    John Deke, A Study of the Impact of Public School Spending on Postsecondary Educational Attainment Using Statewide School District Financing in Kansas, 22 Econ. Educ. Rev. 275 (2003)
–    In this paper, I use a policy change in Kansas involving statewide school district refinancing to measure the impact of per-pupil spending on the probability that a student will choose to acquire more education. Using panel models that, if biased, are likely biased downward, I have a conservative estimate of the impact of a 20% increase in spending on the probability of going on to postsecondary education. The regression results show that such a spending increase raises that probability by approximately 5%.
•   Thomas Downes (2004) School Finance Reform and School Quality: Lessons from Vermont. In Yinger, J. (ed) Helping Children Left Behind: State Aid and the Pursuit of Educational Equity. Cambridge, MA: MIT Press.
–    All of the evidence cited in this paper supports the conclusion that Act 60 has dramatically reduced dispersion in education spending and has done this by weakening the link between spending and property wealth. Further, the regressions presented in this paper offer some evidence that student performance has become more equal in the post–Act 60 period. And no results support the conclusion that Act 60 has contributed to increased dispersion in performance. (p. 312)
•    Tom Downes, Jeffrey Zabel, Dana Ansel (2009) Incomplete Grade: Massachusetts Education Reform at 15. Boston, MA. MassINC.
–    The achievement gap notwithstanding, thisresearch provides new evidence that the state’s investment has had a clear and significant impact. The achievement gap notwithstanding, this research provides new evidence that the state’s investment has had a clear and significant impact. how education reform has been successful in raising the achievement of students in the previously low-spending districts.4  Quite simply, this comprehensive analysis documents that without Ed Reform the achievement gap would be larger than it is today. (p. 5)
•    Jonathan Guryan (2003) Does Money Matter? Estimates from Education Finance Reform in Massachusetts. Working Paper No. 8269. Cambridge, MA: National Bureau of Economic Research.
–    Using state aid formulas as instruments, I find that increases in per-pupil spending led to significant increases in math, reading, science, and social studies test scores for 4th- and 8th-grade students. The magnitudes imply a $1,000 increase in per-pupil spending leads to about a third to a half of a standard-deviation increase in average test scores. It is noted that the state aid driving the estimates is targeted to under-funded school districts, which may have atypical returns to additional expenditures.
•    Margaret Goertz & Michael Weiss (2008) Assessing Success in School Finance Litigation: The Case of New Jersey
–    State Assessments: The gap between Abbott districts and all other districts was reduced to 12 points by 2005 or 0.40 standard deviation units. The gap between the Abbott districts and the high wealth districts closed from 25 points to 15 points in 2005 (Figure 7). Performance in the low, middle, and high wealth districts essentially remained parallel during this time. (p. 17)
–    NAEP: The NAEP results confirm the changes we saw using state assessment data. NAEP scores in 4th grade reading and mathematics in Central Cities rose 19 and 20 points, respectively between the mid-1990s and 2005, a rate that was faster than either the Urban Fringe or the state as a whole. P. 20)

Should Think Tanks be Licensed to Think? (and when should a license be revoked?)

We all have our flaws. As social science researchers, writers, reviewers, etc. dealing with highly political and politicized topics, we all let our personal biases creep inappropriately into our work at times. In the world of education policy writing and research, there are many occasions where individuals and organizations are provided opportunities to selectively review and present data and summaries of existing literature in order to make one point or another or argue one side of an issue or another. There will always be reasonable differences of opinion on complex social science issues, both with regard to the methods that should be used to provide definitive answers, and the definiteness of the answers themselves.

All of that aside, there are, I believe some really basic rules of thumb that should be followed and some offenses that should be considered so egregious that they warrant public rebuke and removal from the table around which public discourse occurs on key education policy topics.

My latest example of an offense so egregious comes from a review I completed today on a report from Lisa Snell of the Reason Foundation – the Weighted Student Formula Yearbook 2009. Reason Foundation is a Think Tank, so-to-speak, or at least fashions itself as such. There are many “Think Tanks” across the political spectrum and these Think Tanks frequently chime in with well-publicized findings regarding education policy and finance issues. So, this is not new. That said, this particular report is simply so awful, I can’t shake it from my head.

To summarize, the report touts urban school reforms which involve decentralized management and school choice, two issues on which I personally do not have strong opinions one way or the other, from an ideological perspective (rather, my concern is that if one pursues a particular reform, it should be done using appropriate evidence, and should be done well – or as well as can be – and not half-baked). The report inappropriately casts the varied reforms presented as Weighted Student Formulas  – a specific reform which involves using a student need focused funding formula to drive financial resources to schools – something which, if done well, could be quite a good idea.

So… I digress… what is so awful then about the Reason report? Why do I think their license to think should be revoked and their seat at the education policy debate table eliminated? In an effort to make their case that the reforms implemented in 14 cities and 1 state have all been highly successful, the authors go so far as to cite evidence of improved student outcomes – in one third of their 15 cases – that occurred in years prior to the implementation of the reforms. That is, the reforms somehow, amazingly, through space-time travel perhaps, had retroactive effects on student outcomes. I’m dumbfounded!

Here’s a section of my review:

=====

Most problematic is the fact that in five of the 15 cases discussed (one third of the cases), outcome successes mentioned actually occurred prior to the implementation of WSF or SBB/SBM (see Appendix A). For example, the report commends NYC for winning the 2007 Broad prize, the year before its Fair Student Funding policy was implemented. The report might arguably attribute this success to mayoral takeover, which began in 2002. But this is the WSF Yearbook, and even the expansive definition of WSF used in the report did not encompass mayoral takeovers.

Similarly, the report commends Hartford for raising test scores in 2008, the year before implementing WSF, and it commends Denver for making strong improvements between 2005 and 2008, whereas WSF was implemented in 2008-09. These successes lead one to question why these districts would want to implement WSF and risk undoing their prior achievements.

The most egregious claim of retroactive causation appears in the press release for the report:

The results from districts using student-based funding are promising. Prior to 2008, less than half of Hartford, Connecticut’s education money made it to the classroom. Now, over 70 percent makes it there. As a result, the district’s schools posted the largest gains, over three times the average increase, on the state’s Mastery Tests in 2007-08 (emphasis added).[i]

Yet, the report itself states that Hartford only began implementing WSF in 2008-09, and only expected to achieve the 70 percent target of available resources allocated to schools and classrooms by 2009-2010 (p. 61). It is difficult to conceive of any defense for Reason’s claims.

=====

Link to complete review: http://www.epicpolicy.org/files/TTR-Baker-Reason-WSF.pdf

I’ve personally come to refer to this offense as the Ouchi Retroactive Causation effect, since the first time I encountered such an absurd argument was in the work of William Ouchi who made much the same analytic gaffe in reference to the success of reforms in Houston. Scott Thomas and I, in our report on Weighted Funding for Hawaii noted: “… most obviously problematic is the authors’ touting of Houston’s success in improving performance through its WSF and decentralized governance, based on performance data from 1999 to 2001, when the formula was implemented (first year of phase-in) in 2001-02” (Baker and Thomas, 2006, p. 9).

http://www.hawaiireporter.com/file.aspx?Guid=1e930a29-3017-40fc-b58c-cf1513149ce7

http://www.hcps.k12.hi.us/STATE/COMM/DOEPRESS.NSF/a1d7af052e94dd120a2561f7000a037c/36dfa2492b206d2c0a2571be000450fd/$FILE/WSF-Baker.Thomas-2-07.28.06.pdf

For a more thorough critique of the work of Ouchi on this topic, see my article with Doug Elmer in Educational Policy (vol. 23 no. 1, 2009)

Look… we all make errors of logic and errors of analysis. So too do relatively safe and conscientious drivers get into an occasional auto accident. However, if a driver drives 15 times in one week, and drives drunk 5 times, that driver should lose his/her license. Claiming retroactive causation 5 times in 15 cases in a report which then proposes “best practices” for schools is comparably irresponsible. Arguably, the first or second offense is bad enough.

If nothing else, the Reason Foundation and the Eli and Edythe Broad Foundation which provided support for the Weighted Student Formula Yearbook should evaluate carefully whether such haphazard and arguably reckless thinking really advances the public policy agenda in any productive way. Whatever good elements there may be in the attempts of these districts to improve educational opportunities for the children they serve are severely undermined by the Weighted Student Funding Yearbook.


[i] http://www.reason.org/news/show/1007460.html

Special Education Funding & Wage Differentials under New Jersey’s SFRA

As the hour of oral arguments in Abbott v. Burke approaches, I suspect there will be some debate as to whether specific elements of the state’s new school finance formula SFRA are, in fact, appropriate. Two components of SFRA that concerned me long before I participated at trial on behalf of plaintiffs were the adjustment created to accomodate  wage variation across New Jersey school districts, and the flat funding – census based approach – used for special education. Quite simply, both are bad policy and are particularly damaging to the state’s highest need children who are clustered in certain school districts – primarily Abbott districts. I will not further editorialize on this point here. But I will post links below to two academic papers on these specific topics which I have presented in recent years.

The first paper was presented at the Annual Meeting of the American Educational Research Association in the Spring of 2008 and involves analysis of wage adjustments in several state school finance formulas, concluding that statistically, New Jersey’s new GCA is among the worst (a finding I did not expect at the outset of the study).

Link to Wage Paper

The second paper, for which an abstract was submitted in Summer 2008, was presented at the 2009 Annual Meeting of the American Educational Research Association, and explores the assumption that children with disabilities are evenly distributed. The paper further explores the equity consequences of distributing funding on this assumption if false.

Link to Special Education Paper

I welcome legitimate critiques of the statistical analyses and policy conclusions in either paper.

On the “Costs” of Private Schooling

Most often, private school costs are addressed in popular media and think tank reports in the context of policy debates over tuition tax credit and voucher proposals. The typical argument is that public school students may be tuitioned out of the public system at lower cost than the operating cost of the public system to private schools which provide greater benefit. In the best of cases, authors of such reports provide reasonable publicly reported estimates of public school expenditures – because such data are readily available – and then choose estimates of private school “costs” from a handful of sources or simply propose a ballpark estimate.
In one recent example, Podgursky, Brodsky and Hauke (2008) explain how Missouri might use a tuition tax credit program to provide opportunities for children in failing urban public schools to attend private schools. The authors explain that public school spending in the urban core districts is on the order of $10,000 to $12,000 per pupil and that tuition tax credits could be used to raise funds to provide vouchers to urban public school students at a level of $5,000, yielding a 50% savings rate for each child who opts out of the public schools and takes the voucher. To support their argument that the $5,000 voucher is sufficient subsidy for private schooling, Podgursky and colleagues note: “we assume that average private school tuition is $4,000 per year, in line with estimates of the national average” (Podgursky et al., Jan 2008) The authors footnote this assertion as follows:

  • For example, the U.S. Department of Education’s National Center for Education Statistics reports in Table 59 of the 2005 Digest of Education Statistics that the average national cost of elementary/secondary private school tuition is $4,689 per year. In addition, a well-cited 2003 Cato Institute study found that the average elementary tuition cost was less than $3,500 per year by looking at private schools in several major U.S. metropolitan areas. See Salisbury, David F. “What Does a Voucher Buy? A Closer Look at the Cost of Private Schools,” The Cato Institute, Policy Analysis, No. 486, August 2003

That is, the authors posit that the average private school tuition in Missouri major metropolitan areas 2008 is somewhat less than the average impartially (NCES) reported average national tuition in 2004, and similar to the average tuition reported in a Cato Institute survey of 2002-03 tuition levels in select cities nationally.
Indeed there are no easily accessible estimates of actual private school costs in St. Louis or Kansas City, Missouri. That said, the choice to recognize a voucher level of $4,000 to $5,000 as sufficient subsidy, based on the cited information is problematic at best. The use in a 2008 policy brief in Missouri of the $3,500 (Cato, 2002-03) and $4,000 (NCES, 2005) figures assumes these figures to be both (a) timeless, not subject to inflation and (b) and spaceless, insensitive to regional price variation. These are two deeply flawed assumptions.
Note that the only reference to a national average tuition of $3,500 in the Cato report comes from the report’s abstract, which cites NCES data from 1999-00 rather than the report’s own survey findings from 2002-03: “Government figures indicate that the average private elementary school tuition in the United States is less than $3,500 and the average private secondary school tuition is $6,052.” (p. 1) The $3,500 average national tuition figure has taken on almost mythical status in political and media circles and think tank reports, as evidenced by results of a Google search of the terms “private school cost” and “$3,500.” Notably, the higher secondary tuition level is rarely mentioned.
At the time of the Podgursky brief, even if the $3,500 Cato (2003) figure had been representative of Missouri urban private school tuition, that figure was already 9 years old. Beyond inflation, the National Center for Education Statistics Education Comparable Wage Index reflects that both the Kansas City and St. Louis labor markets have higher than national average labor costs, which may affect private school tuition. Indeed, the labor markets identified in the Cato report may be even higher wage labor markets, but no attempt is made to correct for regional variation or identify tuition levels in Missouri urban private schools. In simple terms, dollar values are neither spaceless nor timeless.
Cato’s own summary of city median tuition levels for primary/elementary schools and secondary schools shows considerable variation and shows that the 1999-00 NCES national average figure of $3,500 is insufficient in 2002-03 at the secondary level to meet full tuition in any city, and is only sufficient at the elementary level to meet tuition in 2 of 6 cities.

Table 1
Findings from Cato Tuition Survey
City    Median 2002-03
Tuition
New Orleans    $3,895
Houston    $4,325 primary
$6,150 secondary
Denver    $3,528 primary
$5,995 secondary
Charleston, SC    $3,153 primary
$4,056 secondary
Washington DC    $4,500 primary
$16,075 secondary
Philadelphia    $2,504 primary
$4,310 secondary
Cato, p. 5

Perhaps the best available national resource for understanding private school tuition rates and how they very by school type and location, is the Private School Survey component of the National Center for Education Statistics Schools and Staffing Survey. SASS is the source from which private school tuition averages are generated for the NCES Digest of Education Statistics. SASS is based on a sample of private schools, not all private schools, but that sample may be weighted such that calculations of mean tuition rates and teacher salaries, or other variables are representative of national or regional populations of all private schools. That said, these data do not get the level of public exposure they perhaps deserve, given the thirst for private school financial comparisons. SASS tuition data do play a role in a number of empirically rigorous analyses of the private school enrollment behavior. For example, Epple, Figlio and Romano (2004) use the SASS tuition data to evaluate income related stratification of students in private schools in metropolitan areas into “elite” (highest tuition) private schools.
Central to the analysis herein is the point that tuition levels do not indicate operating cost levels. I am far from the first author to make this acknowledgement. For example, in a cost-benefit analysis of education reform strategies, Yeh (2007) explains:

  • The real social cost of educating large numbers of students in private schools (who are currently educated in public schools) is difficult to estimate for several reasons: Private school tuition figures exclude costs that are offset by corporate and noncorporate subsidies (U.S. General Accounting Office, 2001), as well as the cost of services that would be required by many students (and, by law, are currently provided by public schools, but not private schools), including transportation, free and reduced-price meals, special education, vocational education, and services for students with disabilities and limited English proficiency (Belfield, 2006; Levin, 1998; Levin & Driver, 1997).

Similarly, in an analysis of the effects of private and charter school competition on the teaching profession, Hoxby (2002) notes:

  • For instance, in some metropolitan areas, up to 15 percent of the elementary student population is enrolled in private schools where tuition is about two-thirds of the schools’ per-pupil expenditure. (Typical amounts for schools with religious affiliation would be tuition of about $1,600 and expenditure of about $2,300 dollars). (Hoxby, 2002, p. 861)

Interestingly, however, Hoxby provides no citation for the ballpark figures she chooses. Yet, others stand stubbornly in denial that there exists any problem in using tuition data to represent operating costs for private schooling:

  • One can also get some additional insight on the comparative costs of private and public schools by looking at the quoted tuition charged by private schools. For obvious reasons, quoted private school tuitions necessarily have a somewhat loose connection with costs. They are usually supplemented by endowments, contributions, fundraising events, in-kind contributions by parents, and below-cost wages for religious teachers and other staff. Yet, clearly these do not account for much of the observed difference between private tuition and public school costs. (Wenders, 2005, p. 223)

While unfounded and in conflict with the previous two statements, Wenders (2005) assertion is neither easily supported nor refuted with existing literature.
Why does it matter whether tuition is representative of cost or whether the size of margin between tuition and costs is 1% or 20%? Assume that a group of church subsidized private schools charges $3,500 per child in tuition, but those schools operate at a cost of $7,000 per pupil. When serving the children of the church community, parents sending their children to the school pay their tuition per child and likely also offer a tithing, perhaps equal to or greater than the difference between tuition and cost. Assuming that on average, the parent tithing is less than the margin of difference, other parishioners’ tithing and other contributions to the church and school make up the difference.
Now, assume we wish to send, on public voucher, 100 additional children to the private school, from the public system, at a voucher level that matches the full tuition level, $3,500. But, if operating costs remain at $7,000 per pupil, someone must contribute an additional $350,000 to the school to cover costs of the additional 100 students. If the students tuitioned to the school through the voucher system are both poor and non-parishioners it is unlikely that they will provide the additional resources themselves. The larger the desired voucher system – more extensive participation rates – the larger the additional philanthropy requirement becomes. This is potentially even more constraining under tuition tax credit programs which rely on philanthropy to generate the initial tuition vouchers.
To their credit, the Cato (2003) report is one of the only sources available that attempts to compile information on private school tuition rates for a multitude of schools  in specific metropolitan areas, including New Orleans; Houston; Denver; Charleston, S.C.; Washington, D.C.; and Philadelphia. Cato surveyed several hundred, primarily Catholic and other religious private schools, gathering 2002-03 tuition data, and concluded that a voucher level of $5,000 would give students access to most private schools in the cities surveyed and that “Since average per pupil spending for public schools is now $8,830, most states could offer a voucher amount even greater than $5,000 and still realize substantial savings.”  (Cato, p. 1)
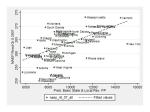
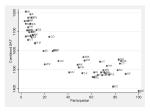
The Cato report, however, suffers the central problem of asserting that private schools can take on additional students at these tuition levels and subsidize the difference via philanthropy. A select review of financial statements (IRS 990) for 2006 spending per pupil, compared with tuition levels listed in the Cato report appendix reveals the following:

  • Riverside Academy in New Orleans reported tuition of $2,385 to $2,790 to Cato. Riverside Academy spent in 2006, $3,857,985 on 528 students, or $7,307 per pupil.
  • Northland Christian reported tuition of $8,300 and spends $8,467. Here, tuition is closer to spending, but relatively high on the Cato list for Houston. (Houston)
  • Galloway school reported tuition of $5960, but spends $8,431. (Houston)
  • Westbury Christian reported $4,450 but spends about $7,059. (Houston)
  • Friends Select reported $14,255 to $16,070 but spends $20,161. (Philadelphia)
  • City Center Academy (a Presbyterian school) reported tuition of 3,800 but spends over $10,000, serving only about 75 students.

Private school vouchers are commonly recommended or applied at levels ranging from under $3,000 to just over $6,000, rarely higher. Podgursky (2008) and Aud (2007) each discuss Arizona tuition tax credit programs offering $4,200 to $5,000 vouchers, Florida’s A+ voucher at $4,063, Cleveland’s well-known voucher program offering $2,686 vouchers in 2004-05 and the Milwaukee voucher program offering vouchers of $6,351 per pupil in 2005-06. Invariably these voucher levels are argued by pundits to be sufficient on the basis that it is well documented and well understood that private school tuition is approximately $3,500 to $4,000 per child.
A recent policy brief on saving Catholic schooling in urban American highlights problems with undersubsidized vouchers. Hamilton, Finn and Petrilli (2008) note that:

  • In Milwaukee, the city with the nation’s largest publicly funded school voucher program, enrollment is still declining in many inner-city Catholic schools. In Washington, D.C., despite federally funded vouchers for the tuition of poor, mostly non-Catholic inner city children, the Church is turning seven schools into public charters – which will be well funded, but non-religious. (p. 6)

Recall that the voucher level in Milwaukee is actually much higher than other existing publicly financed voucher policies ($6,351). Yet even at this level the voucher is insufficient for propping up the urban catholic schools.
Belfield, Levin and Schwartz (2006) elaborate on the sufficiency of voucher levels in Milwaukee. The authors note that by 2001, 40% of voucher receiving schools had more than 80% of their students on vouchers, and that the supply of providers had increased since implementation of the voucher program. But, the authors note that explanations for the increase in supply are not found by exploring the relationship between voucher revenue and costs because “Many schools report costs above the value of the voucher, and costs only weakly converge to the voucher amount” (p. 1). Again, this scenario occurs under one of the higher funded voucher models.
The primary strategy proposed by Hamilton, Finn and Petrilli (2008) for saving urban catholic schools – short of converting them to charter schools – is to scale up dramatically philanthropy among church parishioners and to refocus catholic schooling on catholic children of parishioners. Where subsidies fail to cover costs, philanthropy must fill the gap. Costs may not be reduced sufficiently to match the voucher subsidy. The authors point to recent efforts in Wichita, KS as a model:

  • Catholic schooling would be free to all parishioners. To make the financials work, the bishop asked all Church members to tithe a significant portion of their salaries, which largely went into the school operations fund. Parishioners responded enthusiastically. Today, all Wichita Catholics can send their children to parochial school. Tuition is no barrier. (p. 9)

The authors point out, that among other issues in raising financial support, church members are reluctant to take on the additional public service mission of funding the non-catholic poor.

  • Catholic parishioners have been willing to help to a point, but our survey shows that about six in ten Catholics now view “working with economically disadvantaged students” as the domain of public schools. (p. 8)

Stepping back somewhat from traditional voucher arguments that public taxpayer dollars should be used to partially subsidize the catholic school education of non-catholic poor urban children, Hamilton, Finn and Petrilli (2008) suggest instead that urban catholic schooling might better survive under a heavily subsidized parish tax system (strong-armed and substantial tithing) coupled with emphasis on serving burgeoning Hispanic, catholic low income populations (rather than non-catholic urban blacks, historically served in urban voucher systems like Milwaukee).

  • The Church should heed Wichita’s example and embark on a serious campaign to make Catholic education affordable – even free – for all Catholics. Such an effort will be particularly significant for America’s recent Hispanic immigrants, many of whom live near urban Catholic schools with a rich history of educating children new to our shores. This means asking parishioners to dig deep. It also means being aggressive about revitalizing rundown, ill-managed parish schools with an eye to making the system as a whole as efficient and effective as possible.

The bottom line is that when vouchers cover only tuition rates or portions of tuition rates, someone must dig deep to ensure that service providers can be sustained.  Alternatively, to reduce the requirement of additional philanthropy, policymakers must have more accurate information regarding the actual costs of providing private schooling rather than average tuition rates.

(this draft excerpt is taken from forthcoming work in which I evaluate IRS tax filings of over 1,500 private schools nationally in order to provide a more thorough understanding of private school costs and how those costs vary by school type and location)

What does $5,000 get you in Georgia?

This proposal caught my eye the other day… but it took me a few days to round up the relevant data and figures.

http://www.beaconcast.com/articles/20090307

The proposal is to give every kid in Georgia a $5,000 dollar voucher to take to the public or private school of his or her choice. At the time of this blog post, I am currently working on a massive research project compiling the financial statements of private schools (IRS 990) and combining those data with enrollment data for those schools in an attempt to figure out what private schools actually spend per pupil. NOT WHAT THEIR TUITION RATE IS, BUT WHAT THEY SPEND! I’m looking at total expenditures per pupil in a given tax year (2006) and comparing with total expenditures per pupil in public schools in the same labor market (mainly metro areas).

I’m all for any plan that could substantially disrupt the educational disparities that result from racial and socioeconomic segregation in neighborhoods, housing stock, etc. that ultimately dictate who goes to what school, who chooses to teach where and as a result, strongly influences the distribution of schooling quality in ways that contribute substantially to persistence of black-white achievement gaps. Watch this exceptional lecture for a more thorough explanation:

http://www.uark.edu/ua/der/Lecture_Series/Hanushek/Hanushek.html

The first simple critique I have of the current Georgia Senate Bill (SB) 90 proposal is that it fails to provide at least some transportation support/subsidy… which means that choice will be severely limited for lower income families. That’s a serious problem which undermines most if not all good that might come of such a proposal.

But aside from that little problem, let’s take a look at some basic stats on private schooling enrollments, types and per pupil spending in Georgia… to see how this $5,000 voucher stacks up.

Figure 4 (sorry about not including 1 though 3, limited space in the blog) shows that the largest two sectors of private schooling in Georgia are Christian (not Catholic) schools (affiliated with AACS and/or ACIS) and Independent Schools. Actually, the strong presence of independent schools could potentially lessen concerns that most if not all choices made by students and families would result in channeling funds to religious schools. That is, if funding was sufficient for independent schools.

georgia-private-schools

Figure 5 displays the student weighted frequency distribution for independent school per pupil spending in Georgia in 2006 based on IRS filings of 43 independent day schools serving nearly 26,000 students. The minimum expenditure was $9,579, nearly twice the proposed voucher level.

From my most recent data source, there are over 850,00 students in public schools in the Atlanta metro area alone. So, if even 1% of those students wanted to attend even the lowest spending private independent school (8,500), someone would need to cough up and additional $38,921,500 to cover the gap in annual costs (ignoring the capital expense of taking on an additional 8,500 students). If 1% of students in the Atlanta metro area attended the average (statewide mean, Atlanta mean even higher) independent school, at a gap of $10,061, someone would have to cough up an additional $85,518,500. So much for the big savings from vouchers here. If state government is saving, then it’s only because someone else is forced to pick up the tab.

Private Independent School per Pupil Expenditures in Georgia

Okay… so lets assume instead that 1% of Atlanta area children shift over to Christian schools. Surely they must be a lot cheaper than the public schools. Everyone… I mean everyone knows and fully accepts the conventional wisdom that private schools spend a whole lot less than public schools… and of course… get much better results… right?

Figure 6 shows the distribution of per pupil spending for Christian schools from IRS filings of 36 Christian schools statewide in Georgia, serving 13,777 students. My IRS filing rate is lower here than for independent schools for two reasons. Many formally religiously affiliated schools don’t file IRS 990. Second, I eliminated from my data, schools with expenditure budgets smaller than $500,000 (mostly really tiny schools, some start-up, some dying out). Figure 6 shows that there are some Christian schools that show spending levels below 5,000 (about 8 schools). But still, the enrollment weighted average is nearly $8,000, meaning that a 1% shift in Atlanta metro public school students to “average” private Christian schools would still require $25,500,000 to come from somewhere.

Perhaps some rethinking of Senate Bill (SB) 90 is in order.

Christian School per Pupil Expenditures in Georgia

Raising Arizona School Finance? Can’t be done!

So… I come across this blog which at first appears on target… indicating that typical rankings of state school finance are problematic. But then the blog goes awry…

http://www.paysonroundup.com/news/2009/mar/06/pupil_spending_statistic_meaningless_misleading/

The point of the blog is that Arizona school funding isn’t as bad as it looks. Not 49th nationally, and that funding alone is not all important. So… I went back to my model based estimates of “total state and local revenue per pupil” (which includes capital…), and my state effort indices (total state and local school spending as a share of gross state product and an actual student outcome measure – NAEP math and reading scores to see how Arizona really does.

My state and local revenue comparisons are based on a statistical model which controls for differences in the percent of children attending small remote schools, rates of poverty, regional variation in competitive wages, children with disabilities, etc. It controls for the generally accepted set of cost factors influencing the costs of producing student outcomes. With the model, I generate predicted values for a district of the same characteristics across all states (to the extent that such a district exists). Nonetheless, it’s the best way I can currently think of to get rid of all of that messiness that leads to misleading comparisons in Education Week and the Education Trust.

So… How does Arizona do?

How Does Arizona Really Do?

So… Arizona is not 49th nationally… it’s 46th. Hooray! And, It ranks 43rd in effort, and 43rd in NAEP reading. The best AZ does is 37th in NAEP math.

In addition to these statistics, on which Arizona performs quite poorly, let me share a few other major concerns I have with Arizona school finance. Arizona is among the few states, which by the design of the state aid allocation formula actually allocates systematically fewer resources to higher poverty districts. This occurs because the state formula – unlike nearly all others – has no adjustment for poverty concentration. And, working against poverty, the state formula has an adjustment to drive more money to districts that already have more experienced teachers (Teacher Experience Index). This is disgraceful… and puts Arizona near the top of my list for “worst of the worst” in school finance.

Quick note to the author of the blog to which I initially responded here. The fact that Arizona ranks 21st (above 25th) on total education spending is meaningless when Arizona ranks 16th in the number of  children to be educated with that spending, and 13th in child poverty (Small Area Income and Poverty Estimates of the U.S. Census, 2006).

A technical note – having worked back and forth between state reported data systems and NCES fiscal data, I usually find a reasonable degree of correlation between the two. Not in Arizona. Arizona data – either the state version or the NCES version are highly irregular and it is difficult to discern which data are most accurate. I suspect that the state data are… but they are not generally available on the web (as they are in most states). AZ is particularly bad at public disclosure of school finance data.