Blog

Philadelphia Graph of the Day

I just can’t drop the Philly issue, because of the complete absurdity of the reformy rhetoric about Philly schools and persistent willful ignorance regarding the role of equitable and adequate funding for Philly schools and the Commonwealth’s failure to provide any reasonable level of support.

For what it’s worth – and I’ve spent a great deal of time critiquing this and similar studies – the Commonwealth in the mid-2000s took on the task of determining the “costs” per pupil of what Pennsylvania school districts needed to get the job done. This cost analysis was then used to guide development of a new formula intended to drive appropriate levels of state aid to districts facing substantive gaps between current spending (2006-07) at the time, and cost estimates developed under state supervision, by independent consultants.

 [critique of these & related methods can be found here]

At the time, state officials found that districts including Philadelphia, Allentown and Reading faced funding (relative to cost) gaps between $4,000 and $6,000+ per pupil.  So, in rather bold style, they adopted a new school finance formula with the intent to phase districts toward their adequacy targets.  Then the economy tanked, and a new era of political attacks on state school finance formulas followed (as much a Cuomo/NY issue as a Corbett one!).

So, where are Pennsylvania school districts now, with 2013-14 (July estimates) funding (holding local effort constant), when compared to the 2006-07 funding gaps? That is, have Pennsylvania districts come any closer in the (7) following years to the targets that were estimated for them before it all came crumbling down?

Simple answer? No!

Philly Adequacy GapThat is, Philly remains more than $4,000 per pupil (by this quick&dirty analysis) below the funding target that was estimated for it nearly a decade ago. [BEF = Basic Education Funding]

BEF 2013-14: http://www.portal.state.pa.us/portal/server.pt/community/education_budget/8699/SAEBG/539259

Endangering Intelligent Conversation: Comments on the Latest Hanushekian Crisis Manifesto

I had the displeasure of coming across this completely ridiculous and deceitful video the other day:

http://www.youtube.com/watch?v=e8aeEr2qk9s

Which was created to promote Eric Hanushek’s latest U.S. education crisis manifesto.  Around the 4:12 minute mark, the video jumps from crisis mode to policy solution mode,  telling us how among U.S. States, Florida is a model for the way forward, and states like Wyoming and New York provide proof positive that money really has nothing to do with helping schools. That money doesn’t matter is a critical underpinning of nearly every reformy rant.

Here’s the complete story to the contrary.

Now, most of what’s here has been summarized previously by Hanushek, and I have discussed this stuff previously on this blog.

This bizarre video got me thinking about a series of previous posts where I’ve looked across numerous indicators to try to tease out the relationships among them, across states.  I’ve selectively scoured scatterplots of relationships between various state level indicators and outcome measures, but have not for a while now, simply stepped back and evaluated the correlations across all of them, and then tried to tease out what states, if any really do stand out.

Let’s start with the indicators and their sources.

School Funding Fairness: First up in my state level data set are a series of indicators from http://schoolfundingfairness.org/

These indicators characterize the level of funding and effort in state school finance systems.

  • Funding Level (predicted at 10% Poverty)
  • Funding Effort (state and local revenue as a share of gross state product)
  • Coverage (% of 6 to 16 year olds in public school system)
  • Early Childhood Enrollment (% of 3 & 4yr olds enrolled in some form of school)

Union Strength: Second are the Thomas B. Fordham Institute rankings of state level union strength. Here, a rank of 1 means a state with strong unions, and a rank of 50 would be a state with a weak union role.  Thus, from a measurement standpoint, one might describe it as “union weakness” – that is, the higher the assigned value (thus lower ranking) the weaker the unions in that state. http://www.edexcellencemedia.net/publications/2012/20121029-How-Strong-Are-US-Teacher-Unions/20121029-Union-Strength-Full-Report.pdf

 Policy Context Reformyness:  Third, I have the grade point averages assigned to states by Students First in their state report cards. I use their overall GPA, their GPA for teacher policies and their GPA for parent power. http://reportcard.studentsfirst.org/ In brief, Students First supports removal of seniority privileges, test-based teacher evaluation, mutual consent teacher assignment policies, folding their preferences for these policies into their teacher GPA. Regarding parent power, they support such cockamamie schemes as parent trigger, and more common school choice alternatives such as charter school expansion and tuition tax credits.

Teacher Wage Competitiveness: Here, I rely on the Economic Policy Institute’s measure of the Teaching Penalty, which is the average weekly wage of teachers compared to non-teachers for each state. http://www.epi.org/publication/the_teaching_penalty_an_update_through_2010/

Harvard PEPG/Hanushek Catching Up Outcome Measures: Finally, along with mean scale scores of the National Assessment of Educational Progress, I also use some of Eric Hanushek’s own measures of student outcomes – and corrected versions of those measures – in order to track which of the above policies seem most correlated with various outcome measures – in the appropriate direction that is! http://www.hks.harvard.edu/pepg/PDF/Papers/PEPG12-03_CatchingUp.pdf

Now, in the book of “reformy”, there are some well understood truths.

First, that school choice programs, no matter what, no matter how structured, necessarily lead to an improved system for all. Choice lifts all boats. It necessarily induces innovation, thus quality, and the pressures of innovative quality force the stagnant public system to step up or collapse (that is, unless political leaders have already crafted a scheme to forcibly close traditional public schools, creating a false demand for alternatives, and then publicize that false demand as real… and well… you know).

Second, teacher wages are completely unimportant, largely because teachers are already paid way to freakin much and as a result they are all just complacent, lazy and greedy, waiting on those fat pensions they stand to collect after they ride out their time. In fact, pure reformy ideology declares that the best way to improve teacher quality is to cut those wage for most teachers, and perhaps, based on the luck of the roll of the test score dice, grant a few bonuses here and there to the truly “great” teachers.

Spending more money on stuff like expanding early childhood education is just wasteful expansion of the existing bureaucracy, having no persistent positive gains for children down the line.

States that spend a lot on schools are really just wasting their money, and getting nothing for it (see the above video… which pretty much says this straight up! Re: Wyoming and New York).

Thus… we must look to the models… like Florida… or Louisiana… or perhaps even Arizona?

So I was wondering….

So, I was wondering, if I took all of the above indicators, and first evaluated the correlations among all of them, and then evaluated a few scatterplots of what appear to be among the more consistent correlations, what would I conclude? Clearly, by my snark above, along with a lot of the other content you’ve probably read on this blog, I already have an opinion in this regard… but let’s start with a look at the correlations.  Do they really tell us how totally freakin awesome reformyness is? And how totally freakin pointless it is to consider silly stuff…. Like money… and paying teachers well? And how completely freakin’ destructive unions are to quality education systems?

Here’s the correlation matrix… highlighted using a standard Excel conditional formatting feature.

Table 1. Correlations Across Indicators

Slide1

And here’s a bullet point summary of the correlations.

  • States with weaker unions (higher number in ranking, meaning lower union strength ranking), have systematically lower state and local revenue per pupil and less competitive teacher wages.
  • States with weaker unions have systematically lower average NAEP scores.
  • States with higher reformy grade point averages according to Students First, have lower shares of children in the public school system, and have lower average NAEP scores.
  • Average NAEP scores are most positively associated with state and local revenue and teacher wage competitiveness.
  • Standardized NAEP gains over time are most positively associated with shares of 3 and 4 year olds enrolled in school programs/pre-school.
  • Standardized NAEP gains are also positively associated with Students First grade point averages.  But, standardized NAEP gains are pretty strongly related to starting point. That is, states showing greater gains are generally those who started lower.

Figure 1. Gains Depend on Starting Point

 Slide2

  • Standardized NAEP gains, adjusted for starting point, are positively associated with enrollment of 3 and 4 year olds and with state and local revenue per pupil.
  • Adjusted standardized NAEP gains are only very weakly associated with Students First grade point averages.

So, who are the real standouts?

Okay… okay… but those correlations just suggest that states with higher spending and more kids in early childhood education seem to be doing better and gaining more over time.  The correlations also, in the most generous case, suggest that the most reformy policies have been adopted in states that do and have historically done very poorly on outcome measures and that states with reformier policies aren’t necessarily outpacing those without (when the performance measures are adjusted for starting point).

Now… one might say… we must give these policies time… we’ve only just begun. To which I say many of the underlying policy conditions in these states, but for more recent changes to teacher evaluation policies under Race to the Top, have actually been in place now for a decade or so. Reforminess IS THE STATUS QUO in many of these low performing and gain-lagging states!

Figure 2. State & Local Revenue and NAEP Mean Scale Score

Slide3

State and local revenues remain positively associated with NAEP mean scale scores, but this is indeed a case, in part, of those who have versus those who don’t. Here, Massachusetts is lookin’ pretty good, with New Jersey squashed below it, just above New Hampshire.  Minnesota’s not lookin’ too bad. Florida is squashed in the middle of the pack among the low spenders.

Figure 3. State and Local Revenue and Adjusted Gains

Slide4Interestingly state and local revenues are also loosely (r=.228) associated with adjusted (by starting point) standardized gains on NAEP from 1990 to present (whereas reformier policy preferences were less correlated or not at all with adjusted standardized gains).

Now, a point not to be overlooked here is that New Jersey is actually further above the “expected” value, given its starting point, than Florida. But reformy types HATE New Jersey because it doesn’t conform to their preferences, just like they hate Maryland and tolerate, at best, Massachusetts.  New Jersey spends a lot, has very low percent of kids in charter schools and has relatively strong unions.

Thus, the emphasis on Florida as the obvious (really?) standout – the model for all! Some pretty massive freakin deceptive, cherry picking there if you ask me. Missing from this graph is Massachusetts.  Amazingly, no mention of New Jersey or Massachusetts in the goofy video above.

What I found most intriguing in this whole exercise was the relative strength of early childhood enrollments both with respect to NAEP mean scale score levels and with respect to the change in the percent of children scoring below basic.

Indeed, the first graph below also reflects some of the have/have not relationship. States like New Jersey and Massachusetts have higher income, more educated families that even without publicly financed pre-k programs would likely enroll their youngsters at a higher rate than parents in much lower income states.  These are the strongest relationships in the matrix above… and early childhood enrollments are also most positively correlated with changes in shares of children scoring low on NAEP and most positively correlated with corrected standardized gains on NAEP.

Figure 4. 3 & 4 Year Old Enrollment and NAEP Mean Scale Score

Slide5

Figure 5. 3 & 4 Year Old Enrollment and Reduction in % Below Basic

Slide6So, maybe it’s just me, but if anything, the correlation matrix above suggests that states that are spending on schools seem to both be doing okay, and to be improving over time.  Standouts on gains include Maryland and New Jersey (and Delaware). Florida doesn’t strike me as the big standout here, though they do have high NAEP change over time. But, others including New Jersey have higher adjusted NAEP gain and have much higher reduction in the percent below proficient.  And while New York and Wyoming raise some questions… some of these are easily disposed, with Wyoming being among the most sparsely populated states in the nation, for example, and New York being home to the largest city in the nation, embedded in the highest cost labor market in the nation.

As I’ve explained on previous posts… there’s a whole lot going on behind any simple scatterplot like these. They don’t tell of complex underlying causal relationships. They don’t really point us to those perfect models to follow.  But they sure can be illustrative, and raise some important questions about the BS constantly hurled at us, increasingly in cleverly produced youtube format.

=====

Addendum: This paper was recently tweeted as providing proof that the presence of strong teachers unions in states creates a substantial drag on student performance gains.  I’m actually quite shocked that such a methodologically goofy paper was actually published in this journal, which tends to be quite reasonable. First and foremost, the outcome measure – achievement growth over time – is created using states’ own assessments and looking at the difference in proficiency rates between 8th and 4th graders [with an unsatisfying “correction” for differences in test difficulty], in the same year [not even real cohort change]. This is problematic on two levels – first that differencing proficiency rates is a junk analysis to begin with, given policy shifts and other changes in state assessments and cut-scores over time, not to mention the massive information loss that occurs when we look only at numbers of kids shifting over  a particular bar (yes… one of my graphs above suffers this same problem – # 5).  No, these differences cannot be corrected by the simple regression used in the study.  Second, state assessments, rigor of items and cut scores differ so vastly that the idea of comparing proficiency rate changes across states is utterly ridiculous.  No, these differences cannot be corrected by the simple regression used in the study.  Finally, explanatory variables/covariates in the models are a relatively simple collection of measures for which entirely unsatisfying justification is provided. But that doesn’t matter so much when the dependent measure is complete crap.

On Death Penalties for Schools and Misplaced Outrage

This is an issue I’ve written much about over time – the persistent failure of New York State to fund its highest need public schools, and more recently, the audacity of state officials to place blame for their own egregious failures on the teachers and administrators in the state’s least well-funded school districts. Here’s a recap of previous posts:

  1. On how New York State crafted a low-ball estimate of what districts needed to achieve adequate outcomes and then still completely failed to fund it.
  2. On how New York State maintains one of the least equitable state school finance systems in the nation.
  3. On how New York State’s systemic, persistent underfunding of high need districts has led to significant increases of numbers of children attending school with excessively large class sizes.
  4. On how New York State officials crafted a completely bogus, racially and economically disparate school classification scheme in order to justify intervening in the very schools they have most deprived over time.

Much like my recent posts regarding the completely misinformed bluster of pundits like Andy Smarick regarding Philadelphia, when I read stuff like this from Joe Williams of Dems of Ed Reform – I get a little irked!

This column from Joe Williams of DFER goes on the attack against those who would criticize NY Governor Cuomo’s call to impose the “death penalty” on failing schools. Williams asserts that any opposition to Cuomo’s statements can be rooted in nothing other than union/teacher self-interests. That there clearly is no possible case, on behalf of parents and/or children, for opposing Cuomo’s death penalty option. It’s just the right thing and only thing to do on behalf of suffering parents and children.

In New York, to cite yet another example, the state teachers union wasn’t happy that Gov. Andrew Cuomo had the audacity to suggest that the public – including the state Government – shouldn’t tolerate schools which persistently fail to educate children. The union’s flacks quickly seized on Cuomo’s descriptive use of the term “Death Penalty” for failing schools. We can only assume they we’re pretending to be outraged on behalf of homicidal maniacs on Death Row or something clever like that.

Thankfully, Cuomo wasn’t distracted by the manufactured outrage at NYSUT headquarters. Yesterday, he stuck to his guns, telling the Buffalo News that he was going to stand with parents, students, teachers, and taxpayers in fighting often-decades-long failure. Amen.

http://www.dfer.org/blog/2013/09/grabbing_the_bu.php

So, let’s take a look at some actual data on how well Governor Cuomo has been looking out for the interests of those disadvantaged children and families trapped in low performing schools and districts around New York State.

To review my previous posts, New York State has a funding formula that bases the amount of funding each district theoretically needs in order to achieve desired outcomes on the average spending of districts that do achieve those outcomes… and then attaches weights to account for additional student needs and regional costs.  After setting this target funding figure, the state determines the amount that should be paid for with local tax revenue sources and the amount that should be paid with state aid.

The state sets a state aid target for each district to aid in reaching their adequate spending target.

I’ll set aside entirely the really big and important question of whether these targets set by the state are actually adequate.

So, we’ve got two targets here and as I’ve shown previously, the state under the leadership of Governor Cuomo has missed both targets by long shot – and has especially missed those targets for districts serving the children with the greatest needs. Since I’ve beaten this issue to death in several previous posts, I’ll provide only a short review here.

This first figure shows the size of the average STATE AID TARGET GAPS – or amount per pupil that the good Gov’ Cuomo has deprived these children of – for the 2013-14 school year. Notably, the state aid shortfalls- the amount the state underfunds its own formula – grow bigger and bigger as the state’s own pupil need index goes higher and higher. The huge bowling ball here is New York City. I’ve have noted a few standouts from past posts, including Utica and Poughkeepsie, and I’ve include Buffalo here because it seemed to have been the target of the death penalty comments.

Figure 1.

Slide3

This second figure shows the average gaps of both types described above, by the average shares of children qualified for free or reduced priced lunch in school districts facing those gaps.  This graph shows the average gaps of both types. Notably, the lowest poverty districts do spend, on average, more than they need to achieve adequate outcomes, even though they are not receiving their full state aid allotment. They simply have the local capacity to offset these losses – a capacity that higher poverty districts don’t have – and under the Governor’s tax limit policies – couldn’t even use if they did!

Figure 2.

Slide1

Yeah… that’s right, the good Gov’ who is clearly the only one trying to do right by kids and parents here (according to the bloviating Williams) a) has deprived districts in some cases of over $6,000 per pupil in state aid they are supposed to get, and b) has imposed local tax limits that prohibit those districts from even partially closing the gap the state – the Governor – has created for them.

But hey… it’s all for the kids, right? At least he’s not a union lacky just lookin’ out for himself.

Let’s hit a few more figures here, linking the Governor’s death penalty claims with the funding shortfalls he persistently endorses. This graph shows the average spending gaps of districts of schools falling in the state’s accountability classifications – where presumably, those Priority Schools are the ones on death row.

Figure 3.

Slide2

Like other states with approved NCLB waivers, New York has adopted a modified performance classification scheme to identify those schools and districts subject to the most immediate interventions.

Using 2010-11 school year results, NYSED will identify as Priority Schools the lowest achieving district and public charter schools in the state based on combined ELA and math assessment results or graduation rate for the “all students” group, if these schools are not demonstrating progress in improving student results. The Department will identify any district with at least one Priority School as a Focus District. If a district is among those with the lowest achieving subgroups in ELA and mathematics combined or for graduation rate and is not showing improvement, the district will also be identified as a Focus District. These districts in turn will be required to identify, at a minimum, a specified number of schools as Focus Schools.[1]

Under this model, the state assumes no blame for a district’s or school’s “failure” to achieve measured outcome goals, but grants itself additional authority to impose significant structural, programmatic and staffing changes. By design of this system, the fault lies with district and school management and operations and the quality of teachers delivering the curriculum. Schools identified as priority schools and districts identified as focus districts are unlikely to receive substantive additional financial resources from the state but will face additional accountability and potential restructuring requirements.

Though unlikely to be a successful strategy with the state as arbiter, districts so severely underfunded by the state and serving high need student populations should push back against the state on the following basis:

Districts with schools that have been preliminarily identified as Priority Schools, as well as preliminarily identified charter schools, that believe that there are extenuating or extraordinary circumstances that should cause the school to not be so identified may petition the Commissioner to have a school removed from Priority status. These petitions will be due two weeks from the date of notification that a school has been preliminarily identified as a Priority School. (p. 6) [2]

That is, it might be a logical strategy to use the state’s own dramatic underfunding of the state’s own estimate of adequate funding as basis for arguing extenuating circumstances.  Until the state at the very least meets its own minimum funding obligation, the state should have little authority to force additional requirements or structural changes on these districts. The state must accept at least partial blame for current conditions, if not the lion’s share.

Okay… just a few more to reinforce my point here. These next few graphs compare school level 2013 8th grade outcomes with district level spending gaps – leaving out New York City. Priority schools are indicated in Orange. Indeed, Priority schools are very low performing especially on the new state assessments. But notably, all of the priority schools in these figures are also in districts that spend $2,000 to $6,000 less per pupil – as a direct function of state aid deprivation – than the state itself estimates that they need in order to achieve desired outcomes.

For the stat geeks, the r-squared for each of these is around .50 – that is, spending gaps alone explain 50% of the variance in the outcomes. Below, I provide the multiple regression output.

Figure 4.

Slide4

Figure 5.

Slide5

So, before making calls to impose the death penalty on failing New York State schools, I would argue that the Governor should take a hard look at his own policies of recent years, before placing blame – vilifying teachers and other school officials – and assuming easily attainable revenue-neutral solutions.

Put simply, what the New York public should NOT tolerate, is a Governor and Legislature who refuse to provide sufficient resources to high need schools and then turn around and blame the schools and communities for their own failures. (all the while, protecting billions of dollars in separate aid programs that drive funds to wealthy districts).

Appendix

Table 1 provides a multiple regression analysis which asks the question – to what extent are spending gaps associated with outcomes, among schools with similar percentages of low income or non-English speaking children, in the same year.  In other words, are the spending gap to outcome relationships displayed in previous figures merely a function of the relationships between outcome gaps and student population characteristics, and spending gaps and student characteristics?  Table 18 shows that in each case, for each outcome measure, outcome gaps are associated with spending gaps, even among districts with similar student needs. A$1,000 reduction in spending gap is associated with a 3.3% increase in 4yr college attendance, 1.1% increase in postsecondary attendance, 1.2% increase in 8th grade math scores and 1.4% increase in 8th grade ELA scores.

Table 1.

Slide6

Smoky Mountain Smokescreen: A Tennessee Story

My last post was about the Commonwealth of Pennsylvania’s role in starving the Philadelphia school district into submission. The failure by deprivation of the city district has now been used as a basis for blaming the district and its employees – primarily teachers, for that failure.

Of course, once the district has been quietly squeezed into submission over time, the obvious reformy answer for fixing Philly schools (along with expanding the policies that have not worked so well for the past 10 years, including charter expansion and private management), is to subvert existing employee contracts and district/city policies to break the union stronghold that protects the interests of teachers over those of children. Two steps toward this end game include eliminating “last in, first out” layoff preferences and adopting “mutual consent” teacher placement (save discussion of slashing contractually obligated pensions for those who put in years of service at modest wages for another day).

These are classic smokescreen reforms which a) have little to do with the district’s current mess and b) do little to improve conditions. First of all, a simple back of the napkin cost-benefit analysis shows that the supposed gains from replacing seniority based layoffs are very small [nickles & dimes won’t close this gap]. Second, yet another study has (first study summary, second study) shown that seniority provisions in district contracts aren’t associated with or a drive within-district, between-school disparities. Besides, it’s not like “within district” disparities across schools were/are the primary problem facing Philly!?!

The bottom line is that none of this stuff has anything to do with actually improving the conditions of public schooling in Philadelphia. If proponents of these resource-free (yeah… $50 million in the Philly context is still relatively resource-free) policy changes really think it does, then they are even more clueless than I thought.

But this post isn’t about Philly… well… okay… the first part is. This post is about an entire state that has taken a similar approach – Good ol’ Tennessee. Yeah… that’s right… racin’ to the top Tennessee.

And this post is about yet another, emerging reformy smokescreen! Teacher licensure reform!

There’s a whole lot goin’ on in Tennessee these past few years, and weeks. Most notably, in recent weeks Tennessee was praised by U.S. Secretary of Education Arne Duncan for its changes to teacher licensure.

“I want to praise Tennessee’s continuing effort to improve support and evaluation for teachers. For too long, in too many places, schools systems have hurt students by treating every teacher the same – failing to identify those who need support and those whose work deserves particular recognition. Tennessee has been a leader in developing systems that do better—and that have earned the support of a growing number of teachers. Tennessee’s new teacher licensure rules continue that effort, by ensuring that decisions on licensure are informed by multiple measures of their effectiveness in the classroom, including measures of student learning. The new system also adds reasonable safeguards to make sure any judgment about teacher performance is fair.”

http://www.ed.gov/news/press-releases/statement-us-secretary-education-arne-duncan-tennessee-making-changes-teacher-li

Under these new policies, teachers in Tennessee will have to produce student test score gains to obtain, or keep their teaching license and to keep their jobs/careers.  After all, it is well understood that overpaid lazy unionized teachers with fat pensions are the undeniable cause of Tennessee’s persistently low NAEP scores.  Oh wait… Tennessee already had very weak union protections… coupled with their low NAEP scores… silly me (complete post).

Yep, that’s right. Teacher tenure and license renewal in Tennessee will now be subjected to a roll of the dice!

Tennessee will strive through aggressive deselection, via licensure requirements, (of the 1/3 for whom scores can be generated), to achieve a statewide system of Irreplaceables!

The true reformy brilliance here is that these changes, with little doubt, will cause the best teachers from around the region and even from Finland, Shanghai and Singapore to flock to Tennessee to teach…at least for as long as they don’t roll a 1 and lose their license (pack your dice!).  In fact, it is a well understood reformy truth that the “best teachers” would be willing to take a much lower salary if they only knew they would be evaluated based on a highly unstable metric that is significantly beyond their direct control. That’s just the reformy truth! [a reformy truth commonly validated via survey questions of new teachers worded as “don’t you think great teachers should be rewarded?” and “Wouldn’t you rather be a teacher in a system that rewards great teachers?”]

No money needed here. Salaries… not a problem.  Resource-Free Reformyness solves all!

All that aside, what do we know about the great state of Tennessee?

Let’s take a visual/graphic stroll through some of these issues.

First, here’s the relationship between funding effort (state and local spending as a share of gross state product) and funding levels. Specifically, this graph looks at the predicted state and local revenues (based on the model used in our funding fairness studies, updated with 2009-2011 data) for districts with high poverty concentrations.

Figure 1.

Slide1

Hmmm… Tennessee is certainly no standout there – well – actually it kind of is – and not in a good way – better than Arizona I guess…slightly. Really low spending… and really low effort to get them there. But heck, schools don’t need money… they need reformyness! Just like Philly!

Besides, with some solid teacher compensation reforms – dumping the lazy overpaid deadwood – a little pension slashing – tenure based on test scores… license renewal based on test scores – we can have the greatest teachers in the world (or at least close to Finland) and maybe even spend less than Arizona!

Here is the current relationship between the average “competitive wage” for teachers and funding effort. Here, competitive wage is based on a regression model of U.S. Census data in which I compare the average teacher wage, on an hourly basis (controlling for hours per week and weeks per year) with the wages of non-teachers at the same age and education level (among only those with a BA or MA). 100%, or 1.0 means teacher wages are roughly at parity with non-teacher wages on an hourly basis (other models, such as the one here, typically produce lower relative wage estimates for teachers).

Figure 2.

Slide2

So, it would seem, that teacher wages in Tennessee overall aren’t that competitive.  And relative wages matter! But hey… what’s it matter if we throw in a little more career uncertainty!

Here is Tennessee’s public school funding effort with respect to the income gap between public and private school enrolled children – public school household income to private school household income ratio. Hmmmm… it doesn’t look like Tennessee’s higher income households are particularly invested in the public system.

Figure 3.

Slide3But heck… we know that those higher income families will flock back to the public schools as soon as they can rest easy knowing their child’s teachers will only keep their license if their child cranks out sufficient test score gains!?!

Now, it’s one thing for Tennessee politicians to move forward with these teacher licensing policies with their own political goals in mind, ignoring the real issues – their persistent underfunding of the entire state system for decades (or more).  And it’s one thing for someone like Andy Smarick to be so belligerently uniformed about Philadelphia.

It is yet another, however, for the U.S. Secretary of Education to continue patting state and local school officials on the back for completely ignoring the real issues severely undermining their public education system.

My point here is that we all need to start looking at the BIG PICTURE regarding these state systems of schooling – the context into which new policies, new strategies, “reforms” if you will, are to be introduced. As I’ve noted previously, even if some of these reform strategies might be reasonable ideas warranting experimentation, whether charter expansion or teacher compensation and licensure reform, none can succeed in a system so substantially lacking in resources, and none can improve the equity of children’s outcomes unless there exists greater equity in availability of resources.

Yeah… I know it’s tough for the punditocracy, the ignorati as some have called them, to actually try to contextualize reform proposals to better understand the complexities of actually makin’ stuff work.  In fact, I’ve grown to understand that some of them, on either side of the aisle, really don’t care.

But there’s no excuse for the U.S. Secretary of Education to do the same…

Over…

Over…

and Over again!

Please stop the madness!

Debunking Reformy “Messaging”: A Philadelphia Story

Let’s take another trip back to Philadelphia for the day, because the reformy conversation around Philadelphia is just so darn illustrative of how reformy thinking works. Here’s a synopsis of the reformy approach to pushing pre-established, fact free, ideological reforms:

  • Step 1: Create a story line
  • Step 2: Find a poster child (school district, city, etc.)
  • Step 3: Conjure some reformy buzz phrases (“failed urban district” & “sector agnosticism”)
  • Step 4: Repeat, over and over and over again… with complete disregard for facts or evidence to the contrary

Nowhere is this thinking more evident than in recent Twitter activity of Andy Smarick. Let’s take a look at a few recent tweets. First, the broad crisis oriented storyline- the monolithic “urban school district” is a massive freakin’ failure. They all stink. It’s their own fault (let’s ignore urban planning and development, white flight, state school finance systems & tax policy, and the like). Crappy management – high paid bureaucrats in charge, overpaid, lazy teachers waiting out their time to collect huge pensions and bankrupt the city… that’s how it all works.

And of course, don’t forget that year, after year after year… all we’ve ever done is throw more and more money at these bureaucrats and teachers… and all they’ve done is pocket it and waste it… and really not give a crap about the kids. Enter Smarick’s seemingly favorite poster child district – Philadelphia.

Add to that some great certainty of knowledge about the city:

Certainty is really important in reformyland… especially if you have all of your facts completely wrong! Especially if nothing in your story line actually matches up with reality. If that’s the case, be wrong loudly and repeatedly. Don’t back down.  Rule #1 in the reformy story line.

[Now, one might accept Smarick’s claim that Philly’s total state aid likely does exceed all other districts in the state. But that comparison reveals a whole new level of ignorance. Philly is actually larger than most PA districts? Yep… & Philly’s local revenue raising capacity (while better than some) is pretty weak. Overall, per pupil state and local resources in Philly (the right comparison) are pretty darn low as discussed below.]

So, let’s recap here. The story line is that urban school districts are an evil monolithic blob that eats up poor, disadvantaged kids.  They all suck.

That is the status quo! No doubt about it.

They must be dismantled. The must be closed and charterized.  They can’t be fixed. It’s that simple.  It all just requires a rethinking… a relinquishing (read “submission) of control to those necessarily better charter operators. Mind you, we only want charter operators who are among the “above average” group.  ‘Cuz we all know that while charter schools, on average, are average, the really good ones are above average!

Arguably, the most important step in the reformy story line development above is selection of the poster child, and then perhaps validating that the poster child is somehow representative of others – you know… so that the whole idea is scalable.

So, what would be required here, to validate that we have the right poster child?

Well, you’d probably want to find a district that has actually seen some infusions of funding over time, for naught.

You’d probably want to find a district that hasn’t already been adopting the strategies you propose as the solution (for over 10 years).

That is, you ought to vet your poster child… at least at some level.

But alas, this would require the very slightest effort to look at some numbers… gosh no… not math… not data… and read some real research… rather than think tank goo from the reformy echo-chamber.

So, what is the status quo in Philly?

For the past 10+ years, Philly has seen rapid expansion of charter schooling, and Philadelphia charter schools have generally not topped the list of stellar performers.

For the past 10+ years, Philly has tried outsourcing management of large numbers of schools to private management companies, including Edison, where the research conducted on these reforms seemed to suggest that resources, not management type, mattered more.

Oh yeah… and they’ve even tried “weighted student funding,” an oft-relied on reformy distraction from real equity concerns. (and one that doesn’t work so well if you simply don’t have the money to redistribute).

For the past few decades, Philly public schools have been systematically financial deprived as a function of one the nation’s most inequitable state school finance systems. To review:

  1. Pennsylvania has among the least equitable state school finance systems in the country, and Philly bears the brunt of that system.
  2. Pennsylvania’s school finance system is actually designed in ways that divert needed funding away from higher need districts like Philadelphia.
  3. And Pennsylvania’s school finance system has created numerous perverse incentives regarding charter school funding, also to Philly’s disadvantage. (see here also)

The Philly area remains among the most racially and economically segregated areas in the nation.

So wait a second… the actual status quo in Philly is reformyness itself?… not throwing money at the problem. For more than 10 years, Philly has been an experiment in resourceless (but for some funding applied through the privatization venture in the early 2000s) reformyness.  So, if Philly is the poster child here, then perhaps the story line has some pretty significant flaws.

But don’t let the facts get in the way!

What do the Numbers Look Like for Philly?

First, here is the state and local revenue per pupil for Pennsylvania school districts in the Philly metro area with respect to poverty.

Figure 1

Slide1

Second, here’s the current operating expenditure per pupil for Pennsylvania school districts in the Philly metro area with respect to poverty.

Figure 2

Slide2

As I’ve noted, over and over and over again… no-one’s been throwin’ money at Philly… not now, not two years ago… not five years ago… not further back than that!

Figure 3

Slide4

And you know what, it’s not because Philly is just throwing all of their money into their own low poverty schools. The disparity that exists at the district level passes right along to the school level.

So forcing Philly to adopt a decentralized weighted student funding formula in order to fix their own equity problems really isn’t a major solution either! Wait… already done that!

Figure 4

Slide3

Actually, the only one doin’ money throwin’ here is arguably Lower Merion School District.  But hey, Lower Merion must be pretty far away geographically. Perhaps they are in a remote, rural area, where they need to spend more due to population sparsity or economies of scale.  Or perhaps not.  Here’s a map showing the locations of schools (by % Free Lunch) and districts by % Black in the Philly area.

Figure 5

Slide5

So wait, Lower Merion is just a wealthy white suburb… right next door? And by the way… to clarify as I have on many previous posts… the big disparities here are between, not within districts. Kids are segregated largely between, not within districts. We have rich districts, white districts, poor districts, black districts. We have poor, minority schools in poor minority districts and richer whiter schools in richer whiter districts. It is actually that simple… almost. And in Pennsylvania, poorer minority schools are sadly lacking in state support.

Now, let’s take a quick look at the patterns of “chartering” that have occurred by 2011. Charters have a little star on them. Sorry, no gold star. I’m not in the business of handing those out. First of all, we see that charters only exist in districts with more black students and more low income schools. Charters aren’t flourishing in the Philly ‘burbs, like Lower Merion! (that’s because they must have “great” schools!?).

As I’ve noted on previous posts, this means that larger shares of low income and minority students (and their teachers) are potentially subjected to greater deprivation of constitutional and statutory protections – unless states step in to clean up their charter laws.

Now let’s look a little closer. As if the Philly area wasn’t already sufficiently segregated, what we see here is that within Philly, several charter schools seem to be serving relatively low shares of low income kids (qualifying for free lunch) when compared with surrounding district schools. Most district schools are bright red here… while several charters… well… are not.

So, what’s happening with charter expansion in Philly is an increase to socioeconomic segregation in some areas… but little or no attempts to correct resource disparities.

Figure 6

Slide6

Wow… seems like that reformy story line has a few cracks in it, eh?

But hey, don’t let the facts get in the way.

Why “chartering” & “sector agnosticism” isn’t the solution for Philly

Let’s start by reiterating the point that too much funding, classic bureaucratic waste, not enough choice/charters and not enough privatization ARE NOT the problem in Philly.

So, here’s a quick summary of why chartering and “sector agnosticism” aren’t the simple, logical solution for Philadelphia as the post child for the failed urban school district.

  1. Chartering seems to simply be leading to greater segregation of the already segregated, leaving behind even higher concentrations of more disadvantaged kids in district schools
  2. Pennsylvania charter schools don’t seem to have a particularly strong record of academic performance, despite their propensity to sort.
  3. Chartering, as has been practiced thus far, leads to substantive deprivation of student and employee constitutional and statutory protections. Worse, when chartering is adopted as the solution solely for poor, minority contexts, then it is poor and minority students who disproportionately forgo these rights, most of the time unknowingly.
  4. Chartering, as has been practiced thus far, has reduced fiscal and governance transparency, as charter managers/operators increasingly shield their records under private governance (contract information, financial dealings, real estate holdings/dealings, etc.).
  5. Even if we accept a “sector agnostic” perspective – acknowledging  the transparency and rights concerns – success requires resources.  Equitable and adequate funding is a prerequisite condition for improving conditions in Philadelphia.

Like I said in a previous post. The ridiculous must stop. The buzz phrase reformyism, shallow logic, and lack of disciplined inquiry must be replaced with more thoughtful and measured analysis, thinking and ultimately policy development.

As far as Philadelphia is concerned, real reform must begin with resources!

“Corporate Reform” or Failed, Desperate Corporate Management?

I suspect there are a lot of readers of my blog and twitter followers who frequently use the phrase “corporate reform” to characterize the current heavily privately financed movement to push specific “reforms” to public education systems.  My readers may not have noticed, but I tend not to use this phrase. I have a few reasons for my avoidance of this term.  First, it’s my impression that the term necessarily implies corporate to mean “evil.” That a corporate mindset – meaning private sector for profit business mindset can do no good. I’m cynical, but not that cynical.  I actually do think there are good, for profit corporations out there. Perhaps they are dwindling in their numbers and power base, but I still think they exist.

But here are my main reasons why I don’t roll with the whole “corporate reform” lingo. That the education reforms being pushed – that are cast as “corporate reforms” – a) really aren’t that common in private sector for profit business and b) they suck – even in (perhaps especially in) private for profit business. The supposed “corporate reforms” being advocated for the takeover of public education are reasonably well understood among analysts of private for profit business to be failed models. Models of desperation forcibly implemented by CEOs of businesses in decline – CEOs who often are on the verge of their own ouster due to their persistent failures of leadership. Thus, their solution – their secret sauce – blame the employees – force groups of employees to beat the hell out of each other – distracting from the failures of leadership. Sound familiar? Well, here are two vivid cases that should sound familiar.

The Portfolio Model at Sears

One popular component of what is referred to as the corporate reform movement in public education is the replacement of traditional public districts with a portfolio of public and private providers of schooling options who will compete to attract students and be accountable for posting good test scores. Thus, all boats will rise as a function of competitive pressures – and no child will be left without great schooling alternatives. A wonderful replacement for our current failing urban schools, right? Well, as I’ve explained previously, the system we’ve put in place to implement and evaluate schools under such models doesn’t actually work this way. Large segments of students go un-served entirely, as in New Orleans.  Schools aggressively cream skim each other’s desired students in order to post good numbers, and shed masses of students that don’t aid them in the rat-race.  The model has evolved over time from portfolio to parasitic, or perhaps even cannibalistic.

But hey, this stuff works great in the private sector, so why shouldn’t it work well for schools?

Not so fast. One of the most apt comparisons might be the recent follies of Sears.  The title of this article says it all:

At Sears, Eddie Lampert’s Warring Divisions Model Adds to the Troubles

Ya’ see, Eddie Lampert figured, like “ed reformers” that if we could simply capitalize on the inherent greed and selfishness of individuals (“rational” behavior as described in econ literature) in the corporate workforce, we can get them to work harder and harder to out-compete each other to achieve greater financial reward, and the obvious result will be greater profitability for the company as a whole? Right. The way to do this would be to break Sears into several parts, and make those parts compete with each other to post good measurable outcomes. As described in the article:

Although Lampert is notoriously media-averse, he agreed to answer questions about Sears’s organizational model via e-mail. “Decentralized systems and structures work better than centralized ones because they produce better information over time,” Lampert writes. “The downside is that, to some, it appears messier than centralized systems.” Lampert adds that the structure enables him to evaluate the individual parts of Sears, so he can collect “significantly better information and drive decision-making and accountability at a more appropriate level.”

Lampert created the model because he wanted deeper data, which he could use to analyze the company’s assets. It’s why he hired Paul DePodesta, the Harvard-educated statistician immortalized by Michael Lewis in his book Moneyball: The Art of Winning an Unfair Game, to join Sears’s board. He wanted to use nontraditional metrics to gain an edge, like DePodesta did for the Oakland Athletics in Moneyball and is trying to repeat in his current job with the New York Mets. Only so far, Lampert’s experiment resembles a different book: The Hunger Games.

Personally, I enjoy that this is another example of using Moneyball as an excuse to implement a painfully ignorant adaptation of the concept.  How many times have we heard test-based teacher evaluation advocates similarly mindlessly invoke the moneyball comparison?  Far more predictably, as described above, the result was Hunger Games (which is far more applicable than moneyball to current ed reform strategies in so many ways).

As the article further explains, quite predictably:

As some employees had feared, individual business units started to focus solely on their own profitability and stopped caring about the welfare of the company as a whole. According to several former executives, the apparel division cut back on labor to save money, knowing that floor salesmen in other departments would inevitably pick up the slack. Turf wars sprang up over store displays. No one was willing to make sacrifices in pricing to boost store traffic.

Further:

Former Sears executives say their biggest objection to Lampert’s model is that it discourages cooperation. “Organizations need a holistic strategy,” says Erik Rosenstrauch, former head of Sears’s DieHard unit, who is now CEO of Fuel Partnerships, a retail marketing agency. As the business unit leaders pursued individual profits, rivalries broke out. Former executives say they began to bring laptops with screen protectors to meetings so their colleagues couldn’t see what they were doing.

Appliance maker Kenmore is a widely recognized brand sold exclusively at Sears. Under SOAR, the appliances unit had to pay fees to the Kenmore unit. Because the appliances unit could make more money selling devices manufactured by outside brands, such as LG Electronics, it began giving Kenmore’s rivals more prominent placement in stores. A similar problem arose when Craftsman, Sears’s beloved tool brand, considered selling a tool with a battery made by DieHard, also owned by Sears. Craftsman didn’t want to pay extra royalties to DieHard, so the idea was quashed.

And here are some more detailed examples:

The bloodiest battles took place in the marketing meetings, where different units sent their CMOs to fight for space in the weekly circular. These sessions would often degenerate into screaming matches. Marketing chiefs would argue to the point of exhaustion. The result, former executives say, was a “Frankenstein” circular with incoherent product combinations (think screwdrivers being advertised next to lingerie).

Eventually Lampert’s advisory committee instituted a bidding system, forcing the units to pay for space in the circular. This eliminated some of the infighting but created a new problem: The wealthier business units, such as appliances, could purchase more space. Two former business unit heads recall how, for the 2011 Mother’s Day circular, the sporting-goods unit purchased space on the cover for a product called a Doodle Bug minibike, popular with young boys.

The details in this article are wonderfully applicable to portfolio management of urban schooling.  Please read the rest of it, and ponder it in relation to some of my other posts, like this, or this.

So, with respect to portfolio, I mean parasitic… or perhaps cannibalistic management strategies, I’ll go all reformy for a moment and adopt the phrase “sector agnosticism.” This strategy, often cast as a major element of “corporate reform,” is a failed strategy of the corporate sector and equally toxic in public education.  Indeed, the foolishness behind this approach knows no sector boundaries.

Note: interestingly, the article points out that one possible benefit of Lampert’s strategy is that if Sears were to fail so miserably that they eventually had to start selling off their parts, the decentralization of the company and establishment of independent boards for each unit facilitates that process.

IBM’s “Bad Employee” Problem and the Solution that Wasn’t

We all now know that the reason for our failing public education system is “bad teachers.” Teachers with fat pensions, big salaries and who are totally unaccountable for anything, really – especially for helping their students actually get those good test scores that pave the pathway to their future. And that the path to fixing our public education woes is to fire our way to Finland, and to use, really any variant, good bad or indifferent, of student test score growth to sort out the good teachers from bad and to ease the process of getting rid of the bad and incentivizing the good. Obviously, this is how any good private sector business works and so too, it should in schools. After all, we all know that teaching is the only profession where individuals aren’t paid based on their performance, or more specifically, based on a very noisy (and statistically biased) regression estimate of math and reading questions answered by 8 to 13 year old children who happen to spend a few hours of weekdays for 10 months with them. Right?

Let’s go back 20+ years now, to what b-school types actually seem to refer to as a “John Akers moment.” And just what is a “John Akers moment” you ask? Well, John Akers was CEO of a declining IBM in the early 1990s.  The simple response by Akers was to blame the employees, by constructing a new, toxic, employee evaluation scheme. Here’s how that eval  scheme was described at the time:

To identify the best and worst employees, every manager at IBM, beginning this year, will use a seven-page annual evaluation to rate employees on a scale of 1 to 4, with 10 percent receiving the top and bottom grades, and the rest getting 2s and 3s.

The managers will also rank employees by their relative contributions to the business. People who get high rankings are eligible for bonuses, while workers with the lowest grades will be given three months to improve performance or lose their jobs.

IBM says it is not abandoning its no-layoff policy. Rather, in trying to raise performance standards, it is retaining only the best people. “In the competitive world we`re in, we can`t drag along folks who aren`t“ making the grade, said Walton E. Burdick, senior vice president of personnel.

What do IBM employees think? “There are feelings that (IBM chief executive John) Akers has been screwing up, and now he`s turning around and trying to blame others,“ said a 10-year IBM employee who asked not to be named.

The employee`s story shows what a slippery slope IBM may be on. She said she received the second-highest rating — a 2, on what had been a 1-to-5 scale — for most of her career. A few years ago, she got a new boss and her grade slipped to a 3. She thinks the downgrading has more to do with her request for a job transfer than any change in her performance. Now, she says, she is in danger of a 4.

http://articles.sun-sentinel.com/1992-02-03/business/9201060700_1_ibm-employees-ibm-chief-executive-ratings

Hmmm… does that sound familiar. Needless to say, Akers plan did not save IBM. Nor did it save Akers, who was ousted soon after.

But some other brilliant leaders in the tech industry, most notably Microsoft, did latch on to the IBM strategy… as a step toward their own long run stagnation. Heck, why would Microsoft ever consider veering from its path of simply copying and implementing even less efficiently, what others have already done? It’s gotten them this far.

This article from July 11, 2013 characterizes current conditions at Microsoft as analogous to IBM in 1992.

Most notably, this article explains that one of Microsoft’s greatest barriers to succeeding in their most recent (desperate) attempts to restructure, is the company’s toxic employee evaluation scheme, as described previously in Vanity Fair:

Major restructuring at any company is almost always traumatic, but Microsoft’s ultra-competitive corporate culture will amplify the impact.

Last year a Vanity Fair magazine story described Microsoft’s debilitating employee ranking system, in which team leaders are forced to hand out reviews based on a quota system. So at least one member of each group will get a bad review, no matter how well they perform.

That system has fostered a lack of cooperation and vicious office politics, a malady that is said to run through the entire company at all levels.

http://www.marketoracle.co.uk/Article41350.html

Put simply, this idea that one can raise the overall quality of the company – even improve its productivity and profitability – by rating, degrading, and dismissing “bad techies” – is simply unfounded.

Like the portfolio mismanagement above, the toxicity of this idea knows no sector boundaries. It’s as bad in big, private sector business as it is for schools.

So you see, “Corporate Reform” as currently being pitched for schools is, in fact, FAILED corporate management strategy – often hastily adopted in a moment of leadership desperation – and rarely if ever achieving the desired turn around.

School Finance 101: Reformy Distractions, Diversions & Smokescreens from What’s Really Needed

This post is a follow up to the previous, and is based on work in progress.

=====

We conclude with a discussion of three themes in the current political rhetoric regarding school finance that we see as creating significant barriers to substantive reforms. Three arguments in particular, are pervasive in the broader education reform debate, with implications for school funding equity and adequacy:

  1. First, that through years of court challenges states have largely resolved funding inequities between local public school districts, and the major persistent problems that remain are inequities in local district budget allocations to schools.
  2. Second, that adopting broad-based, school choice programs necessarily provides equitable opportunities for children via the liberty to choose among high quality alternatives, thus negating concerns over equitable or adequate funding.
  3. Third, that local public school districts are so inefficient in their basic design and they invariably have more than enough money to do the job well, but lack of appropriate incentives, not lack of money causes their failure.

The Intradistrict Distraction

An increasing volume of rhetoric around school finance rests on claims that states have largely met their obligations to resolve disparities between local public school districts. This premise is then extended to the contention that the bulk of remaining disparities are those that persist within school districts, due to irrational and unfair school district resource allocation practices between individual schools (see, for example, McClure, Wiener, Roza, and Hill, 2008; Public Impact, et al., 2008). In short, since states have done their job to promote equity and adequacy of school funding, school district officials must now meet their corresponding obligations. This argument is also often attached to the remedy of weighted student funding (see Roza, 2006, pointing readers to the Fordham Institute’s “Fund the Child” campaign).

Notably, no leading researchers in economics and school finance have joined this overwhelming shift in emphasis away from state-level concerns. Many have opted instead for a broad description of the funding problem that encompasses both within-district and between-district resource disparities (see, e.g., Bifulco, 2005; Burke, 1999; Duncombe and Johnston, 2004; Downes, 2004; Imazeki and Reschovsky, 2004; Stiefel, Rubenstein & Berne, 1998; Rubenstein et al., 2007). Nonetheless, arguments favoring a devolution in focus from states to school districts have gained significant traction in policy debates, and they have the rhetorical advantage of providing state policymakers with an enticing, revenue-neutral policy solution (see Public Impact, et al., 2008). If states have done their job, no more money is needed, nor must these policymakers consider painful movement of limited funding away from wealthier districts. Rather, districts must simply reshuffle what they have, in order to achieve optimal distribution.

But, as dissected in great detail by Baker and Welner (2010), the increase in popularity of these political arguments is backed by little or no empirical evidence for the premise that states have already met their end of the bargain. Baker and Welner explain that studies of within-district disparities are largely confined to a few states or individual districts where school-site expenditure data have been available. Yet, notwithstanding the fact that state school finance policies are idiosyncratic, studies having oft-suspect validity from select locations have been extrapolated by prominent researchers and advocates to have broader implications for within- and between-district disparities in other states.

Baker and Welner summarize that the intradistrict distraction consists of five interconnected issues:

  1. The existence of within-district funding disparities.
  2. The extent of any such within-district disparities.
  3. The continuing existence of between-district disparities.
  4. The extent of any such between-district disparities.
  5. The relative causal importance of within- and between-district disparities.

Our best reading of the extant literature tells us that numbers (1) and (3) should be non-controversial: disparities do exist, but they vary tremendously by jurisdiction. As discussed above, the evidence regarding number (2) is very limited, which also means we can provide no answers regarding number (5). But it is number (4) that is most interestingly implicated by the recent policy push—the contention that we as a nation have made such progress on addressing between-district disparities that we can now turn our attention elsewhere. As such, a fifty state analysis of the current status of between-district funding inequities is warranted.


The Choice Diversion:  Liberty as Substitute for Equality

A second issue complicating the debate over school funding equity and adequacy is the role of choice programs including public financing of charter school alternatives and in some cases, publicly subsidized vouchers or tuition tax credits for private schools. Implicit in policy preferences for choice program expansion is the notion that more children should have the choice to attend higher quality schooling options and that such options will emerge, as a function of the competitive marketplace for quality schooling with little attention to the level of funding provided. In other words, the liberty achieved by choice programs serves as substitute for the provision of broad based, equitable and adequate financing. Studies purporting significant advantages achieved by students attending charter schools have invariably neglected to evaluate their access to financial resources, frequently downplaying the importance of money or relevance of equity traditionally conceived (Baker, Libby & Wiley, 2012).

But these arguments are merely a diversion, sidestepping whether, when applied in practice, adequate alternatives are equitably distributed. One problem with this assertion is that variation in resources across private providers, as well as across charter schools tends to be even greater than variation across traditional public schools (Baker, 2009, Baker, Libby & Wiley, 2012). Further, higher and lower quality private and charter schools are not equitable distributed geographically and broadly available to all. At the extreme, in New Orleans following Hurricane Katrina where traditional district schools were largely wiped out, and where choice based solutions were imposed during the recovery, entire sections of the city were left without secondary level options and provided a sparse few elementary and middle level options (Buras, 2011).

Baker, Libby and Wiley show that in New York City, charter expansion has yielded vastly inequitable choices. Table 1 shows the demographics, spending and class sizes of New York City charter schools, by their network affiliation, compared to district schools. Most New York City charter school networks serve far fewer children qualifying for free lunch (<130% poverty level), far fewer English language learners and far fewer children with disabilities than same grade level schools in the same borough of the city. These patterns of student sorting induce inequities across schools. But, these schools also have widely varied access to financial resources despite being equitably funded by the city. Some charter networks are able to outspend demographically similar district schools by over $5,000 per pupil, and to provide class sizes that are 4 to 6 (or more) students smaller.

Table 1

Inequitable Choices

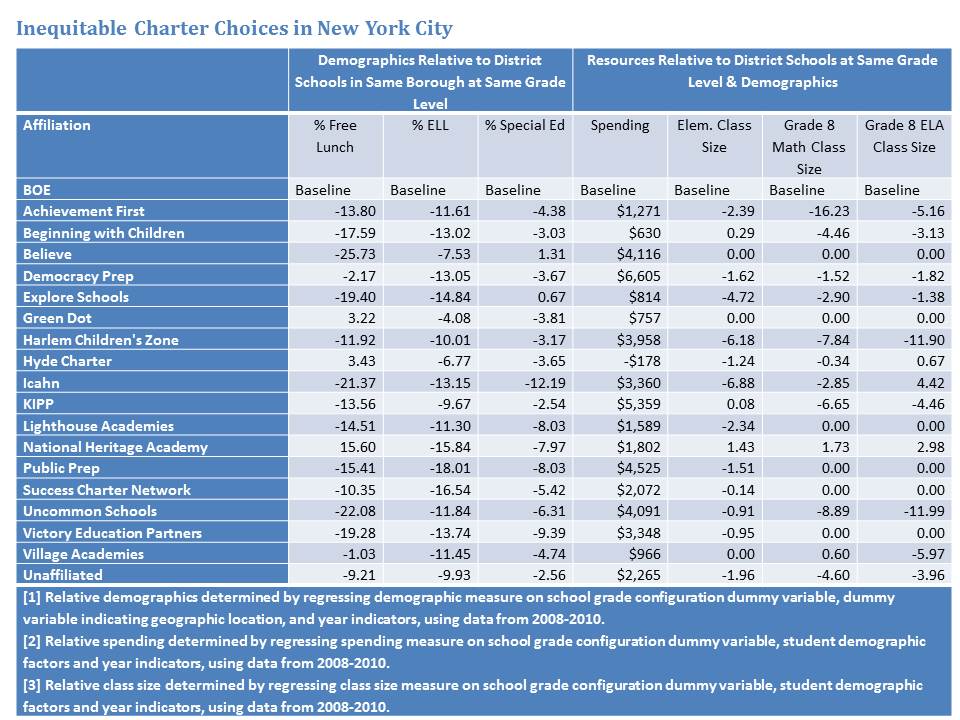
Further, these charter alternatives are not evenly distributed across city neighborhoods, nor do they all have equal unfilled enrollment slots. They need not, nor can they, accept all comers. Thus, the premise that liberty via choice programs provides a viable substitute for equitable and adequate funding for traditional public systems is, in reality, a hollow promise.

The New Normal & the Efficiency Smokescreen

 Finally, an argument that reoccurs with some consistency in debates over the adequacy of education funding is that there exists little or no proof that adding more money would likely have any measurable positive effects. This argument hinges on the oft repeated (and as frequently refuted[1]) phrase that there exists “no systematic relationship between funding and outcomes.” This argument fails to excuse the facial inequity of permitting some children attending some schools to have twice or more, the resources of others, especially where, as in New York State, higher need children are the ones with systematically fewer resources.

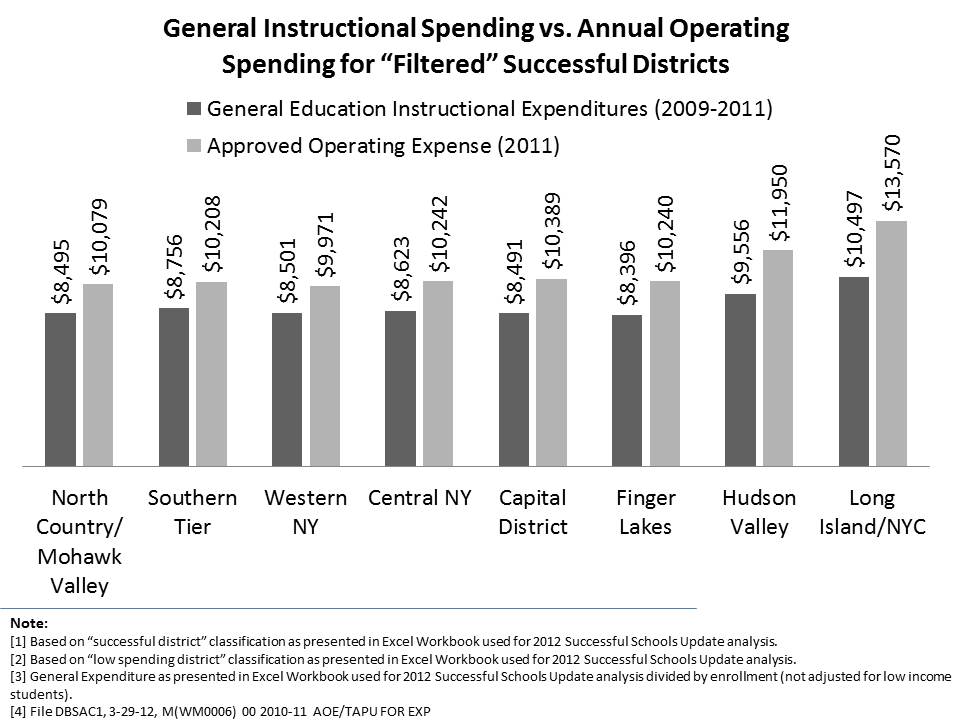
The more recent extension of the “no systematic relationship” or “money doesn’t matter” argument that has eased its way into political rhetoric and litigation regarding school spending is that all local public school districts already have more than enough money, even those with the least, and that if they simply used that money in the most efficient way, we could see that current spending is more than adequate. This assertion is echoed in the quotes at the outset of this chapter. The extension of this argument is that therefore, even cutting funding to these schools would not cause harm and does not compromise the adequacy of their funding, if they take advantage of these cuts to improve efficiency.

A version of this argument goes that if schools and districts paid teachers based on test scores they produce, and if schools and districts systematically dismissed ineffective teachers, productivity would increase dramatically and spending could decline. Further, that because improving teacher quality is argued to be more effective and less costly than smaller class sizes toward improving student outcomes, one could increase class sizes dramatically (double them[2]), recapture the salary and benefits funding of those laid-off in the process and use that money to pay excellent teachers more. Thus, educational adequacy can be achieved at much lower cost – a much lower cost that what is currently even being spent.

The most significant problem with this argument is that there exists no empirical evidence to support it.[3] It is speculative, frequently based on the assertions that teacher workforce quality can be improved with no increase to average wages, simply by firing the 5% of teachers least effective at tweaking test scores each year and paying the rest based on the student test scores they produce, or that the funding wage increases required to substantively improve the teacher workforce is necessarily dramatically less costly than maintaining equally productive smaller class sizes.

As Baker and Welner (2012) point out in a recent article in Educational Researcher, the logical way to test these very assertions would be to permit or encourage some schools and districts to experiment with alternative compensation strategies, and other “reforms,” and to evaluate the cost effectiveness, or relative efficiency of these schools and districts.  That is, do schools/districts that adopt these strategies land in a different location along the curve? Do they get the same outcomes with the same kids at much lower spending? In fact, some schools and districts do experiment with different strategies and those schools carry their relevant share of weight in any statewide cost model.

Too often, such experimentation falls disproportionately on the state’s neediest children, because the state lacks the political will to provide sufficient funding to districts serving those children. Pure speculation that some alternative educational delivery system would produce better outcomes at much lower expense is certainly no basis for making a judicial determination regarding constitutionality of existing funding.  Experimentation is no substitute for adequacy.

Regarding this theory, a three judge panel charged with hearing arguments over school funding adequacy in Kansas eloquently opined:

Here, it is clearly apparent, and, actually, not arguably subject to dispute, that the state’s assertion of a benign consequence of cutting school funding without a factual basis, either quantitatively or qualitatively, to justify the cuts is, but, at best, only based on an inference derived from defendant’s experts that such costs may possibly not produce the best value that can be achieved from the level of spending provided.

Further, that:

This is simply not only a weak and factually tenuous premise, but one that seems likely to produce, if accepted, what could not be otherwise than characterized as sanctioning an unconscionable result within the context of the education system.

And:

Simply, school opportunities do not repeat themselves and when the opportunity for a formal education passes, then for most, it is most likely gone.

The judges went on to tackle the logical extension of the state’s argument, noting that the state was effectively endorsing experimentation on children who have “no recourse from a failure of the experiment.”

If the position advanced here is the State’s full position, it is experimenting with our children which have no recourse from a failure of the experiment.  Here, the legislative experiment with cutting funding has impacted Kansas children’s K-12 opportunity to learn for almost one-third of their k-12 educational experience (2009-10 through 2012-13).[4]


References

Baker, B. D. (2012). Revisiting the Age-Old Question: Does Money Matter in Education?. Albert Shanker Institute.

Baker, B. D. (2009). Private schooling in the US: Expenditures, supply, and policy implications. Boulder and Tempe: Education and the Public Interest Center & Education Policy Research Unit.

Baker, B. D., & Corcoran, S. P. (2012). The Stealth Inequities of School Funding: How State and Local School Finance Systems Perpetuate Inequitable Student Spending. Center for American Progress.

Baker, B., & Green, P. (2008). Conceptions of equity and adequacy in school finance. Handbook of research in education finance and policy, 203-221.

Baker, B. D., Libby, K., & Wiley, K. (2012). Spending by the Major Charter Management Organizations: Comparing Charter School and Local Public District Financial Resources in New York, Ohio, and Texas. National Education Policy Center.

Baker, B. D., Sciarra, D. G., & Farrie, D. (2012). Is School Funding Fair?: A National Report Card. Education Law Center. http://schoolfundingfairness.org/National_Report_Card_2012.pdf

Baker, B. D., Sciarra, D. G., & Farrie, D. (2010). Is School Funding Fair?: A National Report Card. Education Law Center. http://schoolfundingfairness.org/National_Report_Card.pdf

Baker, B. D., Taylor, L., & Vedlitz, A. (2005). Measuring educational adequacy in public schools (Report prepared for the Texas Legislature Joint Committee on Public School Finance, The Texas School Finance Project).

Baker, B., & Welner, K. G. (2012). Evidence and Rigor Scrutinizing the Rhetorical Embrace of Evidence-Based Decision Making. Educational Researcher, 41(3), 98-101.

Baker, B.D. & Welner, K.G. (2011a). Productivity Research, the U.S. Department of Education, and High-Quality Evidence. Boulder, CO: National Education Policy Center. Retrieved [date] from http://nepc.colorado.edu/publication/productivity-research.

Baker, B. D., & Welner, K. G. (2011b). School Finance and Courts: Does Reform Matter, and How Can We Tell?. Teachers College Record, 113(11), 2374-2414.

Baker, B., & Welner, K. G. (2010). Premature celebrations: The persistence of inter-district funding disparities. education policy analysis archives, 18, 9.

Bifulco, R. (2005) District-Level Black-White Funding Disparities in the United States 1987 to 2002. Journal of Education Finance 31 (2) 172-194.

Buras, K. L. (2011). Race, charter schools, and conscious capitalism: On the spatial politics of whiteness as property (and the unconscionable assault on black New Orleans). Harvard Educational Review, 81(2), 296-331.

Clune, W. H. (1994). The shift from equity to adequacy in school finance. Educational Policy, 8(4), 376-394.

Cuomo, A (2011) State of the State. Albany, NY. http://www.governor.ny.gov/sl2/stateofthestate2011transcript

Deslatte, A. (2011) Scott: Anthropology and journalism don’t pay, and neither do capes. Orlando, FL: Orlando Sentinal. October 11, 2011

Downes, T. A. (2004). School Finance Reform and School Quality: Lessons from Vermont. In

Yinger, J. (ed), Helping Children Left Behind: State Aid and the Pursuit of Educational Equity.

Cambridge, MA: MIT Press.

Duncan, A. (November 17, 2010) The New Normal: Doing More with Less — Secretary Arne Duncan’s Remarks at the American Enterprise Institute. Washington, DC:

http://www.ed.gov/news/speeches/new-normal-doing-more-less-secretary-arne-duncans-remarks-american-enterprise-institut

Duncombe, W.D., and Johnston, J. (2004). Helping Children Left Behind: State Aid and the Pursuit ofEducational Equity. Cambridge, MA: MIT Press.

Freeman, J. (2011) New Jersey’s ‘Failed Experiment’ The new governor is on a mission to make his state competitive again in attracting people and capital. New York, Wall Street Journal. http://online.wsj.com/article/SB10001424052702303348504575184120546772244.html

Gates, W. (2011) Flip the Curve: Student Achievement vs. School Budgets. Huffington Post. http://www.huffingtonpost.com/bill-gates/bill-gates-school-performance_b_829771.html

Gist, D. (2010) National Journal. R.I. Formula Funds Children, Not Systems. http://education.nationaljournal.com/2010/06/a-funding-formula-for-success.php

Imazeki, J., and Reschovsky, A. (2004). Helping Children Left Behind: State Aid and the Pursuit of Educational Equity. Cambridge, MA: MIT Press.

McClure, P., Wiener, R., Roza, M., and Hill, M. (2008). Ensuring equal opportunity in public education: How local school district funding policies hurt disadvantaged students and what federal policy can do about it. Washington, DC: Center for American Progress. Retrieved December 20, 2009 from http://www.americanprogress.org/issues/2008/06/pdf/comparability.pdf

Public Impact; The University of Dayton, School of Education and Allied Professions; and Thomas B. Fordham Institute. (2008, March). Fund the Child: Bringing Equity, Autonomy and Portability to Ohio School Finance How sound an investment? Washington, DC: Thomas B. Fordham Institute. Retrieved December 20, 2009 from http://www.edexcellence.net/doc/fund_the_child_ohio_031208.pdf

New York State Education Department (2011). Fiscal Analysis & Research Unit. Primer on State Aid 2011-2012. http://www.oms.nysed.gov/faru/PDFDocuments/Primer11-12D.pdf

New York State Education Department (2011). Fiscal Analysis & Research Unit. Successful Schools Analysis Technical Report. http://www.oms.nysed.gov/faru/documents/technical_final.doc

Oliff, P., Mai, C., Leachman, M. (2012) New School Year Brings More Cuts in State Funding for Schools. Washington, DC: Center on Budget and Policy Priorities. http://www.cbpp.org/cms/?fa=view&id=3825  Accessed July 23, 2013

RIDE (Rhode Island Department of Education) Division of School Finance (2010) http://www.ride.ri.gov/Finance/Funding/FundingFormula/Docs/H8094Aaa_FINAL_6_10_10.pdf

Roza, M. (2006) “How Districts Short Change Low Income and Minority Students,” in Funding Gaps 2006. Washington, DC: The Education Trust.

Rubenstein, R., Schwartz, A. E., Stiefel, L., and Bel Hadj Amor, H. (2007). From districts to schools: The distribution of resources across schools in big city school districts. Economics of Education Review, 26(5), 532-545.

Stiefel, L, Rubenstein, R., and Berne, R. (1998). Intra-District Equity in Four Large Cities: Data, Methods and Results.” Journal of Education Finance, 23(4), 447-467.

U.S. Department of Education, For Each and Every Child—A Strategy for Education Equity and Excellence, Washington, D.C., 2013. http://www2.ed.gov/about/bdscomm/list/eec/equity-excellence-commission-report.pdf

Wong, K. K. (2013). The Design of the Rhode Island School Funding Formula: Developing New Strategies on Equity and Accountability. Peabody Journal of Education, 88(1), 37-47.


[1]See Baker, 2012 for a thorough critique of these arguments and their origins.

[3] For a critique of oft-cited reports making these assertions, see: Baker, B., & Welner, K. G. (2012).
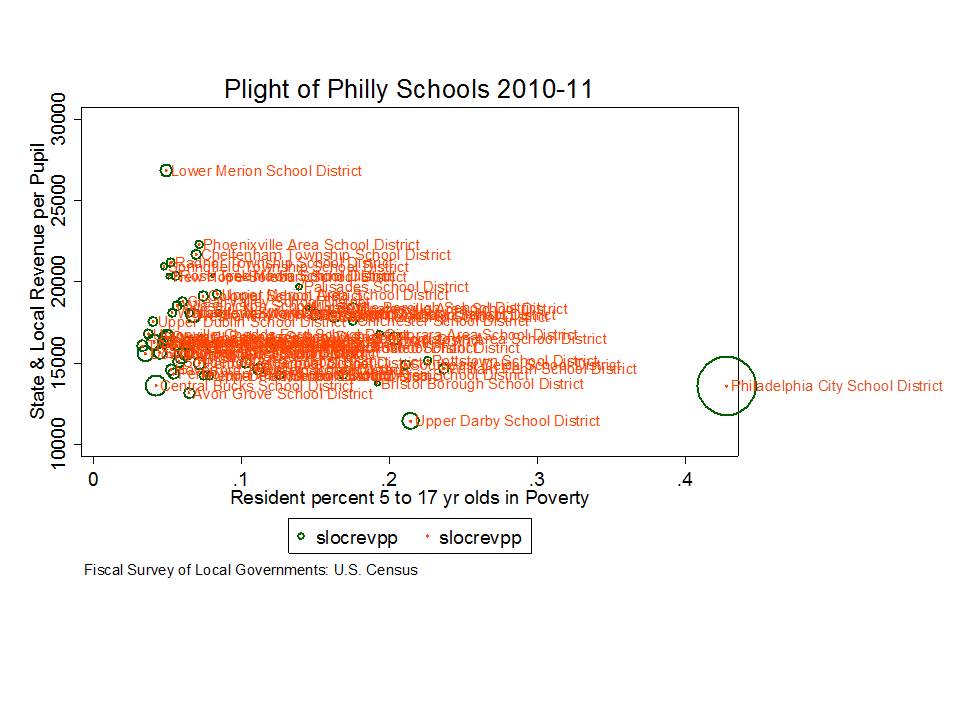
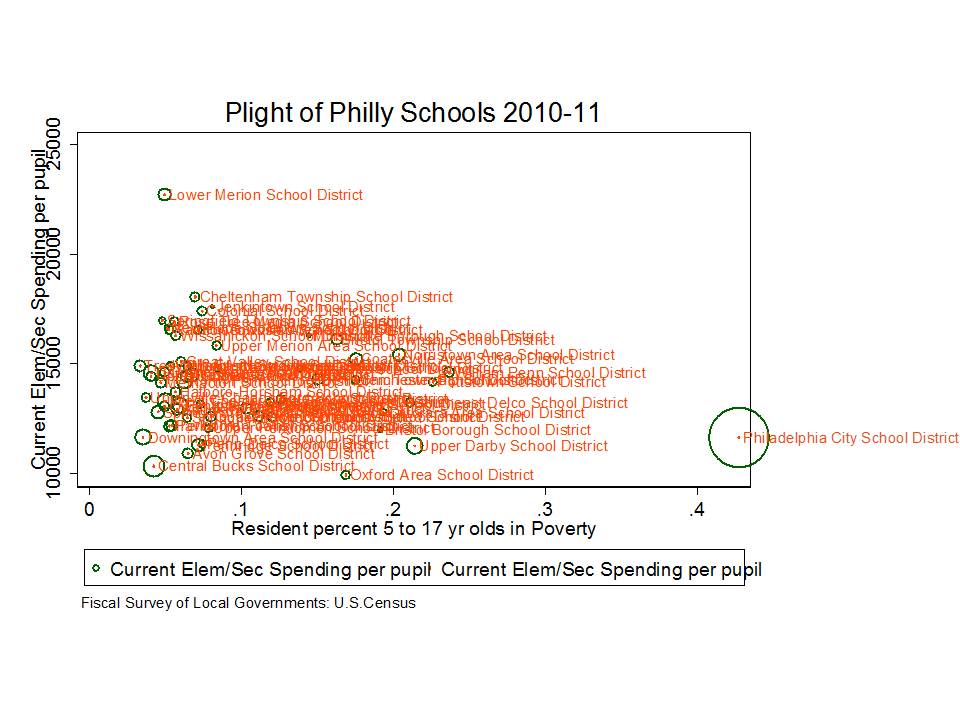
School Finance 101: Gaming Adequacy by Creating a Veneer of Empirical Validity

This post comes from a work in progress… and addresses games states play to validate their choices to spend less than might actually be needed in order to achieve desired outcome standards.  This post will be followed by another which reviews three major smokescreens commonly  used to argue that none of this matters anyway.

=====

Over the past two decades in particular, states and advocacy groups have engaged with greater frequency in attempting to define the amount of funding that would be necessary for achieving adequate educational outcomes. One might characterize the period as one of the rise of empiricism in school finance, which coincided with a shift in litigation strategies from emphasis on funding equity to emphasis on funding adequacy – specifically whether funding was adequate to either provide specific programs and services or to achieve specific measured educational outcomes.  In some cases, states have adopted their empirical strategy in response to judicial orders that the legislature comply with state constitutional mandate for the provision of an adequate education. In other cases, states have proactively set out to validate spending targets they know they can already meet (or have already been met), in order to claim school finance reform political victory.

Prior to this new “empirical era,” total state budgets would be set based on political preferences of governors and legislators regarding state tax policy and the revenues expected to be produced by the state tax system. Revenue projections, based on politically palatable tax policy, divided by the numbers of children to be served, generate the average per pupil amount of available aid.  And then the tug of war over shifting distributions toward one constituency and thus away from another, ensues.  The biggest difference between this approach and current approaches, if any, is that now, state policymakers are more likely to attempt to justify that the amount backed into via the same steps, is in fact an empirically valid estimate of the funding needed for children to achieve adequate outcomes.

Baker, Taylor and Vedlitz (2005) provide an explanation of early gaming of estimates of the costs of providing an adequate education in Illinois and Ohio in the 1990s.

Augenblick and Colleagues provide multiple cost estimates for Illinois based on different outcome standards, using single or multiple years of data and including some or all outcome standards. The higher of the two figures in Table 5 represents the average expenditures of Illinois school districts which, using 1999-2000 data, had 83% of students meeting or exceeding the standard for improvement over time. The lower of the two figures is based on the average expenditure of districts which, using 2000 data only, had 67% of pupils meet or exceed the standards, and 50% meeting standards on all tests.

Similar issues exist in a series of successful schools cost estimates produced in Ohio a year earlier. In Ohio, however, estimates were derived and proposed amidst the political process, with various constituents picking and choosing their data years and outcome measures to yield the desired result. Two Ohio estimates are provided in the table, but multiple estimates were actually prepared based on different subsets of districts meeting different outcome standards. The Governor’s office chose 43 districts meeting 20 of 27 1999 standards, the Senate selected 122 districts meeting 17 of 18 1996 standards, the House chose 45 districts meeting all 18 original standards in 1999, and the House again in an amended bill used 127 districts meeting 17 of 18 1996 standards in 1996 and 20 of 27 standards in 1999.(Baker, Taylor, Vedlitz, 2005, p. 15)

Put simply, legislators in Ohio backed into outcome standards to identify that subset of school districts that on average were spending what the state was willing to spend within its current budget.

New York’s Numbers Game

More recent school finance reforms in New York State reveal that similar games persist.  In response to court order in Campaign for Fiscal Equity v. State, the legislature adopted a foundation aid formula to be phased in from 2007 to 2011 where the basic funding level in that formula would be set as follows:

The Foundation Amount is the cost of providing general education services. It is measured by determining instructional costs of districts that are performing well. (NYSED, Primer on State Aid, 2011-12)

The state defined “performing well” as a standard of 80% of children scoring proficient or higher on state assessments, a performance level marginally lower than the statewide mean at the time.

In constructing their baseline cost estimates, state officials adopted a handful of additional steps to ensure a politically palatable, low basic cost estimate. First, state officials chose only to consider the average spending of those districts that were both “performing well” and in the lower half of spending among those performing well. By taking this step, nearly all districts in the higher cost regions of the state are excluded and thus have limited effect on the basic cost estimate. Figure 1 shows that across regions, about 60 to 80% of districts meet the “successful” standard. In Western New York and the Finger Lakes region about 73% of districts are both “successful” and low spending. But, while 75 to83% of Hudson Valley and Long Island districts are “successful”, only 20 to 25% are in the lower half of spending (even after applying the state’s regional cost adjustment, which is clearly inadequate).

Thus, basic costs for districts statewide are measured largely against the average spending of districts lying somewhere in the triangle between Ithaca, Buffalo and Syracuse.  Spending behavior of these districts has little relevance to costs of providing adequate education in and around New York City.

Figure 1

Slide2

Another step in the process further deflates basic cost estimates. Instead of adopting a comprehensive measure of annual operating expenditures, the state chose a pruned down “general instructional spending” figure.  In particular, the pruned general instructional spending figure is substantively lower than the state’s approved operating expense figure for downstate districts, as shown in Figure 2.

Figure 2

Slide3

The combined a) setting of  a low outcome bar, b) filtered exclusion of districts in higher cost regions of the state and c) selection of a partial spending figure rather than a more comprehensive one guarantees a more politically palatable minimum cost estimate, while still provide a veneer of empirical validity.

Despite taking such care to generate such a low estimate of adequate spending under-girding the state foundation aid formula, in recent years, the state has failed to come even close to funding the targets established by the formula – providing less than half of the target levels of aid required for many of the state’s highest need districts.

Rhode Island’s Numbers Game

Perhaps most ludicrous of all are Rhode Island public officials’ attempt to validate empirically their selected spending levels for recent school finance reforms.  Rhode Island’s school finance reforms gained significant attention among policy think tanks as a model of proactive political collaboration leading to progressive, empirically based but elegantly simple reform (Wong, 2013). As described in official documents, the basic funding level for the Rhode Island formula is set as follows:

(1) The core instruction amount shall be an amount equal to a statewide per pupil core instruction amount as established by the department of elementary and secondary education, derived from the average of northeast regional expenditure data for the states of Rhode Island, Massachusetts, Connecticut, and New Hampshire from the National Center for Education Statistics (NCES) that will adequately fund the student instructional needs as described in the basic education program and multiplied by the district average daily membership as defined in section 16-7-22. (RIDE, 2010)

As articulated by State Education Commisioner Deborah Gist:

“Our core instructional amount was based on national research, using data from the NCES, is sufficient to fund the requirements of the Rhode Island Basic Education Program, and it in no way focused on states with low per-pupil expenditures. In fact, we looked particularly carefully at our neighboring states, which have some of the highest per-pupil expenditures in the nation, and we included only those states that have an organizational structure and staffing patterns similar to ours.” (Gist, 2010)

Several points here are worthy of note.

  • That like New York officials, Rhode Island officials chose to focus on a reduced spending figure – core instructional spending – rather than a complete current operating spending figure.
  • Average core spending of other states is hardly to be considered “national research” and average spending based on national data sources in other states is hardly indicative of what might be required to achieve Rhode Island’s required outcomes unless the state’s outcomes are also contingent on standards set in other states.
  • The data used to set funding targets for school year 2010-11 and beyond come from several years prior;
  • New Hampshire is not a neighboring state of Rhode Island.

Table 1 shows the effect of including New Hampshire among Rhode Island’s “neighbors” when calculating the basic spending levels. Spending in New Hampshire is substantively lower than in Massachusetts or Connecticut, and thus brings down the average. Notably, spending in Vermont which is much higher than in New Hampshire is not included.

Table 1

RI

Eventually, in accordance with their “analyses,” Rhode Island officials proposed a foundation level for 2010-11 and beyond to be set at $8,295 (RIDE, 2010, Wong, 2013).  Notably, however, the average spending in Connecticut, Massachusetts and New Hampshire which most closely approximates that figure comes from 2006-07.  Further, the 2007-08 Rhode Island average core instructional spending per pupil was already over $8,500, and a more comprehensive measure of current operating spending per pupil exceeded $13,000 per pupil.

References

Baker, B. D. (2012). Revisiting the Age-Old Question: Does Money Matter in Education?. Albert Shanker Institute.

Baker, B. D. (2009). Private schooling in the US: Expenditures, supply, and policy implications. Boulder and Tempe: Education and the Public Interest Center & Education Policy Research Unit.

Baker, B. D., & Corcoran, S. P. (2012). The Stealth Inequities of School Funding: How State and Local School Finance Systems Perpetuate Inequitable Student Spending. Center for American Progress.

Baker, B., & Green, P. (2008). Conceptions of equity and adequacy in school finance. Handbook of research in education finance and policy, 203-221.

Baker, B. D., Libby, K., & Wiley, K. (2012). Spending by the Major Charter Management Organizations: Comparing Charter School and Local Public District Financial Resources in New York, Ohio, and Texas. National Education Policy Center.

Baker, B. D., Sciarra, D. G., & Farrie, D. (2012). Is School Funding Fair?: A National Report Card. Education Law Center. http://schoolfundingfairness.org/National_Report_Card_2012.pdf

Baker, B. D., Sciarra, D. G., & Farrie, D. (2010). Is School Funding Fair?: A National Report Card. Education Law Center. http://schoolfundingfairness.org/National_Report_Card.pdf

Baker, B. D., Taylor, L., & Vedlitz, A. (2005). Measuring educational adequacy in public schools (Report prepared for the Texas Legislature Joint Committee on Public School Finance, The Texas School Finance Project).

Baker, B., & Welner, K. G. (2012). Evidence and Rigor Scrutinizing the Rhetorical Embrace of Evidence-Based Decision Making. Educational Researcher, 41(3), 98-101.

Baker, B.D. & Welner, K.G. (2011a). Productivity Research, the U.S. Department of Education, and High-Quality Evidence. Boulder, CO: National Education Policy Center. Retrieved [date] from http://nepc.colorado.edu/publication/productivity-research.

Baker, B. D., & Welner, K. G. (2011b). School Finance and Courts: Does Reform Matter, and How Can We Tell?. Teachers College Record, 113(11), 2374-2414.

Baker, B., & Welner, K. G. (2010). Premature celebrations: The persistence of inter-district funding disparities. education policy analysis archives, 18, 9.

Bifulco, R. (2005) District-Level Black-White Funding Disparities in the United States 1987 to 2002. Journal of Education Finance 31 (2) 172-194.

Buras, K. L. (2011). Race, charter schools, and conscious capitalism: On the spatial politics of whiteness as property (and the unconscionable assault on black New Orleans). Harvard Educational Review, 81(2), 296-331.

Clune, W. H. (1994). The shift from equity to adequacy in school finance. Educational Policy, 8(4), 376-394.

Cuomo, A (2011) State of the State. Albany, NY. http://www.governor.ny.gov/sl2/stateofthestate2011transcript

Deslatte, A. (2011) Scott: Anthropology and journalism don’t pay, and neither do capes. Orlando, FL: Orlando Sentinal. October 11, 2011

Downes, T. A. (2004). School Finance Reform and School Quality: Lessons from Vermont. In

Yinger, J. (ed), Helping Children Left Behind: State Aid and the Pursuit of Educational Equity.

Cambridge, MA: MIT Press.

Duncan, A. (November 17, 2010) The New Normal: Doing More with Less — Secretary Arne Duncan’s Remarks at the American Enterprise Institute. Washington, DC:

http://www.ed.gov/news/speeches/new-normal-doing-more-less-secretary-arne-duncans-remarks-american-enterprise-institut

Duncombe, W.D., and Johnston, J. (2004). Helping Children Left Behind: State Aid and the Pursuit ofEducational Equity. Cambridge, MA: MIT Press.

Freeman, J. (2011) New Jersey’s ‘Failed Experiment’ The new governor is on a mission to make his state competitive again in attracting people and capital. New York, Wall Street Journal. http://online.wsj.com/article/SB10001424052702303348504575184120546772244.html

Gates, W. (2011) Flip the Curve: Student Achievement vs. School Budgets. Huffington Post. http://www.huffingtonpost.com/bill-gates/bill-gates-school-performance_b_829771.html

Gist, D. (2010) National Journal. R.I. Formula Funds Children, Not Systems. http://education.nationaljournal.com/2010/06/a-funding-formula-for-success.php

Imazeki, J., and Reschovsky, A. (2004). Helping Children Left Behind: State Aid and the Pursuit of Educational Equity. Cambridge, MA: MIT Press.

McClure, P., Wiener, R., Roza, M., and Hill, M. (2008). Ensuring equal opportunity in public education: How local school district funding policies hurt disadvantaged students and what federal policy can do about it. Washington, DC: Center for American Progress. Retrieved December 20, 2009 from http://www.americanprogress.org/issues/2008/06/pdf/comparability.pdf

Public Impact; The University of Dayton, School of Education and Allied Professions; and Thomas B. Fordham Institute. (2008, March). Fund the Child: Bringing Equity, Autonomy and Portability to Ohio School Finance How sound an investment? Washington, DC: Thomas B. Fordham Institute. Retrieved December 20, 2009 from http://www.edexcellence.net/doc/fund_the_child_ohio_031208.pdf

New York State Education Department (2011). Fiscal Analysis & Research Unit. Primer on State Aid 2011-2012. http://www.oms.nysed.gov/faru/PDFDocuments/Primer11-12D.pdf

New York State Education Department (2011). Fiscal Analysis & Research Unit. Successful Schools Analysis Technical Report. http://www.oms.nysed.gov/faru/documents/technical_final.doc

Oliff, P., Mai, C., Leachman, M. (2012) New School Year Brings More Cuts in State Funding for Schools. Washington, DC: Center on Budget and Policy Priorities. http://www.cbpp.org/cms/?fa=view&id=3825  Accessed July 23, 2013

RIDE (Rhode Island Department of Education) Division of School Finance (2010) http://www.ride.ri.gov/Finance/Funding/FundingFormula/Docs/H8094Aaa_FINAL_6_10_10.pdf

Roza, M. (2006) “How Districts Short Change Low Income and Minority Students,” in Funding Gaps 2006. Washington, DC: The Education Trust.

Rubenstein, R., Schwartz, A. E., Stiefel, L., and Bel Hadj Amor, H. (2007). From districts to schools: The distribution of resources across schools in big city school districts. Economics of Education Review, 26(5), 532-545.

Stiefel, L, Rubenstein, R., and Berne, R. (1998). Intra-District Equity in Four Large Cities: Data, Methods and Results.” Journal of Education Finance, 23(4), 447-467.

U.S. Department of Education, For Each and Every Child—A Strategy for Education Equity and Excellence, Washington, D.C., 2013. http://www2.ed.gov/about/bdscomm/list/eec/equity-excellence-commission-report.pdf

Wong, K. K. (2013). The Design of the Rhode Island School Funding Formula: Developing New Strategies on Equity and Accountability. Peabody Journal of Education, 88(1), 37-47.

An Illustrative Case of the Numbskullery of Evaluating Teacher Preparation by Student Growth Scores

Assumption:  A good teacher preparation program is one that produces teachers whose students achieve high test score gains

Relay Graduate School of Education is housed in North Star Academy in Newark, and its course modules are largely provided by relatively inexperienced “champion” teachers within its own network (and in from the school itself).  The program is designed to train its own future teachers [and others in network] – and to actually credential them (and grant them graduate degrees) in the specific methods used in their school(s).

Put simply, Relay GSE uses relatively inexperienced teachers to grant degrees to their own new colleagues, where those colleagues may be required by the school to gain those credentials in order to retain employment. No conflict of interest here? But I digress. Back to the point.

Their modules, as shown on the Relay website, are in their best light, little more than mindless professional development for classroom management, and reading inspirational books by school founders, discussed with “champion” teachers. Hardly the stuff of legitimate graduate work, in any field. But again, I digress.

Relay GSE will likely place a significant number of its graduates in its own school (or in network).

North Star Academy has pretty good growth scores, by the (bogus) New Jersey growth metric.

Therefore, not only is North Star Academy totally awesome, but Relay GSE must be an outstanding  teacher preparation institution! It’s just that simple. They must be offering that secret sauce of teaching pedagogy which we should all be looking to as a model. Right?

Setting aside that the New Jersey growth scores themselves are suspect, and that the endeavor of linking teacher preparation program effectiveness to such measures is completely invalid, what the current approach fails to recognize is that North Star Academy actually retains less than 50% of any given 5th grade cohort through 12th grade in any given year, and far fewer than that for black boys. The school loses the vast majority of black boys, and for the few who remain behind, their growth scores – likely as influenced by dwindling peer group composition among those left as by “teacher” effects – are pretty good.

But is a school really successful if 50 enter 5th grade, 1/3 are gone by 8th grade and only a handful ever graduate?

Is this any indication of the quality of teaching, or pedagogy involved?  I won’t go so far as to suggest that what I personally might perceive as offensive, demeaning pedagogy is driving these attrition rates (okay… maybe I just did).

But, at the very least, I might argue that a school that loses over half its kids from grade 5 to 12 is a failing school, not an outstanding one. Whether that has any implications for labeling their teachers as “failing” and their preparation programs as “failing” is another question entirely.

It is quite simply completely and utterly ridiculous to suggest that Relay GSE is an outstanding graduate school of education as a function of measured test score gains of the few students who might stick around to take the tests in subsequent years.

No secret sauce here… just a boatload of bogus policy assumptions creating perverse incentives and taking our education system even further in the wrong direction.

Notably, this does not prove it’s a bad, or awful grad school of education either (see their videos, and read the reports here for evidence of that).

My point here is that this particular case – or what it has the potential to be – is wonderfully (in a twisted way) illustrative of the numbskullery that pervades public education policy from k-12 school accountability metrics to proposals for “improving” teacher preparation.

This foolishness must stop.

A Poverty of Thinking about Poverty Measures in New Jersey School Finance

Cross Posted at http://njedpolicy.wordpress.com/2013/07/18/a-poverty-of-thinking-about-poverty-measures-in-new-jersey-school-finance/

Link to PDF of Policy Brief: Poverty_Counts_July_2013

Bruce D. Baker, Rutgers University, Graduate School of Education


Introduction

Every few years or so, in nearly any state but especially in those where leadership is actively seeking ways to reduced financial support to local public school districts serving lower income children,[1] one can expect the re-emergence of politically induced media outrage over rampant fraud in National School Lunch Program. The usual course of events is as follows:

  1. Manufacture some scandalous but largely anecdotal manifesto about how local district officials are egregiously mislabeling children as low income in order to hoard and obscene sums of state aid.
  2. Manufacture other claims that poverty really doesn’t matter anyway and certainly these poverty measures have little or nothing to do with determining whether children are likely to do well in school.[2]
  3. Assign a task force composed mainly of lay people with little or no expertise in education policy, finance or specifically the measurement of poverty, to swallow whole the manufactured evidence and generate politically convenient policy recommendations.

During my years in Kansas, on faculty at the University of Kansas, similar debates occurred with regularity. At one point, the legislature established an “At Risk Council” whose charge was to evaluate alternative proxies for determining student need, to be used in the state aid formula. Former education Commissioner Andy Tompkins was assigned to chair the task force, which eventually concluded:

The Council continues to believe that the best state proxy for identifying at-risk students is poverty, whether that be measured by free or free and reduced price lunches.[3]

Nonetheless, Kansas legislators continued to seek, and eventually adopt, alternative measures that would drive additional funding to lower poverty suburban districts, and thus, away from higher poverty districts, under the auspices of special needs.[4]

In 2011, the New Jersey State Auditor released a report blasting rampant fraud in the school lunch program.[5] In 2012, a task force primarily of lay persons was formed to evaluate whether the state aid formula should continue to drive funding to local public school districts on the basis of these obviously fraudulent and overstated counts of children in need. But little seems to have come thus far of last year’s efforts to raise suspicion over the implications of supposed rampant fraud in the free and reduced lunch program for the equity and adequacy of the state aid formula.

Thus, here we go again. This month, the New Jersey auditor has released yet another scathing report of rampant fraud, instigated by local school officials, in the National School Lunch Program. Immediately that report has been cast as having significant implications for how school funding is allocated.[6]

This year’s report again audited a select number of applications for the school lunch program, from 15 school districts, finding cases of misreported income, often by school officials themselves. Such fraud, if indeed validly characterized in the auditor’s report, is certainly wrong and should be handled appropriately. But the implications of the auditor’s findings for using subsidized lunch as a measure for driving state aid are negligible, other than the fact that the state should continue regular auditing.

Income Measures & School Funding Formulas

The basic assumption behind targeting additional resources to higher poverty schools and districts is that high need districts can leverage the additional resources to implement strategies that help to improve various outcomes for children at risk.  Some share of the additional resources is needed in higher poverty settings simply to provide for “real resource” equity – or to pay the wage premium required to recruit and retain teachers into higher poverty settings. Further, resource intensive strategies such as reduced class sizes in the early grades, intensive tutoring and extended learning time programs may significantly improve outcomes of low income students.

When seeking a measure for differentiating between higher and lower need settings, the idea is to find that indicator or measure that seems to best capture the likelihood that children will struggle in school – that they will enter kindergarten less prepared and have access to fewer out of school resources during their time in school (including limited summer learning opportunities).

A variety of socioeconomic indicators might be considered. But often, the information that happens to be most available is counts of kids who are from low income families, as identified through the National School Lunch Program income criteria.  And, as a measure of convenience, it tends to work quite well. I compare this measure below with Census poverty measures, based on children in families living in a certain area (within school district boundaries) who fall below the much lower income threshold of 100%, which has some advantages but also some major shortcomings.

To determine whether school lunch counts are useful for guiding school finance policies, one must look more broadly at the validity of these measures when cast at the school district level, statewide. Small scale audits of individual applications are of marginal use in this regard. The simplest validity checks on the usefulness of subsidized lunch measures as a student need proxy for state aid are as follows:

Is the Poverty Measure Correlated with Other Poverty Measures?

It is indeed desirable to find some measure on which to base funding allocations that can’t be gamed, or manipulated by those who stand to receive the additional funding. But that’s not always feasible (or cost effective). And, even if a count method does involve local district officials gathering data, it can, and should still be audited.[7]

One reasonable way to evaluate district collected data on children qualifying for free or reduced lunch is to evaluate the relationship between the free/reduced lunch concentrations and census poverty estimates based on resident populations.

In Figure 1 we see that Census poverty rates tend to range from 0 to about 45% and free/reduced rates – children in families under a much higher income threshold, up to about 100%. In fact, as I’ve noticed in many analyses, the free/reduced lunch data tend to get messy above 80%, suggesting that this is the range within which local administrators may be maxing out their ability to get parents to comply & file paperwork. Here, we see that even though poverty rates keep climbing, free/reduced rates seem to level off. Arguably, if anything is going on here, it’s that very high poverty districts like Camden and Trenton – which fall “below the curve” are under-reporting their free/reduced rates – with some possibility of marginal over-reporting in Elizabeth.

Overall, however, census poverty explains nearly 90% of the variation in free/reduced rates.

In other words, free/reduced lunch makes a pretty good proxy.

Figure 1. Relationship between Census Poverty 2010 and District Free/Reduced Lunch 2011

Slide1

In Figure 2, I’ve tried to better tease out the districts that may be under or over reporting by cleaning up the non-linear relationship by expressing both measures in their natural logarithm form. Here, we see that the relationship remains very strong and still slightly curved.

If there were districts substantially over-reporting free/reduced lunch, they would appear to pop above the outer/upper edge of the curve. That is, their reported rates would be higher than predicted based on the alternative measure. On the other hand, there are a number of districts that are relatively low in poverty but report disproportionately low free/reduced lunch rates – that is, under-reporting.

Figure 2. Logged Relationship (natural log) between Census Poverty and Free/Reduced Lunch

Slide2

In general, these figures show that free/reduced lunch rates are a reasonable proxy for district poverty rates. These figures do not indicate substantial, systematic (beyond predicted, based on resident child poverty rates) mis-classification.

Is the Poverty Measure Correlated with Student Outcomes?

The “big question” is which version of the measure better captures differences in student outcomes – or predicts more accurately educational disadvantage.  This is straightforward enough to check as well. The first figure here shows the relationship between free/reduced lunch rates and proficiency rates on state assessments in 2011.

Figure 3 shows that % free/reduced lunch alone explains about 81% of the variation in proficiency rates across districts.  So, it’s a pretty reasonable proxy of educational disadvantage.

 Figure 3. Free/Reduced Lunch & Proficiency in 2011

Slide3

I have some concerns about the extent to which this relationship erodes at and approaching free/reduced rates above 80%. Is it really that Camden and Trenton perform that poorly compared to Union and Elizabeth despite serving even less poor populations? Or might the story be more complex than this.

Figure 4 which shows the relationship between Census Poverty and proficiency sheds some additional light on this issue.

Figure 4. Census Poverty and Proficiency

Slide4

Figure 4 suggests that Camden and Trenton are actually a) higher poverty than Elizabeth (and Camden higher than Union) and b) perform more or less where they are expected to [somewhat below, as opposed to well below]. This is an interesting contrast that adds some support to my speculation above that these very high poverty cities may in fact be understating their poverty rates in their free/reduced lunch data. Indeed, there may be some overstating in Union and Elizabeth, but neither popped substantially above the curve in the previous charts.

Census poverty rates, while capturing a unique story of difference between Camden and Trenton vs. Union and Elizabeth do slightly less well at explaining variations in proficiency rates, making the free/reduced count preferable in this regard.

Additional Policy Considerations

Given all of this, there are a few additional considerations when pondering which measure to actually use in state school finance policy.

More Stringent Count Methods require Larger Weights

First, if we choose to use a more stringent income threshold for poverty, like the census poverty measure, we would need to assign the appropriate weight to drive the appropriate amount of funding to high need districts. Simply changing our method of counting kids in poverty doesn’t change the needs of Camden or Trenton. It merely recasts those needs with an alternative measure. More stringent measures require larger weights, an issue that has been explored empirically.[8]

This applies to the choice of using free lunch (130% income threshold) as opposed to free or reduced lunch. Using free lunch only might permit better differentiation between high poverty districts, but a higher weight would then be required to drive sufficient funds to those districts. That is, shifting to this weight should not drive less total targeted aid, but rather, should target that aid more accurately.

Problems with Residential/Geography Based Measures in New Jersey

Census poverty measures are limited in their usefulness in the current New Jersey policy context, because they are based on location of residence and linked to geographic boundaries of school districts. New Jersey has significant numbers of non-unified, regional secondary school districts for which poverty estimates may be imprecise or inaccurate.

Further expansion of charter schools and inter-district choice programs complicates use of measures based on place of residence. Funding to schools must be sensitive to the demographics of students enrolled in those schools.  It would be entirely inappropriate, for example, to require a sending district like Newark or Camden to pay charter or other district tuition on the basis of their own average resident poverty rate if the charter school or receiving district is not taking a comparable share of children in poverty.

As a result, free or free and reduced price lunch measures likely remain preferable.


[1] The assertion here that New Jersey officials are actively seeking a rationale for reducing state aid to higher poverty districts is justified here, https://schoolfinance101.wordpress.com/2012/03/02/amazing-graph-proves-poverty-doesnt-matter/, where State Education Commissioner Cerf presents data to assert that poverty may not have strong influence on student outcomes, here (https://schoolfinance101.wordpress.com/2012/12/18/twisted-truths-dubious-policies-comments-on-the-njdoecerf-school-funding-report/) where the Commissioner asserts that “dollarizing” student needs simply doesn’t work, and most notably, here (https://schoolfinance101.wordpress.com/2013/03/02/civics-101-school-finance-formulas-the-limits-of-executive-authority/) in which I explain how state leaders have already, against authority of the school funding statute itself, chosen to calculate district aid on the basis of “average daily attendance” rather than fall enrollment count, leading to substantive, disproportionate reduction of aid to higher poverty districts.

[4] http://skyways.lib.ks.us/ksleg/KLRD/Publications/2013Briefs/2013/I-1-SchoolFinance.pdf (specifically adding a weight for non-low-income, non-proficient students)

[7] Preferably in a  more thorough and responsible way than checking a smattering of individual families’ forms for those who fall closest to the income threshold, necessarily ignoring those who fall just the other side of the threshold but didn’t file.

[8] Duncombe, W., & Yinger, J. (2005). How much more does a disadvantaged student cost?. Economics of Education Review, 24(5), 513-532.