More Fun with New Jersey Charter Schools

LINK TO UPDATED SPREADSHEET OF FREE LUNCH AND SPECIAL ED DATA

I love maps. I love GIS software. This is a particularly interesting one related to the shares of children who qualify for free (not free or reduced, but free only, a poorer population) lunch in traditional public schools and in charter schools in Newark. One reason why mapping is useful here is that it is important to compare school demographics with other nearby schools, rather than district average. This map of a portion of Newark pretty much speaks for itself. Click to enlarge the map (to read the free lunch ranges on the key). Clearly, two of the “high performers” among charters – North Star and Robert Treat, have noticeably lower free lunch rates than other schools around them (except for other special schools).(CS indicates Charter School)

Data for this map were acquired from the National Center for Education Statistics Common Core of Data – Public School Universe Survey for 2007-08. These data include latitude and longitude for schools, which may not be perfectly precise. But, they are pretty good overall.

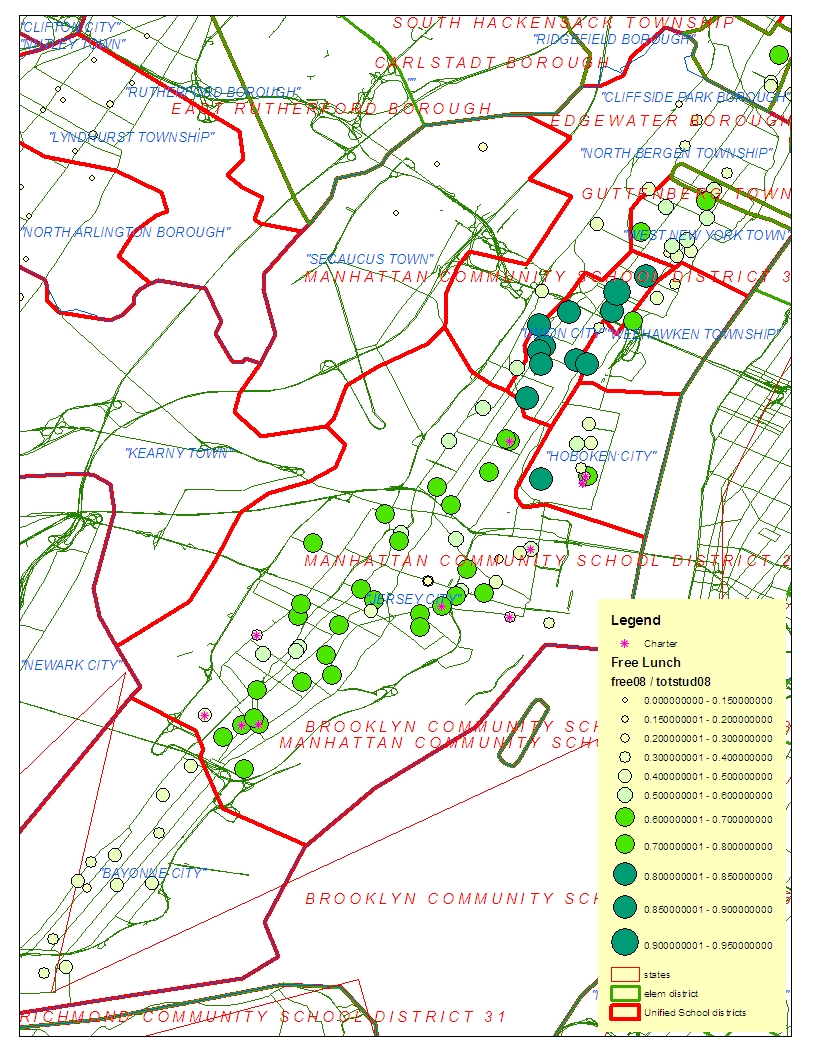
While I’m at it – here are the Jersey City Charters – even more striking differences:

Stepping back a bit to see more charters and taking off the names for clarity, here’s what all of Newark looks like, including some other neighboring towns. Charters have a pink asterisk. Again, smaller circles in lighter shades are lower free lunch schools. There are a few charters that are moderate to higher poverty – similar to many Newark schools (bright green, medium size bubble). However, many charters are the lowest poverty schools to be found. The same is true in the second map below for Jersey City.

Recall from previous posts that Charters are even more different from their neighbors in terms of the numbers of special education and limited English proficient students they serve. Their one saving grace was that they did seem to have relatively high shares of students qualifying for free or reduced price lunch. But, as I have noted in previous posts, they seem, on average to be taking in the less poor among the poor – at least the “model charters” do.  That’s simply not scalable reform. Claims by NJ Charter advocates that these schools are serving the same, high poverty, needy student populations as other schools in their neighborhood are simply wrong – and not supported by any legitimate, fine-grained analysis (and it doesn’t even have to be that fine grained).

Note: One error in other analyses that compare charter school free or reduced lunch rates to district average rates is that those analyses fail to compare by grade level. Few charters in New Jersey are High Schools. High schools on average have lower rates of children qualifying for free/reduced lunch for a variety of reasons – primarily reporting issues. So, if you compare a bunch of elementary schools to a district average which includes high schools, you are likely to show that the elementary schools have higher average free/reduced lunch rate. But it’s not a correct comparison. Charter schools should be compared by grade level to their nearest neighboring and/or sending schools. I’ve not yet run the relevant spatial statistics above.

So, here are a few basic guidelines for future comparisons:

1) compare by relevant grade level because of the way in which subsidized lunch rates shift from elementary to secondary school;

2) while it’s okay to evaluate free and reduced shares, it is also important to slice those shares because children in these categories differ by family background. Looking only at the sum of free and reduced conceals substantial differences in student populations across charters and traditional public schools;

3) compare by location.

========

Here’s some follow-up data on New Jersey Charter School demographics. Here are the comparisons of disability rates and free lunch shares for Newark and Jersey City Public (Traditional Public) schools by grade level and the disability rates and free lunch shares for Charter schools often cited as outperforming the host district. Note that most claims that these schools outperform the host district use all kids’ test scores, not just general student test scores. So, differences in shares of children with disabilities make a huge difference in proficiency rates. I show this in previous posts on this thread (New Jersey Charter Schools).

Special Education

Note: A knowledgeable reader has informed me that the “0” value for Greater Newark Charter is actually “missing data,” for that year and has assured me that Greater Newark Charter does indeed enroll children with disabilities. At some point, I may get around to updating these analyses.

% Free Lunch

Note that the highest flyin’ charters (Treat and North Star) have substantially lower free lunch shares than the host district in addition to having very low special education rates. Only Marion P. Thomas has a relative high free lunch share, but has very few special education students.

Racial Achievement Gaps and Within-District Funding Inequity

I’ve written on this blog on a number of occasions, comments regarding the relative significance of within versus between district funding inequities. For example, I’ve explained (in response to an absurd claim by pundits from Education Trust) that southern states have not, in fact, substantively resolved between district funding disparities – leaving only district allocation policies to blame for persistent inequities.

A Center for American Progress report claims:

One of the most harmful manifestations of this is that local school district funding is allocated in a way that hurts poor and minority students. A study by the Thomas B. Fordham Institute found that educational funding is being allocated on the basis of “staff allocations, program-specific formulae, squeaky-wheel politics, property wealth, and any number of other factors that have little to do with the needs of students.”1

The outcome of such practices is predictable: A further widening of the dangerous achievement gap that has become endemic in American schools today.

http://www.americanprogress.org/issues/2008/06/pdf/comparability.pdf

Notably, some of the above concerns raised in the Fordham report are between, not within-district concerns (property wealth related disparities), but the CAP report focuses on within district disparities as the central issue.

I have a forthcoming article (which I will forward by request) which explains that the existing literature which claims that within-district disparities far outweigh between-district disparities is problematic at best, drawing premature if not entirely unfounded and overextended conclusions. This is not to deny the problem of within district disparities but rather to point out that between district disparities persist and must be addressed either simultaneously with or as a precursor to resolving within district disparities.

Many pundits who wish to shift focus entirely onto within district disparities, blaming districts instead of state funding policies, seem to base their arguments on the idea that within-district funding disparities are the reason for persistent racial achievement gaps. Their story goes… that over the decades through the 1990s, states fixed between district funding disparities and achievement gaps improved. Since that time however, improvement to achievement gaps has stagnated if not backslid (true), with pundits arguing that the persistent within district disparities are the cause (unlikely). That is, that individual school districts are now funding their non-poor, white schools well and depriving their poor minority schools. That districts are allowing their better teachers to transfer from the high poverty, black schools to their low poverty white schools. There are certainly cases where this is true (Cincinnati accomplishes this through its weighted student funding formula by weighting gifted children more than poor children).

As a broader policy concern, the above argument might make sense if, in fact, student populations across schools within districts varied widely but that student populations vary less between districts. That is, it might make sense to argue that between-school within-district funding disparities are causing racial achievement gaps if racial minorities and whites attended the same districts but not the same schools. But that’s not always, or often the case, especially in densely populated states and metropolitan areas which included many small school districts.

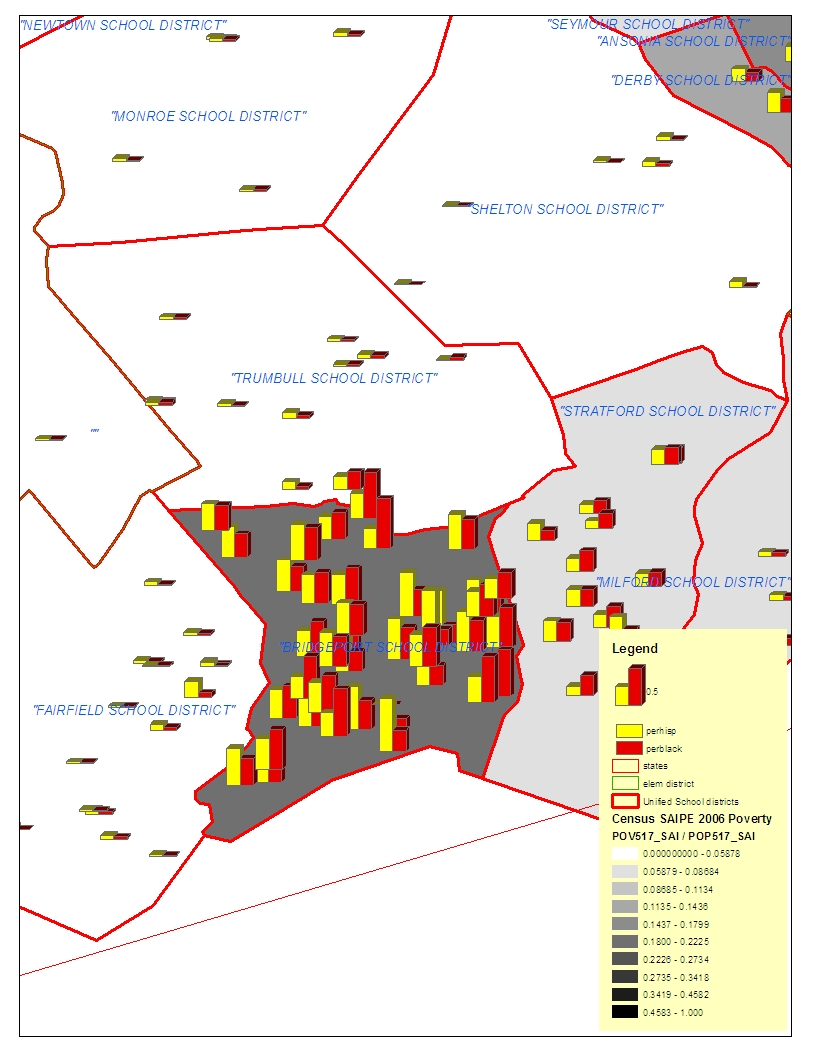
Allow me to use Connecticut – a state with among the largest racial achievement gaps – as an example. Here’s the racial composition (black enrollment share in red bars, Hispanic share in yellow bars) for Hartford area school districts (click to enlarge). Those flat bars in other districts are schools with few or no black or Hispanic children.

In Connecticut, like New Jersey or like the Chicago metro area, school districts tend to be either minority or white – not a balanced mix sorted across schools. Hartford, in this case, can only re-allocate resources across schools that are all approximately 99% poor, and either majority black (north end) or majority Hispanic (south end) schools (except for the magnet schools which serve relatively smaller portions of the district population).

New Britain, to the southwest of Hartford can allocate resources across predominantly Hispanic schools or other predominantly Hispanic schools.

Meanwhile, West Hartford, Simsbury, Avon, Newington, Wethersfield and others can allocate resources across white schools and other white schools (some in West Hartford having modest minority populations)

Here’s the New Haven area:

And the Bridgeport area:

So, at least in Connecticut, it would appear highly unlikely that within- district resource allocation across schools could be fueling their large achievement gaps. That’s because – for the most part – the minorities attend some districts and the whites attend other districts. That’s not to say there aren’t likely some pretty big within district funding disparities in these districts, but in some districts those disparities exist between blacks and Hispanics, or Hispanics and other Hispanics, blacks and other blacks and  in the other districts the disparities are between whites and other whites. For the most part, minority students attend minority districts and white students attend white districts in Connecticut. Patterns are similar in the Chicago metro area and in New Jersey.

Yes there are exceptions – racially integrated middle class inner-urban-fringe and suburban districts. But these exceptions do not account for the majority of minority or white students by any stretch of the imagination. And yes, in these exception districts, there are often very large achievement gaps even within schools. That is a separate and equally important (though smaller in magnitude) story.

It is an absurd stretch, however, to blame between-school within-district allocation policies for large achievement gaps in states like Connecticut, where minority students and white students attend different districts, much more so than different schools within the same districts.

See my previous post on between-district disparities in Connecticut here:

https://schoolfinance101.wordpress.com/2009/08/19/random-thoughts-on-ct/

Here are the scatterplots of the school level free/reduced lunch rates and black and Hispanic concentrations for the above urban CT districts – elementary schools. Dots in red are schools within the district in question. Blue dots are schools in all other districts, including the other urban districts. Note that in Hartford and Bridgeport in particular, all elementary schools are high poverty and high minority concentration. New Haven is more diverse, but still less diverse than the statewide (between district) distribution.

CT School Demographics-Elementary

Education Week Does it Again: Please STOP!

Education Week has again posted the problematic QUALITY COUNTS indicator system including grades for school finance across the states. And again, Education Week has paid little attention to producing high quality indicators for measuring …quality? Why doesn’t that surprise me? But, they’ve made my life easier because I can simply refer you to my critique of last year’s Quality Counts School Finance Indicators:

https://schoolfinance101.wordpress.com/2009/01/08/education-week-quality-lacks/

Here are a few quick summary points on issues that occur year to year:

  • Ed Week uses “range” measures and “coefficient of variation” measures in its equity analysis – measures which capture overall variations and high to low variations in current expenditures across school districts. The way that Education Week calculates these measures actually penalizes states which target funds to higher need school districts, including higher poverty school districts or very small remote districts. That is, if a state actually makes efforts to accommodate cost differences across districts, they get a lower equity grade from Education Week. THAT’S JUST WRONG! Education Week uses some “cost adjustments” including a regional wage index and a nominal (and completely arbitrary) poverty adjustment. But, states like New Jersey actually provide more poverty-based support than the Ed Week adjustment, resulting in a reduction in the Ed Week equity measures. Ed Week makes no adjustment for costs associated with economies of scale or population density – major factors affecting spending variation across school districts within states.
  • Ed Week continues to use peculiar (though traditional) school finance measures like the McLoone Index to evaluate the share of children within the state who are in districts near the median spending level. This was originally conceived as a within state relative adequacy measure. But, without appropriate consideration for needs or costs, a state can score well on the Ed Week McLoone index by simply having all of its low income children clustered together in one or a handful of districts that spend at the edge of the lower half of the distribution.

Education Week staffers – Please Stop! Quality Counts is very unhelpful because of the extent to which it misinforms. There may be, and in fact are, some good and useful indicators in the report, but there are at least equal numbers of indicators that are entirely misleading. One cancels out the other.

These indicators can have a serious negative policy impact because of the way in which and extent to which they misinform. Drawing from a forthcoming technical report (referring to both Ed Week and Ed Trust indicators):

To illustrate the potential negative impact of these two reports, in 2003 in the context of state school finance litigation in Kansas, attorneys defending the State submitted in defense of the school funding formula, both the Education Trust finding that higher poverty districts had higher revenue per pupil and the Education Week finding that Kansas showed a good McLoone index. The state’s attorneys and local news outlets did not understand why Kansas received good ratings on these indices nor did they care as long as those indices were from highly publicized, publicly recognized sources. Plaintiffs pointed out that Education Trust finding was not a function of systematic poverty related support, but rather a function of small rural school support which left out the poorer urban and large town districts and that the “good” McLoone index was a function of having nearly half of the state’s children and nearly all of the state’s poor minority children attending six districts with below average revenues. These points were difficult to make in the face of media accolades for state’s supposed achievements regarding school funding equity and adequacy. The district court and eventually Supreme Court of Kansas declared the state school finance system unconstitutional, but not without at least a few vocal critics chastising the judges who would give the legislature a failing grade for a school finance system that had received a grade of “B” from a leading national media outlet.

Education Trust is Flat-Out Wrong!!!!!

Sometimes I just get fed up with information spewed in the media which is simply FLAT OUT WRONG!!!! A  major source of FLAT OUT  WRONG information on school funding related issues these days seems to be the Education Trust, an organization which spins itself as an advocate for minority children and children in poverty. Here’s what I read this morning in the New York Times:

http://www.nytimes.com/2010/01/07/us/07south.html

On the other hand, Southern politicians are keenly aware of the need for an educated work force. Spurred in part by school financing lawsuits, more than half the 15 states included in the study already provide more state and local financing to heavily poor or minority districts than to affluent or low-minority ones, according to figures compiled by Education Trust, an advocacy group in Washington. But schools often layer programs on top of programs without analyzing which are effective, said Daria Hall, the trust’s director of K-12 policy.

Now, I can’t find the supposed list of 15 states (apparently, the list of fifteen is from this report)  which Education Trust considers “southern” states, but I can tell you that based on my own extensive analyses, very soon to be released, based on the most recent three years of national data on all school districts, that the claim that more than half of these states “already provide more state and local financing to heavily poor and minority districts than to affluent or low-minority ones” is FLAT OUT WRONG!!!!! I’ll gladly explain to anyone and send documentation of this fact as soon as available. But I assure you, it’s flat out wrong!

Let’s consider school funding at two levels: 1) between state differences for districts of similar characteristics and 2) within state differences in funding across districts based on district poverty level.

At both of these levels, southern states continue to do very poorly, some because they lack the capacity to do much better and others (Lousiana) because they simply don’t try, put up little fiscal effort and serve very few children in their public schools. On the point made by Education Trust – only Tennessee in my most recent analysis shows an upward slope in funding between lower and higher poverty school districts. But, this finding is countered by the fact that Tennessee, after adjusting for poverty differences, economies of scale, population density, etc. comes in DEAD LAST on overall level of funding!

Several southern states are neutral, or flat in their within state funding distributions, like Arkansas, Georgia, South Carolina or Kentucky and the relationship between poverty and funding across districts is not systematic one way or the other. And several southern states still maintain systems where higher poverty, higher minority concentration districts receive systematically less state and local revenue per pupil. I have a forthcoming article in West’s Education Law Reporter (with Preston Green and Joseph Oluwole) on how Alabama in particular has managed to maintain racial disparities.

Coupled with providing systematically less funding for high poverty, high minority districts, many southern states have among the lowest adjusted total state and local revenues per pupil, and have very high percentages of children not even attending the public schooling system (see my previous posts on Louisiana).

I find it absolutely baffling that a supposed advocate for equity in public schooling would make such an absurd and unfounded claim, and follow that claim with the charge that the poor, minority southern school districts have only themselves to blame and that their state legislatures have done their part. (Ed Trust argues above: “But schools often layer programs on top of programs without analyzing which are effective, said Daria Hall, the trust’s director of K-12 policy.”)

This kind of unfounded, ill-conceived, misguided rhetoric is not helfpful to anyone, especially the children in school districts for whom E d Trust claims to advocate.

Quick follow up on the “spurred in part by school funding lawsuits:” Here’s a map of where school funding lawsuits have been successful, where they have not, and where they have not been filed: http://www.schoolfunding.info/states/state_by_state.php3 Notice that in several southern states (all of the deep south), these funding lawsuits have been won by states or dismissed or never filed (Mississippi).

====

Just for fun, here are some graphs of the relative state and local revenue per pupil – relative to the labor market average for each district – for the southern 15 states referred to above. In the graphs, larger (enrollment) districts are represented by larger bubbles. What to look for: If a state really was systematically targeting significantly greater funding to higher poverty districts, districts on the right hand side of these figures would be systematically above the 1.0 line. That is, districts with high poverty would have more – systematically and substantially more – state and local revenue than the average for districts in their labor market. There are no additional adjustments made here (no poverty weights used, etc.). When Education Trust calculates its “Funding Gaps” it simply takes the average of of the top and bottom districts, ignoring all in between and ignoring whether those averages are representative of any actual pattern. Further, even if the average difference in funding per pupil is 50 cents for the high poverty versus low poverty group, apparently that would count as targeting to higher poverty. Here are the slides of the actual patterns for 2006-07.

Southern 15 States

Disg-RACE to the TOP?

Here’s how Dems for Ed Reform characterizes Louisiana’s education reform efforts in relation to the federal Race to the Top competition:

Louisiana. The state passed legislation by Rep. Walt Leger III (D-New Orleans) lifting its charter school cap in June at the end of its legislative session. Louisiana is also pioneering an accountability system that tracks graduates of teacher training programs so that they can be held accountable for the performance of the teachers they train and so that their programs can be improved and/or revamped. A “unified group” of education and community-based organizations launched a statewide RttT effort in August.

http://www.dfer.org/2009/12/who_would_have.php

Note that I’m merely using this description as an example. DFER is far from the biggest offender when it comes to heaping praise on Louisiana.

Most pundits seem to agree that Louisiana is a front-runner to receive race to the top funding primarily because of its efforts to increase data and link student data to teachers (for practical issues on this point, see: https://schoolfinance101.wordpress.com/2009/12/04/pondering-the-usefulness-of-value-added-assessment-of-teachers/) and for the state’s lack of caps on numbers of new charters which can be granted per year.

I continue to argue, however, that even if these to factors are signs of “innovation” or an environment to support “innovation,” that innovation without real investment or true commitment is doomed to fail. Louisiana is the perfect example of the insanity that is race to the top. I pick on Louisiana here because it is such an absurd case, and because it is illustrative of the myopic and misguided criteria being used to evaluate innovation, and even more so, illustrative of the utter lack of critical thinking and analysis by pundits and ill-informed media-junkies, ed-writers and twitterers (who seem to lack any ability to critically evaluate … anything… but will re-tweet anything that praises Louisiana’s RttT application).

Let’s take a look at Louisiana’s education system. Yes, their system needs help, but the reality is that Louisiana politicians have never attempted to help their own system. In fact they’ve thrown it under the bus and now they want an award? Here’s the rundown:

  • 3rd lowest (behind Delaware & South Dakota) % of gross state product spent on elementary and secondary schools (American Community Survey of 2005, 2006, 2007)
  • 2nd lowest percent of 6 to 16 year old children attending the public system at about 80% (tied with Hawaii, behind Delaware) (American Community Survey of 2005, 2006, 2007). The national average is about 87%.
  • 2nd largest (behind Mississippi) racial gap between % white in private schools (82%) and % white in public schools (52%) (American Community Survey of 2005, 2006, 2007).  The national average is a 13% difference in whiteness, compared to 30% in Louisiana.
  • 3rd largest income gap between publicly and privately schooled children at about a 2 to 1 ratio. (American Community Survey of 2005, 2006, 2007)
  • 4th highest percent of teachers who attended non-competitive or less competitive (bottom 2 categories) undergraduate colleges based on Barrons’ ratings (NCES Schools and Staffing Survey of 2003-04). Almost half of Louisiana teachers attended less or non-competitive colleges, compared to 24% nationally.
  • Negative relationship between per pupil state and local revenues and district poverty rates, after controlling for regional wage variation, economies of scale, population density (poor get less).
  • 46th (of 52) on NAEP 8th Grade Math in 2009. 38th of 41 in 2000. http://nces.ed.gov/nationsreportcard/statecomparisons/
  • 49th (of 52) on NAEP 4th Grade Math in 2009. 35th of 42 in 2000.

So, this is a state where 20% abandon the public system and 82% of those who leave are white and have income twice that of those left in the public system, half of whom are non-white. While the racial gap is large in Mississippi, a much smaller share of Mississippi children abandon the public system and Mississippi is average on the percent of GSP allocated to public education. Mississippi simply lacks the capacity to do better. Louisiana doesn’t even try. And they deserve and award?

I read an article the other day that was uncritically tweeted (http://www.washingtonpost.com/wp-dyn/content/article/2009/12/12/AR2009121202631.html), explaining how Louisiana has adopted this great new teacher evaluation system. But, hey, look above. Louisiana ranks right near the top of the pack on the percent of all public school teachers who attended the least competitive colleges (which matters). Why worry about a dysfunctional supply pipeline for teachers? You wouldn’t want to consider the possibility that improved teacher wages and working conditions and investment in higher education could possibly improve that pipeline? A good teacher evaluation system will wash that  supply problem away!

Quite simply, if you’ve got the academically weakest teachers to begin with and you’ve got a system where 20% of students, almost entirely white from households with twice the average income leave the system, and where you’re putting about the lowest share of your state productivity into schools, and where your kids continue to score near the bottom on national assessments, all the data and supposed accountability in the world is not going to make much difference. Throwing RttT money into this mess isn’t likely to help much either. Applying a business investment mindset, Louisiana schools are certainly not a product line in which I’d invest my own hard earned money (but wait, RttT is ours, isn’t it?). That is, if I bother to think critically for a minute or two.

While I sympathize with the 80% of children left in Louisiana public schools, it is not the federal gov’t via RttT that is going to begin to dig them out of the hole in which they’ve been buried for decades by their own political leadership. The state of Louisiana must step up first, and big-time. The state must invest sufficiently in public schools to improve quality to the point where some of the wealthier and whiter families might actually opt back into the public system. At the very least, the state should be required  to put up “average” fiscal effort (% of GSP to schools) if it wants an award and should be required to show that it has targeted money to the highest need schools and children. Louisiana needs a stick, not a carrot!

Heaping mindless tweeted and re-tweeted praise on Louisiana is incredibly unhelpful and quite honestly, a bit embarrassing!  State data systems and charter caps cannot alone solve the world’s problems and certainly can’t solve Louisiana’s self-inflicted ailments.

Let’s hope the federal government can see through the smokescreen that it is at least partially responsible for creating, and make good use of RttT funding. Dumping that funding into states such as Louisiana or Delaware, Colorado, or Illinois is probably not best use. See: https://schoolfinance101.wordpress.com/2009/12/14/racingwhere/)

I have written previously about Louisiana among other states, here: https://schoolfinance101.wordpress.com/2009/12/15/why-do-states-with-best-data-systems/

And here: https://schoolfinance101.wordpress.com/2009/02/25/public-schooling-in-louisiana-and-mississippi/

Why do states with the “best” data systems have the worst schools?

Okay, so the title of this blog is a bit over the top and potentially inflammatory, but let’s take a look at those states, which, according to the Data Quality Campaign, have achieved the best possible state data systems by having all 10 elements recognized by the campaign. I should note that I appreciate the 10 data elements, especially as a data geek myself. It’s good stuff and this post is not intended to criticize the Data Quality Campaign. Rather, this post is intended to question whether this focus – or obsession – we have had of late, to rate the quality of state education systems by two criteria alone – a) whether they have certain data linked to certain other data and b) whether they have caps on charter schools – has created an unfortunate diversion. This obsession has caused us to take our eye off the ball – to applaud states who have, in reality, put little or no effort into improving their education systems – states who have, over time, dreadfully under-supplied public schooling, and states who have consistently produced the lowest educational outcomes (not merely as a function of the disadvantages of their student populations).

So, here’s a quick run-down. First, let’s begin with a look at the number of data quality elements compiled by states in relation to the percent of Gross State Product (Gross Domestic Product by State) allocated in the form of State and Local Revenue per Pupil to local public schools. There’s no real tight relationship here, but as we can see, Delaware, Louisiana and Tennessee are 3 states which now have all 10 data elements – HOORAY – but have very low educational effort. Utah and Washington also have low educational effort.

This might be inconsequential if it was… well… inconsequential. That is, if there was also no relationship to educational outcomes. Here’s a plot of the mean NAEP Math and Reading Grades 4 and 8 for 2007 (% Proficient) along with # of Data Quality Elements. In this case, there’s actually some relationship. Yep, states with better data have lower outcomes. Maybe having better data will increase the likelihood that they figure this out. A somewhat unfair argument given that many of these states are relatively poor states, but it’s not all about poverty (in fact, higher poverty would require greater effort to improve outcomes – but it doesn’t play out that way for these states. See this post for a discussion of poverty variation across states). Low effort, low performing, but high data quality states include Lousiana and Tennessee.  Yet, somehow, when viewed through a data quality lens alone – these states become superstars!

This next figure looks at the predicted per pupil state and local revenue in each state for a district having 10% poverty (relatively average for U.S. Census Poverty rates). The point here is to compare a truly comparable state and local revenue figure corrected for poverty variation, regional wage variation, economies of scale and population density. Here, we see that Utah and Tennessee (again) are standouts – having the lowest state and local revenue per pupil. Recall that both are also low to very low effort. Their revenue to districts is not low because they poor, but rather because they don’t put up the effort. But hey, they’ve got great data!!!!!

Another relevant “effort” related point to consider is just how many children of school age in the state are actually even served by the public system. If we were discussing child health care across states or even pre-school, we would most certainly consider the extent of “coverage.” We tend to ignore “coverage” in k-12 education because we too often assume near universal coverage. But that’s not the case. And coverage varies widely across states. Here, I measure coverage by the % of 6 to 16 year olds (American Community Survey of 2007) enrolled in public schools.

Not only are Lousiana and Delaware very low in their effort for schools, and Lousiana low on outcomes, both are also very low on Coverage. They don’t even serve 80% of 6 to 16 year olds in their public school system (remember, charter schools are part of the public system)!!!! Yet somehow, having good data on those who remain in the public system is a substitute making the state worthy of praise!!!!!

One might speculate that these differences are mainly about the wealth of states – especially when it comes to the ability of states to spend on their schools and the outcomes achieved in those schools. This is indeed true to a significant extent. But, as it turns out, the effort a state puts up toward public school spending is actually more strongly related than wealth (per capita gross state product) to predicted state and local revenues per pupil. That is, states which put up more effort, do raise more per pupil for their schools. Yes, states like Mississippi are at a disadvantage because they lack wealth. Tennessee and Utah have much less excuse! Delaware’s unique economic position allows it to raise significant revenue with little effort.

Finally, the effort –> revenue relationship would be of little consequence if it was not also the case that the predicted state and local revenue differences across states are associated with those pesky NAEP outcomes. Yes, there does exist a modest relationship (with many entangled underlying factors) between state and local revenues and NAEP outcomes.

There is indeed a lot tangled up in the various relationships presented above. But one thing is clear – DATA QUALITY ALONE PROVIDES LITTLE USEFUL INFORMATION ABOUT THE QUALITY OF A STATE’S EDUCATION SYSTEM! Our obsession with comparing states on this basis has caused us and policymakers to take their eye off the ball (former tennis coach speaking here!). Applauding states and financially rewarding them (RttT) merely for collecting better data with little attention to the actual school systems and children served (or not served) by those systems is, at best, disingenuous. 

To quote John McEnroe – You cannot be serious!

Racing Where? (the DFER list)

A few quick comments on the Democrats for Ed Reform list of states in line for RttT funds.

  • The list includes two of the only states that year after year maintain a pattern of higher poverty school districts receiving systematically fewer resources than lower poverty school districts – New York and Illinois. Colorado is also on the systematically regressive funding list – but is not a year after year standout like the other two.
  • The list includes the two states which allocate the smallest share of their gross state product to public education – Louisiana and Delaware. To add insult to injury, based on American Community Survey Data from 2007, neither Delaware nor Louisiana even serves 80% of its 6 to 16 year olds in the public school system (a “coverage” metric).
  • The list includes the state with the absolute lowest cost and need adjusted per pupil state and local revenue among all states – Tennessee.

The DFER post notes that Illinois’ chances aren’t lookin’ as good as earlier this year. But, TN, DE, CO and LA  sound like strong contenders! (?)

Details on methods and analysis behind these findings available on request in  the near future. Cheers!

Update – Do School Finance Reforms Matter?

Here’s an excerpt from a forthcoming article on whether school finance reforms have made any difference for students. The article is partly in response to claims by Eric Hanushek and Alfred Lindseth that school finance reforms have resulted in massive increases in funding to public schools which have not helped and may have in fact harmed children. My forthcoming work on this topic is co-authored with Kevin Welner of U. of Colorado.

=====

In terms of quality and scope, the most useful single study of judicially induced state finance reform was published by Card and Payne in 2002. They found that court declarations of unconstitutionality in the 1980s increased the relative funding provided to low-income districts. And they found that these school finance reforms had, in turn, significant equity effects on academic outcomes:

Using micro samples of SAT scores from this same period, we then test whether changes in spending inequality affect the gap in achievement between different family background groups. We find evidence that equalization of spending leads to a narrowing of test score outcomes across family background groups. (p. 49)

To evaluate distributional changes in school finance, Card and Payne estimated the partial correlations between current expenditures per pupil and median family income, conditional on other factors influencing demand for public schooling across districts within states and over time. Card and Payne then measured the differences in the change in income-associated spending distribution between states where school funding systems had been overturned, upheld, or where no court decision had been rendered. Importantly, they also evaluated whether structural changes to funding formulas (that is, the actual reforms) were associated with changes to the income-spending relationship, conditional on the presence of court rulings.

To make the final link between income-spending relationships and outcome gaps, Card and Payne evaluated changes in gaps in SAT scores among individual SAT test-takers categorized by family background characteristics.[1] Put in terms of our Figure 1, Card and Payne (2002) appear to have taken the greatest care in a multi-year, cross-state study, to establish appropriate linkages between litigation, reforms by type, changes in the distribution of funding, and related changes in the distribution of outcomes.

Notwithstanding the generally acknowledged importance of this study,[2] Hanushek and Lindseth (2009) never mention it in their book, including the chapter in which they conclude that school finance reforms have no positive effects.

This omission – as well as the other omissions noted below – is telling of a larger point. The development of, and reliance upon, a research base should depend on relatively objective criteria. Readers depend on authors of literature reviews to come forward with the best and most applicable research bearing on the issues under consideration. While Hanushek and Lindseth might argue that this particular omission is because Card and Payne (2002) are speaking to equity (not adequacy) litigation, we have already described how the line between equity and adequacy is not so simple. Moreover, the research that Hanushek and Lindseth do choose to include goes far beyond that directly focused on adequacy – including the Cato study of a Kansas City desegregation order discussed below.

Another key study not mentioned by Hanushek and Lindseth (2009) concerned the effects of reforms implemented under the Kansas court’s pre-ruling in 1992 (Deke, 2003). The reforms leveled up funding in low-property-wealth school districts, and Deke found as follows:

Using panel models that, if biased, are likely biased downward, I have a conservative estimate of the impact of a 20% increase in spending on the probability of going on to postsecondary education. The regression results show that such a spending increase raises that probability by approximately 5% (p. 275).

The Kansas reforms addressed by Deke (2003) came as a result of a judicial pre-order, advising the legislature that if the pending suit made it to trial, the judge would declare the school finance system unconstitutional (Baker and Green, 2006).

Hanushek and Lindseth (2009) also omitted from their discussion two additional studies, both peer-reviewed, that explore the effects of Michigan’s school finance reforms, known as “Proposal A,” implemented in the mid-1990s. Michigan’s reforms were implemented without ruling or high level of litigation threat, but the reforms were nonetheless comparable in many ways to reforms implemented following judicial rulings[3] (see Leuven et al., 2007; and Papke, 2001). In the first study, Papke (2001) finds:

Focusing on pass rates for fourth-grade and seventh grade math tests (the most complete and consistent data available for Michigan), I find that increases in spending have nontrivial, statistically significant effects on math test pass rates, and the effects are largest for schools with initially poor performance. (Papke, 2001, p. 821.)

Leuven and colleagues (2007) find no positive effects of two specific increases in funding targeted to schools with elevated at-risk populations, a convenient conclusion for Hanushek and Lindseth to have included.

A third Michigan study (available online since 2003 as a working paper from Princeton University, and now accepted for publication in Education Finance and Policy, a peer-reviewed journal) directly estimates the relationship between implemented reforms and subsequent outcomes (Roy, 2003). Roy, whose work was not cited by Hanushek and Lindseth, finds:

Proposal A was quite successful in reducing inter-district spending disparities. There were also significant gains in achievement in the poorest districts, as measured by success in state tests. However, as yet these improvements do not show up in nationwide tests like NAEP and ACT. (Roy, 2003, p. 1.)

Most recently, a study by Choudhary (2009) “estimate[s] the causal effect of increased spending on 4th and 7th grade math scores for two test measures—a scale score and a percent satisfactory measure” (p. 1). She “find[s] positive effects of increased spending on 4th grade test scores. A 60% percent increase in spending increases the percent satisfactory score by one standard deviation” (p. 1).

Perhaps because there was no judicial order involved in Michigan, researchers were able to avoid the tendency to focus on or classify the judicial order. Moreover, single-state studies generally avoid such problems because there is little statistical purpose in classifying litigation. Importantly, each of these studies focuses instead on measures of the changing distribution and level of spending (characteristics of the reforms themselves) and resulting changes in the distribution and level of outcomes. Each takes a different approach, but attempts to appropriately align their measures of spending change and outcome change, adhering to principles laid out in our Figure 1.

Other high-quality but non-peer reviewed empirical estimates of the effects of specific school finance reforms linked to court orders have been published for Vermont and Massachusetts. For example, Downes (2004), in an evaluation of Vermont school finance reforms that were ordered in 1997 and implemented in 1998, found as follows:

All of the evidence cited in this paper supports the conclusion that Act 60 has dramatically reduced dispersion in education spending and has done this by weakening the link between spending and property wealth. Further, the regressions presented in this paper offer some evidence that student performance has become more equal in the post–Act 60 period. And no results support the conclusion that Act 60 has contributed to increased dispersion in performance. (p. 312)

Hanushek and Lindseth (2009) never acknowledge this positive finding (although they do briefly cite the Downes evaluation, for a different point). Again, one might attribute this omission to the argument that the Vermont reforms were equity reforms, not adequacy reforms. However, similar to the 1992 Kansas reforms, the overall effect of the Vermont Act 60 reforms was to level up low-wealth districts and increase state school spending dramatically, thus addressing both adequacy and equity.

For Massachusetts, two independent sets of authors (in addition to Hanushek and Lindseth) have found positive reform effects. Most recently — after the Hanushek and Lindseth book was written — Downes, Zabel and Ansel (2009) found:

The achievement gap notwithstanding, this research provides new evidence that the state’s investment has had a clear and significant impact. Specifically, some of the research findings show how education reform has been successful in raising the achievement of students in the previously low-spending districts. Quite simply, this comprehensive analysis documents that without Ed Reform the achievement gap would be larger than it is today. (p. 5)

Previously, Guryan (2003) found:

Using state aid formulas as instruments, I find that increases in per-pupil spending led to significant increases in math, reading, science, and social studies test scores for 4th- and 8th-grade students. The magnitudes imply a $1,000 increase in per-pupil spending leads to about a third to a half of a standard-deviation increase in average test scores. It is noted that the state aid driving the estimates is targeted to under-funded school districts, which may have atypical returns to additional expenditures. (p. 1)

Although Hanushek and Lindseth concede that Massachusetts reforms appear successful,[4] they failed to cite Guryan’s NBER working paper, the inclusion of which would have (like most other omitted studies) weakened their overall conclusions about the non-impact of these reforms.

Turning to New Jersey, two recent (though not yet peer-reviewed) studies find positive effects of that state’s finance reforms. Alexandra Resch (2008), in a study published as a dissertation for the economics department at the University of Michigan, found evidence suggesting that New Jersey Abbott districts “directed the added resources largely to instructional personnel” (p. 1) such as additional teachers and support staff. She also concluded that this increase in funding and spending improved the achievement of students in the affected school districts. Looking at the statewide 11th grade assessment (“the only test that spans the policy change”), she found “that the policy improves test scores for minority students in the affected districts by one-fifth to one-quarter of a standard deviation” (p. 1).

The second recent study was originally presented at a 2007 conference at Columbia University, and a revised, peer-reviewed version was recently published by the Campaign for Educational Equity at Teachers College, Columbia University (Goertz and Weiss, 2009). This paper offered descriptive evidence that reveals some positive test results of recent New Jersey school finance reforms:

State Assessments: In 1999 the gap between the Abbott districts and all other districts in the state was over 30 points. By 2007 the gap was down to 19 points, a reduction of 11 points or 0.39 standard deviation units. The gap between the Abbott districts and the high-wealth districts fell from 35 to 22 points. Meanwhile performance in the low-, middle-, and high-wealth districts essentially remained parallel during this eight-year period (Figure 3, p. 23).

NAEP: The NAEP results confirm the changes we saw using state assessment data. NAEP scores in fourth-grade reading and mathematics in central cities rose 21 and 22 points, respectively between the mid-1990s and 2007, a rate that was faster than the urban fringe in both subjects and the state as a whole in reading (p. 26).

The Goertz and Weiss paper (which was, as designed and intended by the paper’s authors, the statistically least rigorous analysis of the ones presented here) does receive mention from Hanushek and Lindseth multiple times, but only in an effort to discredit and minimize its findings.

Card, D. and Payne, A. A. (2002). School Finance Reform, the Distribution of School Spending, and the Distribution of Student Test Scores. Journal of Public Economics, 83(1), 49-82.

Choudhary, L. (2009). Education Inputs, Student Performance and School Finance Reform in Michigan. Economics of Education Review, 28(1), 90-98.

Deke, J. (2003). A study of the impact of public school spending on postsecondary educational attainment using statewide school district refinancing in Kansas, Economics of Education Review, 22(3), 275-284.

Downes, T. A. (2004). School Finance Reform and School Quality: Lessons from Vermont. In Yinger, J. (ed), Helping Children Left Behind: State Aid and the Pursuit of Educational Equity. Cambridge, MA: MIT Press.

Downes, T. A., Zabel, J., Ansel, D. (2009). Incomplete Grade: Massachusetts Education Reform at 15. Boston, MA. MassINC.

Goertz, M., and Weiss, M. (2009). Assessing Success in School Finance Litigation: The Case of New Jersey. New York City: The Campaign for Educational Equity, Teachers College, Columbia University.

Guryan, J. (2003). Does Money Matter? Estimates from Education Finance Reform in Massachusetts. Working Paper No. 8269. Cambridge, MA: National Bureau of Economic Research.

Leuven, E., Lindahl, M., Oosterbeek, H., and Webbink, D. (2007). The Effect of Extra Funding for Disadvantaged Pupils on Achievement. The Review of Economics and Statistics, 89(4), 721-736.

Resch, A. M. (2008). Three Essays on Resources in Education (dissertation). Ann Arbor: University of Michigan, Department of Economics. Retrieved October 28, 2009, from http://deepblue.lib.umich.edu/bitstream/2027.42/61592/1/aresch_1.pdf

Roy, J. (2003). Impact of School Finance Reform on Resource Equalization and Academic Performance: Evidence from Michigan. Princeton University, Education Research Section Working Paper No. 8. Retrieved October 23, 2009 from http://papers.ssrn.com/sol3/papers.cfm?abstract_id=630121 (Forthcoming in Education Finance and Policy.)


[1] Card and Payne provide substantial detail on their methodological attempts to negate the usual role of selection bias in SAT test-taking patterns. They also explain that their preference was to measure more directly the effects of income-related changes in current spending per pupil on income-related changes in SAT performance, but that the income measures in their SAT database were unreliable and could not be corroborated by other sources. As such, Card and Payne used combinations of parent education levels to proxy for income and socio-economic differences between SAT test takers.

[2] As one indication of its prominence among researchers, as of the writing of this article, Google Scholar identified 153 citations to this article.

[3] There is little reason to assume that the presence of judicial order would necessarily make otherwise similar reforms less (or more) effective, though constraints surrounding judicial remedies may.

[4] Hanushek and Lindseth attribute the success of the Massachusetts reforms not to spending, but to the fact that the “remedial steps passed by the legislature also included a vigorous regime of academic standards, a high-stakes graduation test, and strict accountability measures of a kind that have run into resistance in other states, particularly from teachers unions” (p. 169). That is, it was not the funding that mattered in Massachusetts, but rather it was the accountability reforms that accompanied the funding.

NJ Charter Update – Math Trends over Time

Note: This is not a “Study.” This is just a summary of NJDOE Report Card Data, which can be found here: http://education.state.nj.us/rc/

I made a few more graphs for fun today, pursuing the question of whether the shares of children scoring only “partially proficient” over time are changing in New Jersey Charter Schools at any different rate from the shares scoring partially proficient in traditional public school districts. Note, of course, that partially proficient is a nice way of saying – failed the test. Each graph below includes only General Education students, as I have previously shown that NJ Charters serve very few if any special education students and including these students substantially changes performance levels for non-Charters. Again, it is most relevant to compare visually the Charter schools to schools in district factor groups A and B, because Charter schools do tend to serve children from these districts – primarily A. But, as the graphs show, Charters have continued to perform similarly to schools in DFG A (less well in Grade 4).

"R" indicates Charter Schools
"R" indicates Charter
"R" Indicates Charter Schools

Smarter School Leaders

Smarter School Leaders: Enough to reverse the trend?

http://www.nytimes.com/2009/12/05/opinion/05herbert.html?_r=1

This recent New York Times article highlights a new doctoral program for educational leaders that is a joint venture of Harvard Graduate School of Education, Kennedy School of Government and Harvard Business School. An interesting approach indeed and one that will hopefully generate some top quality leaders for public schools and school districts. But, there are about 100,000 public schools out there, spread across 16,000 or so school districts and public charter schools. In the best of cases, each of these schools and districts would get the best and brightest possible leader. My guess, however, is that this new Harvard program will barely make a dent in our national needs.

Perhaps the new Harvard program can serve as a model for making a bigger and better dent.  Now, when I say that, I should clarify that I’m not taking the pop-policy position that this program is a model simply because it involves a business school and public policy school and the education school, but rather because it involves a GOOD business school, HIGH QUALITY public policy school and TOP NOTCH education school. There are as many, if not more intellectually vacuous b-school programs as comparably vacuous ed-school programs. You see, it’s not about b-school versus ed-school. It’s about high quality schools with highly self-selective pools of degree-seekers and top notch faculty deciding to play a more significant role in public school leadership. However, it’s going to be an uphill battle!

A few years back, Michelle Young, Terry Orr and I explored changing patterns of degree production in educational administration. With other colleagues, I explored the characteristics of faculty in educational administration programs, their pipeline and their qualifications. More recently, I’ve been exploring the effects of the changing principal preparation pipeline on schools in states like Missouri. AND IT’S NOT A PRETTY PICTURE!

Michelle, Terry and I found in our degree production study, that:

“The largest number and greatest increase were among master’s degrees. In 2003, there were 15,720 master’s degrees conferred in educational leadership, a 90 percent increase since 1993.”

And:

“Even more striking are the increases in master’s degree granting programs at Comprehensive II and Liberal Arts II institutions. Such program increases reflect a dramatic growth in the availability of programs in local and regional institutions.”

And further, that:

“The percentage of all master’s degrees produced by higher status institutions, the Research I through Doctoral II institutions dropped from 42 percent in 1993 to 36 percent in 2003.”

That is, master’s degree production in particular has mushroomed over the past decade-and-a-half and many of the new masters degrees produced are from institutions that previously had minimal involvement in educational administration and are generally considered lower status institutions.

The figure below shows the top Educational Administration masters’ granting institutions in 1990 and then again for the period from 2002 to 2005, based on data from my study with Michelle Young and Terry Orr. The data are from the National Center for Education Statistics, Integrated Postsecondary Education Data System – Degree Completion files. In 1990, Harvard made the list. But by the later period (and perhaps even worse by now), the list had changed – a lot. The list now includes mass-producers of graduate degrees like Nova Southeastern University and William Woods (Missouri) pumping out about 500 masters degrees per year in educational administration (and related degree codes). Other standout newcomers include Lindenwood University (also Missouri), National Louis University (Illinois) and St. Peters College (New Jersey).

From 2002 to 2005, Harvard continued production at its 1990 levels, like many major research universities. But by 2002 to 2005, Harvard had dropped to 68th in production, right behind Mid-America Nazarene University in Kansas (their radio jingle still sticks in my head from my Kansas years… MNU, not Harvard… who I doubt has a radio jingle).

If trends in Masters’ Degree production weren’t bad enough, similar if not more disturbing trends have occurred in the production of doctoral degrees in educational administration. In 1990, Harvard reported about 40 doctoral degrees in Educational Administration and Nova Southeastern about 100. Bad enough already. By 2005, Harvard was no-longer listing or reporting doctoral degrees granted under program codes for Educational Administration, and the biggest producers nationally were: Nova Southeastern (368), Argosy University – Sarasota (196), St. Louis University (62).  Even if these programs were/are credible, managing the quality control on 200 to 400 doctoral candidates per year seems problematic at best. Simply finding, enrolling and retaining 200 to 400 high quality candidates willing to pursue this type of degree seems a bit of a stretch! How many applied? How many, if any were rejected?

The damage done by these institutions and the diversified production of educational leaders is astounding in some states. In 1999, only a few principals of Missouri public schools held graduate degrees from the state’s emerging degree-mills. By 2006, 185 held their Masters’ degrees from Lindenwood University and 205 from William Woods out of a data set having just over 2,000 completely matched records over time. Nearly 400 of 2,000 or nearly 20% of Missouri principals held degrees from institutions which are arguably hardly qualified to grant them.

Principals who attended these graduate programs are substantially more likely to have attended the least competitive undergraduate colleges. For William Woods University, 80% of Masters Degree recipients who became Missouri principals attended undergraduate colleges in the bottom 3 (of 6) categories of competitiveness (based on Barrons’ Guide ratings) compared to 68% of principals statewide.

And further, the shares of teachers who also attended the least competitive colleges hired into schools headed by these principals have grown dramatically – from 65% to 75% from bottom two categories of Barrons’ ratings in 7 years – and faster than for other schools statewide.

This shift would be inconsequential were it not for strong and consistent evidence from a multitude of studies that the academic caliber of the teacher workforce is highly relevant to student success. While many sources highlight this issue (see for example, Baker & Cooper, 2005), Loeb and colleagues provide a particularly striking in the work in New York City. They report that:

“ . . . almost half of the teachers in the most effective quintile (based on student outcomes) graduated from a college ranked competitive or higher by Barron’s, compared to only ten percent of the teachers in the least effective quintile.”(p. 23)

This is a serious issue and one state policy makers seem unwilling to address. National accrediting agencies are comparably unwilling and/or incapable of addressing this educational leadership brain drain.

A graduate program in educational leadership or any field is only as good as the quality of its students and faculty, but criteria for program accreditation pay little attention to either the academic quality of students or qualifications of faculty.

Altering the quality of school leadership requires greater involvement of leading public and private universities, pursuing endeavors like the new Harvard program. But equally important, altering the quality of school leadership requires that state policymakers step up and shut down institutions that by the quality of their average student and qualifications of their faculty have no business preparing school leaders.

While this argument might easily be construed as academic elitism, it is important to acknowledge that this argument relates to the preparation of leaders for academic institutions –namely public schools. It is difficult to conceive of a rational argument for ignoring the relevance of academic credentials for individuals wishing to lead academic institutions.

Relevant research readings:

Baker, B., & Cooper, B. (2005). Do principals with stronger academic backgrounds hire better teachers? Policy implications for improving high-poverty schools. Educational Administration Quarterly, 41(3), 413-448.

Baker, B.D, Orr, M.T., Young, M.D. (2007) Academic Drift, Institutional Production and Professional Distribution of Graduate Degrees in Educational Administration. Educational Administration Quarterly 43 (3)  279-318

Baker, B.D., Wolf-Wendel, L.E., Twombly, S.B. (2007) Exploring the Faculty Pipeline in Educational Administration: Evidence from the Survey of Earned Doctorates 1990 to 2000. Educational Administration Quarterly 43 (2) 189-220