Gates Still Doesn’t Get It! Trapped in a World of Circular Reasoning & Flawed Frameworks

Not much time for a thorough review of the most recent release of the Gates MET project, but here are my first cut comments on the major problems with the report. The take home argument of the report seems to be that their proposed teacher evaluation models are sufficiently reliable for prime time use and that the preferred model should include about 33 to 50% test score based statistical modeling of teacher effectiveness coupled with at least two observations on every teacher. They come to this conclusion by analyzing data on 3,000 or so teachers across multiple cities.  They arrive at the 33 to 50% figure, coupled with two observations, by playing a tradeoff game. They find – as one might expect – that prior value added of a teacher is still the best predictor of itself a year later… but that when the weight on observations is increased, the year to year correlation for the overall rating increases (well, sort of). They still find relatively low correlations between value-added ratings for teachers on state tests and ratings for the same teachers with the same kids on higher order tests.

So, what’s wrong with all of this? Here’s my quick run-down:

1. Self-validating Circular Reasoning

I’ve written several previous posts explaining the absurdity of the general framework of this research which assumes that the “true indicator of teacher effectiveness” is the following year value-added score. That is, the validity of all other indicators of teacher effectiveness is measured by their correlation to the following year value added (as well as value-added when estimated to alternative tests – with less emphasis on this). Thus, the researchers find – to no freakin’ surprise – that prior year value added is, among all measures, the best predictor of itself a year later. Wow – that’s a revelation!

As a result, any weighting scheme must include a healthy dose of value-added.  But, because their “strongest” predictor of itself analysis put too much weight on VAM to be politically palatable, they decided to balance the weighting by considering year to year reliability (regardless of validity).

The hypocrisy of their circular validity test is best revealed in this quote from the study:

Teaching is too complex for any single measure of performance to capture it accurately.

But apparently the validity of any/all other measures can be assessed by the correlation with a single measure (VAM itself)!?????

See also:

Evaluating Evaluation Systems

Weak Arguments for Using Weak Indicators

2. Assuming Data Models Used in Practice are of Comparable Quality/Usefulness

I would go so far as to say that it is reckless to assert that the new Gates findings on this relatively select sub-sample of teachers (for whom high quality data were available on all measures over multiple years) have much if any implication for the usefulness of the types of measures and models being implemented across states and districts.

I have discussed the reliability and bias issues in New York City’s relatively rich value-added model on several previous occasions. The NYC model (likely among the “better” VAMs) produces results that are sufficiently noisy from year to year to raise serious questions about their usefulness. Certainly, one should not be making high stakes decisions based heavily on the results of that model. Further, averaging over multiple years means, in many cases, averaging scores that jump from the 30th to 70th percentile and back again.  In such cases, averaging doesn’t clarify, it masks. But what the averaging may be masking is largely noise. Averaging noise is unlikely to reveal a true signal!

Further, as I’ve discussed several times on this blog, many states and districts are implementing methods far more limited than a “high quality” VAM and in some cases states are adopting growth models that don’t attempt – or only marginally attempt – to account for any other factors that may affect student achievement over time.  Even when those models to make some attempts to account for differences in students served, in many cases as in the recent technical report on the model recommended for use in New York State, those models fail! And they fail miserably.  But despite the fact that those models fail so miserably at their central, narrowly specified task (parsing teacher influence on test score gain) policymakers continue to push for their use in making high stakes personnel decisions.

The new Gates findings – while not explicitly endorsing use of “bad” models – arguably embolden this arrogant, wrongheaded behavior!  The report has a responsibility to be clearer as to what constitutes a better and more appropriate model versus what constitutes an entirely inappropriate one.

See also:

Reliability of NYC Value-added

On the stability of being Irreplaceable (NYC data)

Seeking Practical uses of the NYC VAM data

Comments on the NY State Model

If it’s not valid, reliability doesn’t matter so much (SGP & VAM)

3. Continued Preference for the Weighted Components Model

Finally, my biggest issue is that this report and others continue to think about this all wrong. Yes, the information might be useful, but not if forced into a decision matrix or weighting system that requires the data to be used/interpreted with a level of precision or accuracy that simply isn’t there – or worse – where we can’t know if it is.

Allow me to copy and paste one more time the conclusion section of an article I have coming out in late January:

As we have explained herein, value-added measures have severe limitations when attempting even to answer the narrow question of the extent to which a given teacher influences tested student outcomes. Those limitations are sufficiently severe such that it would be foolish to impose on these measures, rigid, overly precise high stakes decision frameworks.  One simply cannot parse point estimates to place teachers into one category versus another and one cannot necessarily assume that any one individual teacher’s estimate is necessarily valid (non-biased).  Further, we have explained how student growth percentile measures being adopted by states for use in teacher evaluation are, on their face, invalid for this particular purpose.  Overly prescriptive, overly rigid teacher evaluation mandates, in our view, are likely to open the floodgates to new litigation over teacher due process rights, despite much of the policy impetus behind these new systems supposedly being reduction of legal hassles involved in terminating ineffective teachers.

This is not to suggest that any and all forms of student assessment data should be considered moot in thoughtful management decision making by school leaders and leadership teams. Rather, that incorrect, inappropriate use of this information is simply wrong – ethically and legally (a lower standard) wrong. We accept the proposition that assessments of student knowledge and skills can provide useful insights both regarding what students know and potentially regarding what they have learned while attending a particular school or class. We are increasingly skeptical regarding the ability of value-added statistical models to parse any specific teacher’s effect on those outcomes. Further, the relative weight in management decision-making placed on any one measure depends on the quality of that measure and likely fluctuates over time and across settings. That is, in some cases, with some teachers and in some years, assessment data may provide leaders and/or peers with more useful insights.  In other cases, it may be quite obvious to informed professionals that the signal provided by the data is simply wrong – not a valid representation of the teacher’s effectiveness.

Arguably, a more reasonable and efficient use of these quantifiable metrics in human resource management might be to use them as a knowingly noisy pre-screening tool to identify where problems might exist across hundreds of classrooms in a large district. Value-added estimates might serve as a first step toward planning which classrooms to observe more frequently. Under such a model, when observations are completed, one might decide that the initial signal provided by the value-added estimate was simply wrong. One might also find that it produced useful insights regarding a teacher’s (or group of teachers’) effectiveness at helping students develop certain tested algebra skills.

School leaders or leadership teams should clearly have the authority to make the case that a teacher is ineffective and that the teacher even if tenured should be dismissed on that basis. It may also be the case that the evidence would actually include data on student outcomes – growth, etc. The key, in our view, is that the leaders making the decision – indicated by their presentation of the evidence – would show that they have used information reasonably to make an informed management decision. Their reasonable interpretation of relevant information would constitute due process, as would their attempts to guide the teacher’s improvement on measures over which the teacher actually had control.

By contrast, due process is violated where administrators/decision makers place blind faith in the quantitative measures, assuming them to be causal and valid (attributable to the teacher) and applying arbitrary and capricious cutoff-points to those measures (performance categories leading to dismissal).   The problem, as we see it, is that some of these new state statutes require these due process violations, even where the informed, thoughtful professional understands full well that she is being forced to make a wrong decision. They require the use of arbitrary and capricious cutoff-scores. They require that decision makers take action based on these measures even against their own informed professional judgment.

See also:

The Toxic Trifecta: Bad Measurement & Evolving Teacher Evaluation Policies

Thoughts on Data, Assessment & Informed Decision Making in Schools

RheeFormy Logic & Goofball Rating Schemes: Comments & Analysis on the Students First State Policy Grades

On Monday, the organization Students First came out with their state policy rankings, just in time to promote their policy agenda in state legislatures across the country. Let’s be clear, Students First’s state policy rankings are based on a list of what Students First thinks states should do. It’s entirely about their political preferences – largely reformy policies – template stuff that has been sweeping the reformiest states over the past few years. I’ll have more to say about these preferred policies at the end of this post.

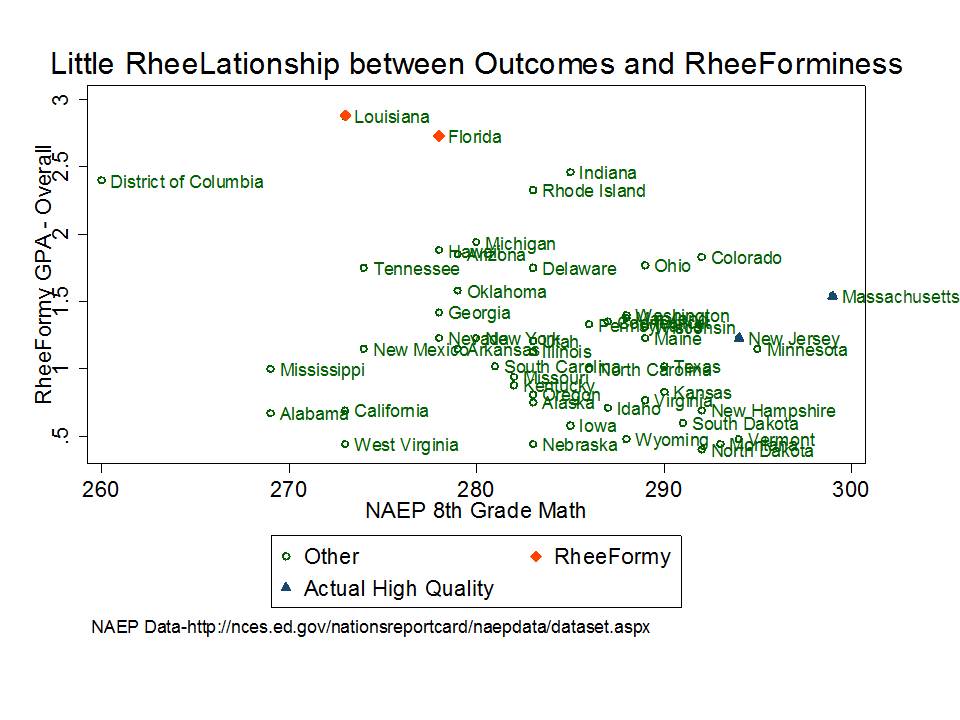
Others have already pointed out that Students First gave good grades to states like Louisiana and Florida, and crummy grades to states like New Jersey or Massachusetts – but that states like Louisiana have notoriously among the worst school systems – lowest test scores – in the nation – whereas states like New Jersey and Massachusetts have pretty darn good test scores and well respected school systems. I’ll go there as well, but not as my primary focus. Clearly there’s  more behind the test score differences than policy context. New Jersey and Massachusetts certainly have more educated, more affluent adult and parent populations than Louisiana, and that makes a difference.

I’ll anxiously await the day good reformers like Mike Petrilli pack their bags and leave their suburban Washington DC districts to move their kids to the amazing future schools of Louisiana!  Heck, given these new Students First ratings, any Louisiana school has to be better- or at least have far more potential – than any school in Montgomery County Maryland, run by that curmudgeonly anti-reformer Suprintendent Joshua Starr!  In fact, in my ideal world, Louisiana would become a reformy wonderland… magnet for all the reformy types… where they could go live in peace – rate their teachers by value-added models, fire 10 to 20% each year – pay them nothing – get rid of any retirement benefits, make every school a charter school (operating primarily with imported Turkish and/or Filipino labor), engage in at least 50% online learning (sitting at a computer doing test prep modules), and provide tuition tax credits to all of the reformies who prefer a purely religious perspective interwoven across subjects. Of course, this must all be done with Lousiana’s current level of financial commitment to public schooling.

But I digress… Now back to the Students First ratings.  Students First created 3 broad categories of preferred policies for their ratings – policies that it believes:

  1. Elevate teaching
  2. Empower parents
  3. Spend wisely and govern well

By elevate teaching, Students First means the usual basket of reformy options including elimination of traditional salary schedules, teacher evaluations based heavily on student test scores, reduction of retirement benefits and reduction or elimination of due process rights, and pay based primarily on test-score driven evaluation systems. They also prefer to expand alternative routes into the teaching profession. Of course, there’s not a whole lot of transparency into how these various elements are factored into the final grades. But there is a rubric!

By empowering parents, Students First essentially means increasing use of school report cards (more school grades & ratings – yes, a report card that endorses use of … report cards!), reporting to parents when their child is assigned to a teacher with a low rating (driven by test scores), and adoption of policies such as Parent Trigger. And of course, charters should be provided everywhere and anywhere… so everyone has the choice to attend one.

Finally, by spend wisely and govern well… I’m quite honestly not even sure what the hell they mean? They include a broad statement about all kids receiving equitable funding, but seem to imply that this means that charter kids get the same funding as district kids – a pretty narrow interpretation of fairness (and an incalculable one in states with no charters). No actual data seem to be used to rate state funding systems. Fairness is also determined by the provision of publicly finance facilities space to charter schools. Somehow, their ratings of funding totally ignore the vast majority of schools and children across which funds are distributed. In their view, Mayors, not local school boards should govern schools, and schools should report their expenditures uniformly – in a way that shows how the spending affects achievement (good luck with that as a reporting requirement/mechanism).

Every item on their list is somehow mysteriously scored on a “0” (you suck) to “4” (wow… you are REFORMERIFIC!) scale without using any actual data (apparently) to inform that ordinal rating. Then in a wonderful leap of number abuse, these ordinal scale data are averaged to create a grade point average for each broad category – on a 0-4 GPA like scale, where most values of course lie in the imaginary spaces between the original ordinal ratings (like kinda-semi-almost-reformerific = 3.49).

That said, let’s dig into those grades, and other stuff that may or may not correlate with them.

RheeFormy Funding Indicators vs. Real Funding Indicators

Let’s start with the funding grades which I will relate to two of our primary indicators in our annual report on school funding fairness. First, let’s look at the relationship between the RheeFormy GPA for funding/governance and our rating on the percent of gross state product allocated to K-12 education. Top scorers on RheeFormy funding are Michigan, Rhode Island, New York, Alaska and Illinois. Right away this is rather absurd since New York and Illinois are quite well known to have among the least equitable school funding systems in the nation…. but that’s the next graph. RheeFormy winners Florida and Louisiana are not particular standouts on their funding effort to education, whereas the states of New Jersey and Massachusetts, despite being much richer to begin with, allocate a much larger share of their economic productivity to elementary and secondary education. But hey, why would anyone want to count how much effort a state actually puts into funding its schools? right? how could that matter?

Figure 1.

Slide2

Figure 2 compares the RheeFormy finance GPA to our indicator of funding fairness. Our indicator of funding fairness compares the projected state and local revenue of high poverty school districts to that of low poverty school districts. A value of greater than 1.0 indicates a progressive system where more resources are allocated to higher poverty districts and a value of less than 1.0 indicates a regressive system. Not surprisingly, the RheeFormy standouts of Florida and Louisiana and especially New York and Illinois (which are among the top in RheeFormy finance) are all highly regressive states. Uh… that’s bad… not good. High poverty districts get the shaft in these states. But that’s apparently just fine with Students First. In fact, it seems preferable! Way to go!

Meanwhile, New Jersey and Massachusetts, along with Ohio, are relatively progressive on finance. Yes, Utah is too, but that’s because Utah spends next to nothing on most schools and slightly more than next to nothing on lower income schools.

So, apparently, RheeFormy logic dictates that to really make progress on achievement in low income communities, money really doesn’t matter. State school finance systems don’t matter, and in fact, spending less on districts with more poor children is the way to go. Good for New York and Illinois! NOT!

Figure 2.

Slide3

What we know about school finance reforms, funding level & distribution & student outcomes

…sustained improvements to the level and distribution of funding across local public school districts can lead to improvements in the level and distribution of student outcomes. While money alone may not be the answer, adequate and equitable distributions of financial inputs to schooling provide a necessary underlying condition for improving adequacy and equity of outcomes. That is, if the money isn’t there, schools and districts simply don’t have a “leverage option” that can support strategies that might improve student outcomes. If the money is there, they can use it productively; if it’s not, they can’t. But, even if they have the money, there’s no guarantee that they will. Evidence from Massachusetts, in particular, suggests that appropriate combinations of more funding with more accountability may be most promising.

See: http://www.shankerinstitute.org/images/doesmoneymatter_final.pdf

Put bluntly – equitable and adequate financing for the education of all children is a prerequisite condition for achieving equitable and adequate outcomes. The Students First rating system misses this point entirely – measuring neither the equity nor adequacy – nor effort to raise these prerequisite resources.

No, the Students First ratings don’t pretend to measure these things. But, they seem to argue that their ratings measure the prerequisite conditions for reforming education systems – where I must assume they mean making those systems better. But the reality is that the ratings focus on trivial and tangential reformy preferences, leading them to praise states that are among the worst in the nation on school funding and chastise states that are among the best.

RheeFormy Teacher Quality Indicators vs. Competitive Compensation

Next up are the RheeFormy ratings on elevating the teaching profession, where quite clearly, having competitive wages for teachers (relatively to the workforce of similarly educated workers) is a non-issue. Figure 3 shows the relationship between the relative weekly wage of teachers – compared to same education level non-teachers – and the elevating teaching GPA.  Teachers in Louisiana have among the largest “teaching penalties” earning only about 70% of the weekly wage of non-teachers. That’ll certainly elevate the profession! They are right up there with other stellar reformy states including Colorado and Tennessee.  Teachers in Florida do a bit better. Teachers in Massachusetts don’t do that well either, but Massachusetts is a state where non-teacher wages are quite high. So being relatively low in Massachusetts might not be as bad as being relatively low in Louisiana or Tennessee! (They also have the benefit of being able to send their own kids to pretty good public schools.) Teacher wages in New Jersey are more competitive, even in their higher non-teacher wage competitive context.

Figure 3.

Slide5

In really simple terms – competitive wages are the first step toward elevating the teaching profession. Given what we actually know from research on “elevating the teaching profession” I don’t expect to see America’s best teachers flocking to Louisiana, Colorado and Tennessee anytime soon. But, I certainly hope to see those reformers in their caravan, moving their families to those reformy promise lands!

What we know about policy conditions for a strong teacher workforce

A substantial body of literature has accumulated to validate the conclusion that both teachers’ overall wages and relative wages affect the quality of those who choose to enter the teaching profession, and whether they stay once they get in. For example, Murnane and Olson (1989) found that salaries affect the decision to enter teaching and the duration of the teaching career,[i] while Figlio (1997, 2002) and Ferguson (1991) concluded that higher salaries are associated with more qualified teachers.[ii] In addition, more recent studies have tackled the specific issues of relative pay noted above. Loeb and Page showed that:

“Once we adjust for labor market factors, we estimate that raising teacher wages by 10 percent reduces high school dropout rates by 3 percent to 4 percent. Our findings suggest that previous studies have failed to produce robust estimates because they lack adequate controls for non-wage aspects of teaching and market differences in alternative occupational opportunities.”[iii]

In short, while salaries are not the only factor involved, they do affect the quality of the teaching workforce, which in turn affects student outcomes.

Research on the flip side of this issue – evaluating spending constraints or reductions – reveals the potential harm to teaching quality that flows from leveling down or reducing spending. For example, David Figlio and Kim Rueben (2001) note that, “Using data from the National Center for Education Statistics we find that tax limits systematically reduce the average quality of education majors, as well as new public school teachers in states that have passed these limits.”[iv]

Salaries also play a potentially important role in improving the equity of student outcomes. While several studies show that higher salaries relative to labor market norms can draw higher quality candidates into teaching, the evidence also indicates that relative teacher salaries across schools and districts may influence the distribution of teaching quality. For example, Ondrich, Pas and Yinger (2008) “find that teachers in districts with higher salaries relative to non-teaching salaries in the same county are less likely to leave teaching and that a teacher is less likely to change districts when he or she teaches in a district near the top of the teacher salary distribution in that county.”[v]

And what do we know about the effectiveness of the preferred Students First policies of providing performance based pay? For recent studies specifically on the topic of “merit pay,” each of which generally finds no positive effects of merit pay on student outcomes, see:

  • Glazerman, S., Seifullah, A. (2010) An Evaluation of the Teacher Advancement Program in Chicago: Year Two Impact Report. Mathematica Policy Research Institute. 6319-520
  • Springer, M.G., Ballou, D., Hamilton, L., Le, V., Lockwood, J.R., McCaffrey, D., Pepper, M., and Stecher, B. (2010). Teacher Pay for Performance: Experimental Evidence from the Project on Incentives in Teaching. Nashville, TN: National Center on Performance Incentives at Vanderbilt University.
  • Marsh, J. A., Springer, M. G., McCaffrey, D. F., Yuan, K., Epstein, S., Koppich, J., Kalra, N., DiMartino, C., & Peng, A. (2011). A Big Apple for Educators: New York City’s Experiment with Schoolwide Performance Bonuses. Final Evaluation Report. RAND Corporation & Vanderbilt University.
RheeFormy States are NOT a Model for our Nation!
Now for that discussion of outcomes I mentioned previously. Well, here’s what it looks like. The new RheeFormy ratings applaud the likes of Louisiana, Florida… Tennessee and even Washington DC. These are anything but stellar performers on national assessments, as shown in Figure 4 and Figure 5. But indeed, these are also states (and a city) with relatively high child poverty rates.
Figure 4.
Slide7
Figure 5.
Slide8
Others have argued that states like Louisiana and Florida in particular – while being low performers – have posted impressive gains on NAEP over the past 20 years (most of which predates adoption of these new RheeFormy policies). Figure 6 uses the standardize annual NAEP gains reported in THIS REPORT.  It would appear here that overall winners on the Students First Ratings do have pretty good NAEP gains over time. But, Massachussetts and New Jersey – RheeFormy losers actually posted gains on NAEP similar to those of Louisiana and Florida!
Figure 6.
Slide9
Even more impressive, New Jersey (and also Massachusetts, but 1990 scores were not available) posted strong NAEP gains despite being relatively high to begin with. As it turns out, Louisiana had nowhere to go but up. And it appears that starting out with very low NAEP scores is a pretty strong determinant of how much a state gained over time. The lower your starting point, the more you gained. But that Non-reformy New Jersey – curmudgeonly high spending, fair spending state of New Jersey – posted gains similar to Louisiana even though it started out already among the highest performing states!
Figure 7.
Slide10
And what else about those outcomes in those stick-in-the-mud union dominated states of Massachusetts and New Jersey? As it turns out, while they were working on spending their money fairly on lower income kids they were also making significant gains in reducing the percent of children scoring below proficiency on NAEP (again using data from the PEPG Catching Up report!)  Yep, there they are, flying pretty high on funding fairness and on improving the outcomes of the lowest performing students. Louisiana and Florida… well… not so much!
Figure 8.
Slide11

A Comment on Accountability, Empowerment, Transparency & Students First Preferred Policies

Finally,  I close with a topic that should be another blog post altogether, and likely will be at some point. I’ve been struck by the logic that the preferred policies in the Students First report are intended – by their framing – to increase accountability, empowerment and transparency. Yet, in all likelihood, most of these proposals accomplish precisely the opposite – substantially eroding public accountability and oversight and compromising statutory and constitutional rights of children, employees and local taxpayers.

Now, we may have our differing perspectives on the structure of our American government and operation of government entities. But, our government has a defined structure with reasonably well conceived overarching laws.

The U.S. Constitution, state constitutions and various federal and state statutes provide important protections to students and employees and the taxpayers that finance public institutions. Importantly, our constitution protects individuals from certain treatments by our government and agents of our government. Public schools – government schools to borrow from libertarian rhetoric – fall under that umbrella, and must, for example, provide children due process before depriving them the right to attend, and must respect – to a limited extent – students rights to free expression, etc. Government schools also cannot promote/endorse a particular religious viewpoint (proselytize).  Other protections, many protections of both children and employees of government institutions are invoked through Section 1983 of the U.S. Code which applies to entities that are ‘state actors’ (uh… government entities). Further, many state laws apply to government entities and to ‘public officials.’

We have a representative system of government with multiple levels, where public officials are elected by (and accountable to) voters (albeit often a small share of those eligible), and where additional layers of public officials may be appointed by elected public officials. And, as noted above, many laws, especially those pertaining to public disclosure, public meetings and public records apply to ‘public officials.’

The Students First state policy rating system – like many other reformy manifestos – implies that the road to ACCOUNTABILITY and TRANSPARENCY is necessarily (perhaps exclusively) paved through shifting larger numbers of students and teachers and larger shares of public funding over to the management of non-government entities and non-public officials, as well as creating entirely new layers of ‘public decision making’ by referendum/petition (Parent Trigger).  Whatever gripes we may have regarding the efficiency or responsiveness of government operated services, we must think this one through carefully.

Unless detailed accountability requirements are explicitly spelled out in a whole new layer of state and federal laws, the preferred policies laid out in the Students First and by other reformy institutions are more likely to lead to less public accountability and transparency rather than more. For example:

  1. Shifting substantial numbers of students into private schools or privately managed charter schools means that larger shares of students will have limited constitutional and statutory protections.  When students are educated under privately managed schools – including charters – they do not (unless explicitly laid out in state charter laws) have the same constitutional protections with respect to discipline policies and they lack other important statutory protections that apply only to “state actors” (government institutions). Indeed, parents have a choice of whether to forgo these rights for their children. BUT…. advocates of these policies are deceitfully selling charter schooling as ‘public’ (with all the rights, privileges, etc.) to an unknowing public.
  2. Shifting substantial shares of public financing to entities governed by appointed boards of private citizens (not public officials), private management firms and private subcontractors reduces financial transparency because these institutions and individuals may – and most often do when challenged – invoke that they are not subject to open meetings, open records and other disclosure laws that necessarily apply to government entities.

Further, specific policies including parent trigger policies and ‘opportunity scholarship’ tuition tax credits may also substantially erode public accountability.

  1. Parent trigger attempts to subvert traditional elected representative local government by granting disproportionate power to a temporary class of citizens – parents of children attending a school at a given moment in time – to make relatively permanent decisions, by simply majority rule, regarding operations of public assets, public programs and services, including the option to make them no-longer public. But these assets, programs and services belong to and serve directly and indirectly the larger community of eligible voters who put in place their elected school board (or city government officials that appointed a portion or all of that board).
  2. Establishment of privately governed  entities to manage funds collected through a tax credit program [Opportunity Scholarship Vouchers] is comparable to simply handing over an equivalent sum of funds collected as tax dollars to that entity, except that taxpayers lose any/all rights/accountability over the use of those funds! As with private management firms and schools, private entities of this type are not governed directly by public officials and therefore may not be similarly legally accountable. They may not be subject to the same level of public records or meetings disclosure, etc. This mechanism [Tuition Tax Credit] has been used as a means to get around constitutional concerns over allocation of public tax revenues to religious institutions. That is, this mechanism was created specifically to negate taxpayer standing to mount legal challenges over the use of funds. The U.S. Supreme Court has determined that when tax credit programs are structured in this way, taxpayers have no right [no standing] to bring constitutional (or likely any) challenges over the use of these funds. [http://www.supremecourt.gov/opinions/10pdf/09-987.pdf]

So yes – Students First has their policy preferences – and they’re certainly entitled to that. They’ve built their entire rating system on their idea of what’s good policy. They’ve not tried to justify their policy preferences in any research basis on effectiveness or efficiency of these policy preferences, nor could they.  There simply is no research basis to support the vast majority of their preferences. Even where Charter school policy is concerned, findings of successful charters seem to occur most often where authorizers are few and tightly regulated, and where charter market share is low (as in NYC or Boston).  This is in direct contrast with the SF preference for further deregulating and expanding the sector (as in states with relatively poor charter performance).   So, in short, there’s simply no research based reason to follow the policy agenda of Students First.  But the reasons they provide – accountability, transparency, blah… blah… blah… are also not consistent with their policy agenda.

As a school finance researcher in particular, I’ve been increasingly frustrated by the lack of detailed consistent financial reporting on charter schools, and I’ve written much on this topic. I’ve also written on private school financing, which is even more sparsely reported. The more kids who are shifted into charters, the fewer kids on which we have reliable, comprehensive information on finances, teacher contracts, compensation packages etc. (as charters management companies repeatedly invoke that their employee contracts are private, not public documents).  Similarly, financial arrangements involving land deals and capital financing are more opaque than ever – far more opaque and inaccessible than the public financing world of municipal bond financed infrastructure. And I don’t see any legitimate effort to make these institutions more transparent – NONE!


[i] Richard J. Murnane and Randall Olsen (1989) The effects of salaries and opportunity costs on length of state in teaching. Evidence from Michigan. Review of Economics and Statistics 71 (2) 347-352

[ii] David N. Figlio (2002) Can Public Schools Buy Better-Qualified Teachers?” Industrial and Labor Relations Review 55, 686-699. David N. Figlio (1997) Teacher Salaries and Teacher Quality. Economics Letters 55 267-271. Ronald Ferguson (1991) Paying for Public Education: New Evidence on How and Why Money Matters. Harvard Journal on Legislation. 28 (2) 465-498.

[iii] Loeb, S., Page, M. (2000) Examining the Link Between Teacher Wages and Student Outcomes: The Importance of Alternative Labor Market Opportunities and Non-Pecuniary Variation. Review of Economics and Statistics 82 (3) 393-408

[iv] Figlio, D.N., Rueben, K. (2001) Tax Limits and the Qualifications of New Teachers. Journal of Public Economics. April, 49-71

See also:

Downes, T. A. Figlio, D. N. (1999) Do Tax and Expenditure Limits Provide a Free Lunch? Evidence on the Link Between Limits and Public Sector Service Quality52 (1) 113-128

[v] Ondrich, J., Pas, E., Yinger, J. (2008) The Determinants of Teacher Attrition in Upstate New York. Public Finance Review 36 (1) 112-144

Thoughts on “Randomized” vs. Randomized Charter School Studies

There’s much talk in education research about Randomized Control Trials and truly “experimental” research being the “gold standard” for determining whether a specific intervention “works” or not. Thus is the basis for the Institute for Education Sciences What Works Clearing House. It is often argued that randomized, or experimental studies are “good” and decisive, and that other approaches simply don’t match up. Therefore, if someone really wants to know what works or doesn’t with regard to a specific intervention or set of interventions, one need only review those randomized, experimental studies to identify the consensus finding.

There’s so much to discuss on these issues, including the extent to which truly randomized experiments can actually shed light on how interventions might play out in other settings or at scale. But I’ll stick to a much narrower focus in this post, and that is, just how randomized is randomized? Most recently, this question came to mind after reading this post addressing “experimental” vs. “non-experimental” studies of charter schools by Matt Di______Carlo at Shanker blog, and this post over at Jay P. Greene’s blog on RIGOROUS charter research (meaning experimental, or randomized).

There tend to be two types of studies done to determine the relative effectiveness of “charter schools” versus traditional “district schools.” The basic idea of either type of study is to determine the effect that “charter schooling” or some specific set of policies/practices and instructional models and strategies about “charter schooling”, has on students’ outcomes, when compared to kids who don’t receive those strategies. That is, exposure to “charter schooling” is assumed to be a treatment, and non-exposure, whatever that constitutes, is the control.

One type of study tries to identify after the fact, otherwise similar kids (matched pairs) attending a set of charter schools and a set of district schools in the same city, and then compares their achievement growth over time. These studies often fall short in two important ways.

The other type of study is often referred to as meeting the gold standard – as being a randomized study – or lottery-based study. It is assumed, since these studies are declared golden, that they therefore necessarily resolve both above concerns. And it is possible, that if these studies truly were randomized (or even could be) that they could resolve the above concerns. But they don’t (resolve these concerns), because they aren’t (really randomized).

First, what would a randomized study look like? Well, it would have to look something like this – where we randomly take a group of kids – with consent or even against their will – and assign them to either the charter or traditional school option. The mix of kids in each group is truly random and checked to ensure that the two groups are statistically representative (using better than the usual measures) of the population.  Then, we have to make sure that all other “non-treatment” factors are equivalent, including access to facilities, resources, etc. That is, anything that we don’t consider to be a feature of the treatment itself. This is especially important if we want to know whether expanding elements of the treatment are likely to work for a representative population.  This is a randomized, controlled trial.

Slide1

So then, what’s randomized in a randomized charter school study? Or lottery-based study?  One might sketch out a lottery-based study as follows:

Slide2

Here, the study is really only randomized at one point in a long complicated sequence – the lottery itself. Students and families have to decide they want to enter the lottery – that they are interested in attending a charter school, which will ultimately affect the composition of the charter school enrollments. Then, among those selecting into the pool, students are randomly chosen to attend the charters along side others randomly chosen to attend (from a non-random pool of lottery participants), and the others randomly selected, to go, well, somewhere else… with a group of peers non-randomly chosen to end up in that same somewhere else.

So, while the studies compare the achievement of kids randomly chosen to those randomly un-chosen (thus comparing only those who tried to get a charter slot), the kids are shuffled into settings that are anything but randomly assigned, containing potentially vastly different peer groups and a variety of other differences in setting. Add to this the likelihood of non-random student attrition, further altering peer group over time.

As such, I very much prefer these studies to be referred to as “lottery-based” rather than randomized or experimental. These studies are randomized at only one step in this process, potentially conflating setting/peer effects with treatment effects, thus substantially compromising policy implications.

As with those matching studies, the types of variables used to check and/or correct for peer composition and non-randomness of attrition are often too imprecise to be useful.

One fun alternative would be to pull a switch, whereby the charter teachers, their model, instructional strategies etc. would be traded with the district schools’ teachers, model and strategies, as a confirmatory test to see whether the charter model effects are actually transferable (assuming there were effects to begin with).

Slide5

Clearly, I’m asking way too much to assume that charter school, or most other program/intervention research in education be based on real RCTs. That’s not going to happen. And I’m not convinced it would be that useful for informing policy anyway. But, my point in this post is to make it clear that the difference between the types of matched student studies done by CREDO, for example, and the studies being (mis)characterized as “gold standard” randomized studies is far more subtle than many are willing to admit and NEITHER ARE WHAT THEY’RE REALLY CRACKED UP TO BE!

Dumbest “School Finance” Tweet Ever?

Critics say only public systems can focus 100% on the children, but vast majority of K-12 $$ goes to employees not kids bit.ly/SLrNUn

— AEI Education(@AEIeducation) December 18, 2012

Twisted Truths & Dubious Policies: Comments on the NJDOE/Cerf School Funding Report

Yesterday, we were blessed with the release of yet another manifesto (as reported here on NJ Spotlight) from what has become the New Jersey Department of Reformy Propaganda.  To be fair, it has become increasingly clear of late, that this is simply the new model for State Education Agencies (see NYSED Propaganda Here), with the current US Dept of Education often leading the way.

Notably, there’s little change in this report from a) the last one or b) the Commissioner’s state of the schools address last spring.

The core logic of the original report remains intact:

  1. That NJ has a problem – and that problem is  the achievement gap between low income and non-low income kids;
  2. That spending money on these kids doesn’t help – in fact it might just hurt – but it’s certainly a waste;
  3. Therefore, the logical solution to improving the achievement gap is to reduce funding to districts serving low income and non-English speaking kids and shift that funding to others.

Here’s a quick walk-through…

The Crisis?

The new report, like the previous, zeros in on the problem of New Jersey’s achievement gap between low income and non-low income kids. Now, the reason that the recent reports have focused so heavily on the achievement gap is that in the early days of this administration, the rhetoric was focused on the system as a whole being academically bankrupt. The simple response was to point out that NJ schools, by nearly any outcome measure stack up quite favorably against nearly any other state. So, they had to back off that rhetoric, and move to the achievement gap thing. Here’s one of the justifying statements in the current report.

“Likewise, on the 2011 administration of the National Assessment of Educational Progress, New Jersey ranked 50th out of 51 states (including Washington, D.C.) in the size of the achievement gap between high- and low-income students in eighth grade reading.”

Of course, as I’ve pointed out again and again, and will reiterate below, this is an entirely bogus comparison.

The Proposed Solution?

Like the previous funding report from last Winter, the primary recommendations in this new manifesto are to reduce funding adjustments for low income and non-English speaking kids, because we know they don’t need that funding and certainly couldn’t and obviously haven’t used it well. The report did back off from proposing one of the oldest tricks in the book for cutting aid to the poor – funding on average daily attendance – but likely backed off because they simply lack the legal authority to propose this change in this context and not out of any moral/ethical principle.

The Rationale?

The most bizarre section of the new report appears on the bottom of the second page. Here, the report’s author makes several bold, outlandish and unjustified and mostly factually incorrect statements. Further, little or no justification is provided for any of the boldly stated points. It’s nearly as ridiculous as The Cartel.

Here are two of my favorite paragraphs:  

 The conclusion is inescapable: forty years and tens of billions of dollars later, New Jersey’s economically disadvantaged students continue to struggle mightily. There are undoubtedly many reasons for this policy failure, but chief among them is the historically dubious view that all we need to do is design an education funding formula that would “dollarize” a “thorough and efficient system of free public school” and educational achievement for every New Jersey student would, automatically and without more, follow.” (emphasis added)

“Of course, schools must have the resources to succeed. To the great detriment of our students, however, we have twisted these unarguable truths into the wrongheaded notion that dollars alone equal success. How well education funds are spent matters every bit as much, and probably more so, than how much is spent. New Jersey has spent billions of dollars in the former-Abbott districts only to see those districts continue to fail large portions of their students. Until we as a state are willing to look beyond the narrow confines of the existing funding formula – tinkering here, updating there – we risk living Albert Einstein’s now infamous definition of insanity: doing the same thing over and over again and expecting a different result.”

First, I would point out that starting with the line “the conclusion is inescapable” is one of the first red flags that most of what follows will be a load of BS. But that aside… let’s take a look at some of these other statements.  I’m not sure who the Commissioner thinks is advancing the “historically dubious view that all we need…blah…blah… blah… dollarize … blah… blah” but I would point out that the central issue here is that a well organized, appropriately distributed, sufficiently funded state school finance system provides the necessary underlying condition for getting the job done – achieving the desired standards, etc. (besides nothing could ever equal the reformy dubiousness of this graph… or these!) .

This isn’t about arguing that money in and of itself solves all ills. But money is clearly required. It’s a prerequisite condition. More on that below. This claim that others are advancing such an historical dubious view is absurd. Nor is it the basis for the current state school finance system, or the court order that led to the previous (not current) system! [background on current system here]

Equally ridiculous is the phrase about these “unarguable truths.” Again, when I see a phrase like this, my BS detector nearly explodes. Again, I’m not sure who the commissioner thinks is advancing some “wrongheaded notion” that “dollars alone equal success,” but I assure you that while dollars alone don’t equal success, equitable and adequate resources are a necessary underlying condition for success.

Indeed, the current state school finance system is built on attempts to discern the dollars needed to provide the necessary programs and services to meet the state outcome objectives [I’ll set aside the junk comparisons to Common Core costs listed in the report for now]. But the focus isn’t/wasn’t on the dollars, but rather the programs and services – which, yes… ultimately do have to be paid for with… uh… dollars.

Under the prior Abbott litigation and resulting funding distributions, the focus was entirely on the specific programs and services required for improving outcomes of children in low income communities (early childhood education programs, adequate facilities, etc.). In fact, that was one of the persistent concerns among Abbott opponents… that the programs/services must be provided under the court mandate, regardless of their cost (not that the dollars must be provided regardless of their use) and in place of any broader, more predictable systematic formula. So, perhaps the answer is to go back to the Abbott model?

Ultimately, to establish a state school finance formula (which is a formula for distributing aid), you’ve got to “dollarize” this stuff. But that doesn’t by any stretch of the imagination lead to the assumption that the dollars create – directly – regardless of use – the outcomes. That’s just ridiculous. And the report provides no justification behind its attack on this mythical claim.

In fact, these statements convey a profound ignorance of even the recent history of school finance in New Jersey.

The Reality!

Now that I’m done with that, let’s correct the record on a few points.

New Jersey has an “average” achievement gap given its income gap

I’m not sure how many times I’ll have to correct the current NJDOE and its commissioner on their repeated misrepresentation of NAEP achievement gap data. This is getting old and it’s certainly indicative that the current administration is unconcerned with presenting any remotely valid information on the state of New Jersey schools. Given what we’ve seen in previous presentations I guess I shouldn’t be surprised.

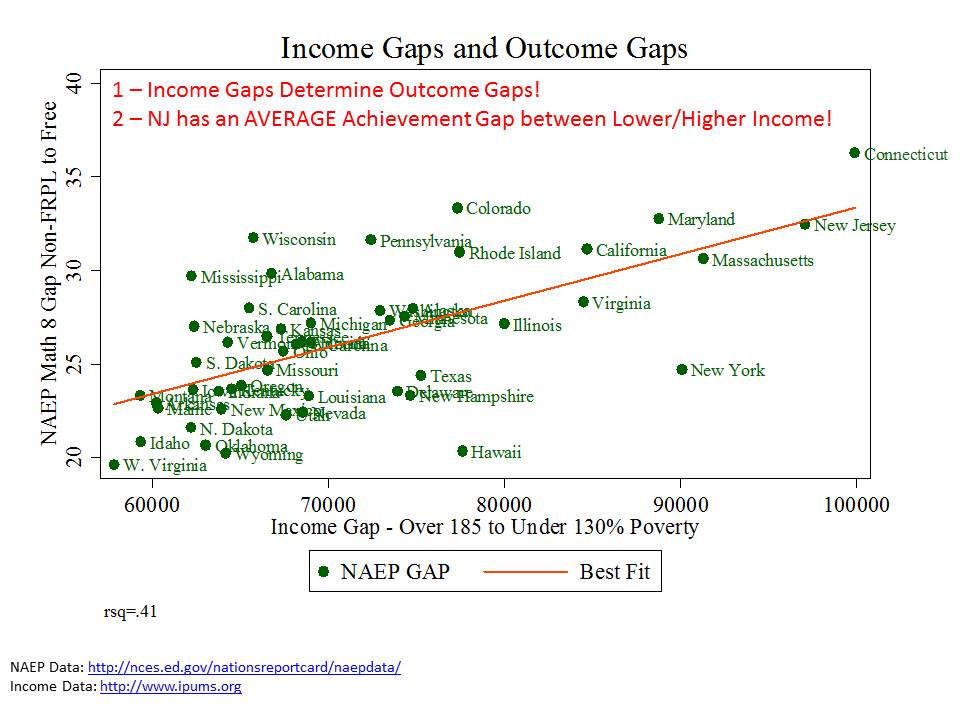
In any case, here’s my most recent run of the data comparing income gaps and NAEP outcome gaps. Across the horizontal axis in this graph is the difference in income between those above the reduced lunch income threshold and those below the free lunch income threshold. New Jersey and Connecticut have among the largest gaps in income between these two groups. Keep in mind that the same income thresholds are used across all states, despite the fact that the cost of comparable quality of life varies quite substantially (nifty calculator here). On the vertical axis are the gaps in NAEP scores between the two groups.

 Figure 1. Income Gaps and Achievement Gaps

Slide1

As we can see, states with larger gaps in income between the groups also have larger gaps in scores between the two groups. Quite honestly, this is not astounding. It’s dumb logic. And that’s why it’s so inexcusable for Cerf & Co. to keep returning to this intellectually & analytically dry well.

Most importantly, NJ’s gap is right on the line. That is, given its income gap, NJ falls right where we would expect- on the line. NJ’s income related achievement gap is right in line with expectations!

Is that good enough? Well, not really. There’s still work to be done. But the bogus claim that NJ has the 2nd largest achievement gap has to stop.

New Jersey has posted impressive NAEP gains given its spending increases

Now let’s take a look at how disadvantaged kids in NJ have actually done on a few of the NAEP tests in recent years when compared to disadvantaged kids in similar states in the region.  The pictures pretty much tell the story.

Figure 2. NAEP 8th grade Math for Children Qualified for Free Lunch

Slide3

Figure 3. NAEP 4th grade Reading for Children Qualified for Free Lunch

Slide4

Figure 4. NAEP 8th Grade Math for Children of Maternal HS Dropouts

Slide5

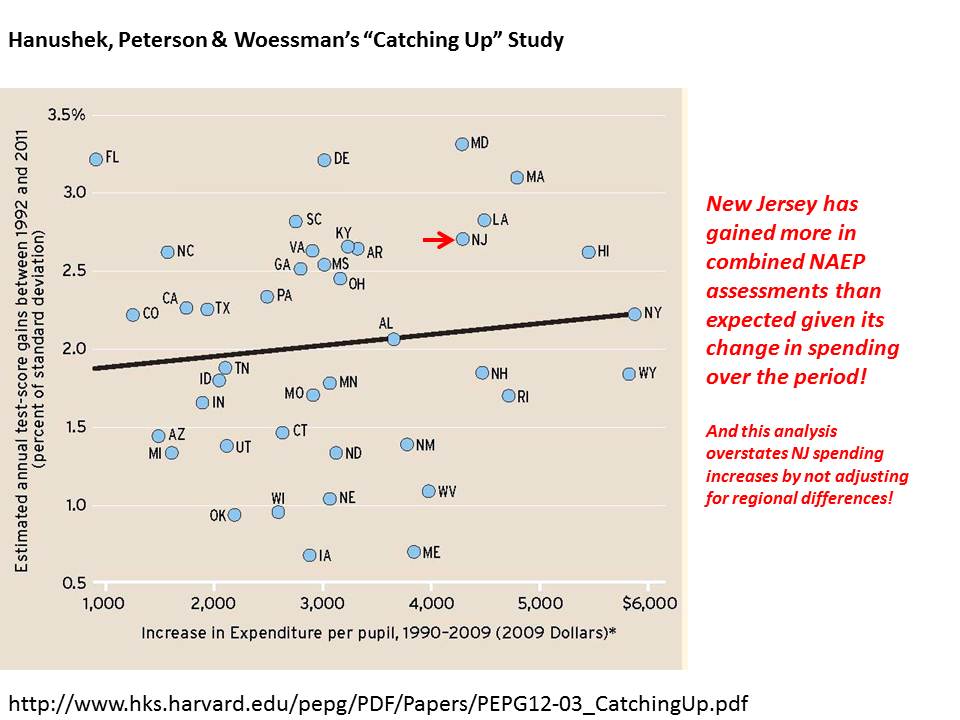
Even Eric Hanushek’s recent data make NJ look pretty darn good in terms of NAEP gains achieved relatively to additional resources provided!

Figure 5. Relationship between Change in Per Pupil Spending and Overall NAEP Gain

Slide6

Figure 6. Relationship between Change in % Spending per Pupil and Overall NAEP Gain

Slide7

Figure 7. Relationship between Starting Point and Gain over Time

Slide8

For more on these last few slides and the data from which they are generated, see this post.

Arguably, given these results, doing the same thing over and over again and expecting the SAME result might be entirely rational!

Money Matters & Equitable and Adequate Funding is a Necessary Underlying Condition for Success

Finally, a substantial body of literature exists to refute the absurd rhetoric and policy preferences of the NJDOE school funding report – most specifically the veiled assertion that reducing funding to low income children is the way to reduce the achievement gap.

In a recent report titled Revisiting the Age Old Question: Does Money Matter in Education? I review the controversy over whether, how and why money matters in education, evaluating the current political rhetoric in light of decades of empirical research.  I ask three questions, and summarize the response to those questions as follows:

Does money matter? Yes. On average, aggregate measures of per pupil spending are positively associated with improved or higher student outcomes. In some studies, the size of this effect is larger than in others and, in some cases, additional funding appears to matter more for some students than others. Clearly, there are other factors that may moderate the influence of funding on student outcomes, such as how that money is spent – in other words, money must be spent wisely to yield benefits. But, on balance, in direct tests of the relationship between financial resources and student outcomes, money matters.

Do schooling resources that cost money matter? Yes. Schooling resources which cost money, including class size reduction or higher teacher salaries, are positively associated with student outcomes. Again, in some cases, those effects are larger than others and there is also variation by student population and other contextual variables. On the whole, however, the things that cost money benefit students, and there is scarce evidence that there are more cost-effective alternatives.

Do state school finance reforms matter? Yes. Sustained improvements to the level and distribution of funding across local public school districts can lead to improvements in the level and distribution of student outcomes. While money alone may not be the answer, more equitable and adequate allocation of financial inputs to schooling provide a necessary underlying condition for improving the equity and adequacy of outcomes. The available evidence suggests that appropriate combinations of more adequate funding with more accountability for its use may be most promising.

While there may in fact be better and more efficient ways to leverage the education dollar toward improved student outcomes, we do know the following:

Many of the ways in which schools currently spend money do improve student outcomes.

When schools have more money, they have greater opportunity to spend productively. When they don’t, they can’t.

Arguments that across-the-board budget cuts will not hurt outcomes are completely unfounded.

In short, money matters, resources that cost money matter and more equitable distribution of school funding can improve outcomes. Policymakers would be well-advised to rely on high-quality research to guide the critical choices they make regarding school finance.

Regarding the politicized rhetoric around money and schools, which has become only more bombastic and less accurate in recent years, I explain the following:

Given the preponderance of evidence that resources do matter and that state school finance reforms can effect changes in student outcomes, it seems somewhat surprising that not only has doubt persisted, but the rhetoric of doubt seems to have escalated. In many cases, there is no longer just doubt, but rather direct assertions that: schools can do more than they are currently doing with less than they presently spend; the suggestion that money is not a necessary underlying condition for school improvement; and, in the most extreme cases, that cuts to funding might actually stimulate improvements that past funding increases have failed to accomplish.

To be blunt, money does matter. Schools and districts with more money clearly have greater ability to provide higher-quality, broader, and deeper educational opportunities to the children they serve. Furthermore, in the absence of money, or in the aftermath of deep cuts to existing funding, schools are unable to do many of the things they need to do in order to maintain quality educational opportunities. Without funding, efficiency tradeoffs and innovations being broadly endorsed are suspect. One cannot tradeoff spending money on class size reductions against increasing teacher salaries to improve teacher quality if funding is not there for either – if class sizes are already large and teacher salaries non-competitive. While these are not the conditions faced by all districts, they are faced by many.

It is certainly reasonable to acknowledge that money, by itself, is not a comprehensive solution for improving school quality. Clearly, money can be spent poorly and have limited influence on school quality. Or, money can be spent well and have substantive positive influence. But money that’s not there can’t do either. The available evidence leaves little doubt: Sufficient financial resources are a necessary underlying condition for providing quality education.

There certainly exists no evidence that equitable and adequate outcomes are more easily attainable where funding is neither equitable nor adequate. There exists no evidence that more adequate outcomes will be attained with less adequate funding. Both of these contentions are unfounded and quite honestly, completely absurd.

Related sources:

Baker, B.D. (2012) Revisiting the Age Old Question: Does Money Matter in Education. Shanker Institute. http://www.shankerinstitute.org/images/doesmoneymatter_final.pdf

Baker, B.D., Welner, K. (2011) School Finance and Courts: Does Reform Matter, and How Can We Tell? Teachers College Record 113 (11) p. –

How Modern School Finance/Education Policy Works: Lessons from New York

I’ll admit that the more I do this stuff, the more I write about today’s education policy environment and especially the environment around school funding, I do get more cynical. And few states have done more to encourage my cynicism than New York, of late. But I suspect that the tales from the trenches in many other states might be quite similar. So let me use New York as a prototype of the twists and turns and warped logic of modern state education policy.  New York education policy has followed a four step process:

Step 1: Slither out from court order by rigging low-ball foundation aid formula

As I noted on another recent post, several years back the New York Court  of Appeals ordered that the state legislature provide sufficient funding (specifically to New York City) to achieve a “sound basic education” which was ultimately equated with a “meaningful high school education.”  The city and governor’s office presented to the court alternative estimates of what that would cost. The state (governor/legislature/regents), as might be expected sought a “less expensive” option. And the court largely took their side. That is, the court ordered that the system be fixed, but largely (uncritically, but for some dissenting minority opinion) accepted the state’s proposal to fix it.

The state achieved their low-ball estimate by pulling a few classic tricks, some of which have been used in other states. First, the state based their minimum funding level on average spending of existing districts meeting the state standards – but had set a relatively low bar for those standards (a bar most were already surpassing anyway). Then they chose to look only at the “instructional” spending share of current spending (lopping off a large chunk of spending that’s actually needed to operate a school).  Rhode Island recently pulled the same garbage, but instead of looking at instructional spending for districts within Rhode Island they used instructional spending in the neighboring states of Massachusetts, Connecticut and New Hampshire (okay… NH doesn’t border RI… does it… but don’t tell their Commissioner… ‘cuz including NH allowed them to bring the average down! See link above).

The final step in their low-ball analysis was to look only at the average spending of the lower half spending districts that meet the state standards – assuming those districts to be the “efficient” ones, better reflecting minimum “costs.” Of course, what this does in New York State is to eliminate from the calculation nearly every district in the Rockland, Westchester, NYC and Long Island regions. So… base level of funding is essentially the average instruction-only spending of the lower half spending districts that have at least somewhat below current average outcomes, and lie somewhere between Syracuse and Buffalo. That makes sense right? That should give us a reasonable ballpark cost for New York City, Mount Vernon or Yonkers, right?

Even for my 2012-13 analyses below, the foundation level per pupil is set to only $6,570, where it is assumed that the average instructional spending per pupil needed in a New York State to achieve state standards.  So then, how does that stack up against alternative cost estimates of what would actually be needed to achieve specific state outcome targets?

I don’t have time to explain the chart below in great detail, but I do provide complete analysis/explanation in this report on New York State school finance.

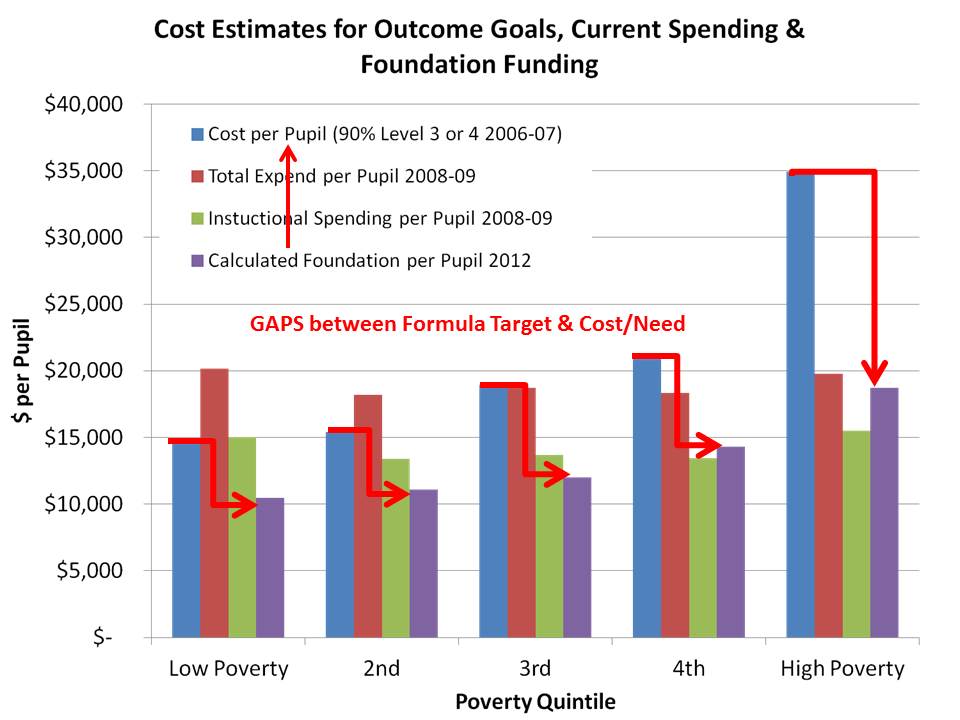
In short, what Figure 1 shows us is in PURPLE, the foundation level, or target funding calculated to be needed by districts in each poverty quintile under the state’s own proposed remedy to their constitutional violation.  The PURPLE is the amount of money a district would have under the foundation aid formula, as a combination of state aid and levying the minimum required local effort.

The blue bars come from a cost model produced a few years back by William Duncombe of Syracuse University in which he used that model to estimate the average spending actually required to achieve a 90% proficiency rate on state assessments (where the average had drifted over time, making the 80% standard relatively meaningless – again, see report).  The red arrows show the gap between estimated costs of reasonable outcome goals and guaranteed funding under the foundation formula.

Figure 1:

Slide1

The point here is simply to show a) how much the state low-balled the target funding using their approach vs. a more rigorous approach, and b) how those funding gaps increase quite dramatically for higher poverty districts. In fact, the target funding level is not that far off for low poverty districts, but it’s only slightly better than half of the cost of comparable outcomes for high poverty districts.

Step 2: Conjure annual excuses for why the state can’t afford to fund even its own low-balled targets for local districts

Given figure 1 above, it might be bad enough if the state did follow through and fund its formula. The formula itself was/is grossly insufficient, determined by bogus calculations and filtrations (exclusions) of data all toward the end goal of generating the lowest possible politically palatable estimate of the cost of providing a sound basic education in New York.

But no… no… low-balling the cost wasn’t nearly far enough for the NY legislature and Gov(ernors) to go. The next step was to say – We can’t afford it (they were saying this even before the economy tanked, and they set out a multiyear phase in)!  We can’t afford our own low-ball estimate (while decrying that the estimate was somehow actually overly generous?).

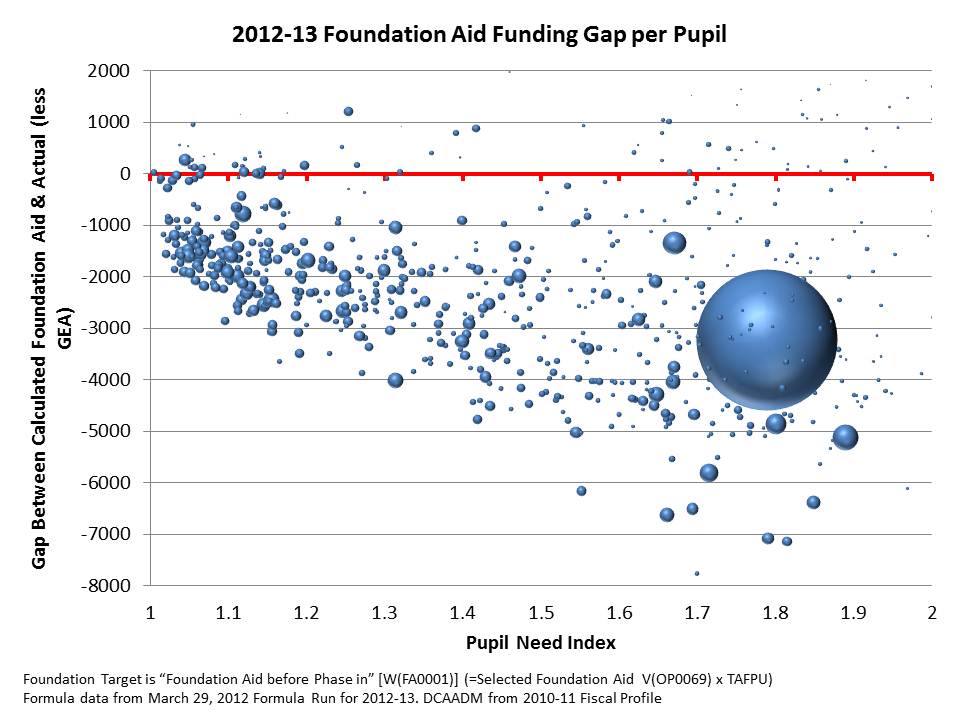
Did they cut back just a little from their target? Oh… say… give districts about 90% or 80% (uh… that would actually be a lot of cut) of what the formula said they needed? Nope. They went much deeper than that. In fact, as I showed in one recent post, as student population needs escalate (according to the state’s own Pupil Need Index) under-funding with respect to foundation targets grows in some cases to over $4,000 per pupil and in New York City to over $3,000 per pupil.

Figure 2.

Slide1

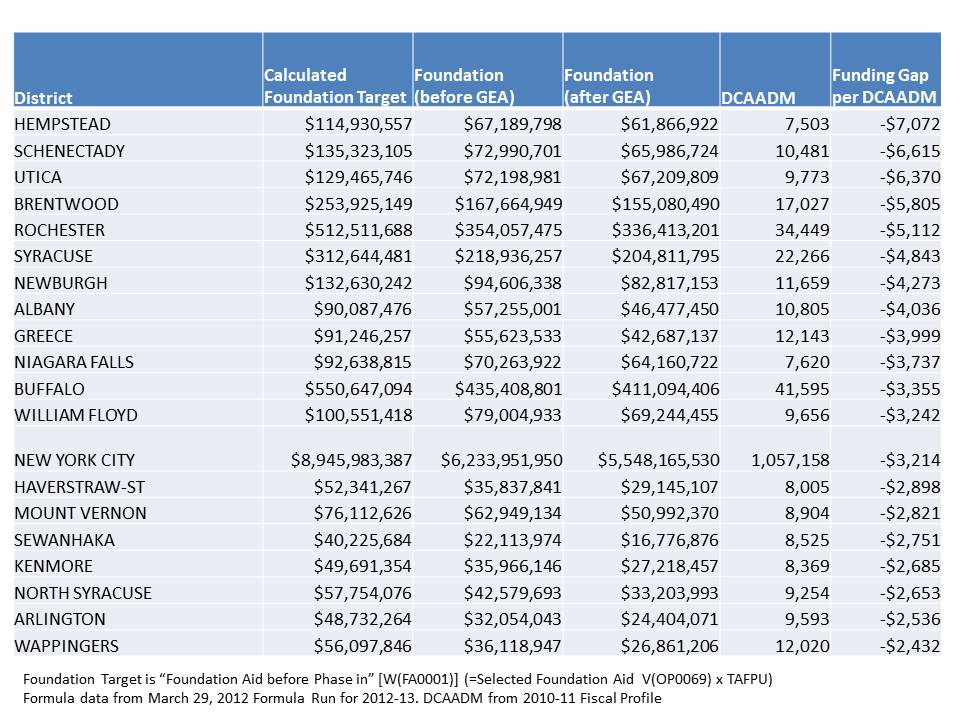
As I showed in that same post, among the most screwed large districts in the state, several receive from the state in general foundation aid only about half (or less) of what they should receive under the STATE’S OWN LOW-BALL FORMULA!

Figure 3.

Slide2

Let’s be clear here. I’m not talking about shortfalls from the relatively high cost targets in that first graph. I’m talking about state aid shortfalls relative to the STATE’S OWN LOW-BALL Foundation Aid model – the model represented by the purple bars in the first graph.  Note also that the state in proposing this foundation model that they’ve subsequently underfunded, essentially declared that low-ball model to be the empirical manifestation of their own state constitutional obligation. It’s their own freakin’ definition of their constitutional obligation…. And they’ve chosen to ignore it.

Step 3: Pretend that it’s all the teachers’ fault and use that as a basis for holding hostage additional funding that should have gone to high need districts years ago!

Oh… but it doesn’t end there!

Riding the national, Duncanian wave of new normalcy (which I’ve come to learn is an extreme form of innumeracy) & reformyness, the only possible cause of lagging achievement in New York State  is bad teachers –greedy overpaid teachers with fat pensions – and protectionist unions who won’t let us fire them. Clearly, the lagging state of performance in low income and minority districts in New York State has absolutely nothing at all to do with lack of financial resources under the low-balled aid formula that the state has chosen to not even half fund for the past 5 years? Nah… that couldn’t have anything to do with it. Besides, money certainly has nothing to do with providing decent working conditions and pay which might leveraged to recruit and retain teachers.

And we all know that if New York State’s average per pupil spending is high, or so the Gov proclaims, then spending clearly must be high enough in each and every-one of the state’s high need districts! (right… because averages always represent what everyone has and needs, right? Reformy innumeracy rears its ugly head again!).

So it absolutely has to be the fact that no teacher in NY has ever been evaluated at all, or fired for being bad even though we know for sure that at least half of them stink. The obvious solution is that they must be evaluated by egregiously flawed metrics – and we must ram those metrics down their throats.

In fact, the New York legislature and Governor even found it appropriate to hold hostage additional state aid if districts don’t adopt teacher evaluation plans compliant with the state’s own warped demands and ill-conceived policy framework.

As I understand it, legislation passed this past year actually tied receipt of state general aid to compliance with the state teacher evaluation mandate. That, in order to receive any increase in state general/foundation aid over prior year, a districts would have to file and have accepted their teacher evaluation plan.

That’s it – we’ll take away their general state aid – their foundation aid – the aid they are supposed to be getting in order to comply with that court order of several years back. The aid they are constitutionally guaranteed under that order. I’m having some trouble accepting the supposed constitutional authority of a state legislature and governor to cut back general aid on this basis – where they’ve already failed to provide most of the aid they themselves identified as constitutionally adequate under court order? But I guess that’s for the New York Court system to decide.

If nothing else, it is thoroughly obnoxious, arbitrary and capricious and grossly inequitable treatment. I hear the reformers (who understand neither math nor school finance) whine… But why… why is it inequitable to require similarly that poor and rich districts follow state teacher and principal evaluation guidelines. Setting aside the junk nature of that evaluation system and the bogus measures on which it rests (and the fact that the reformers’ fav-fab-charters have largely rightfully ignored the eval mandate), it is inequitable because districts serving higher poverty children stand to lose more money per child as a result of non-compliance. And they’ve already been squeezed.

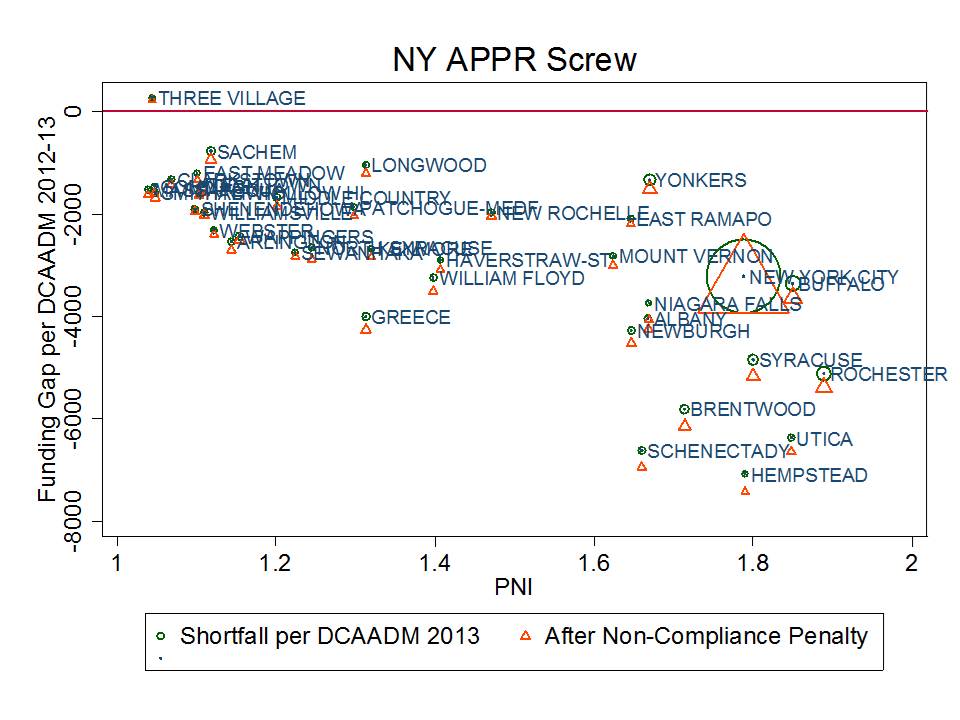
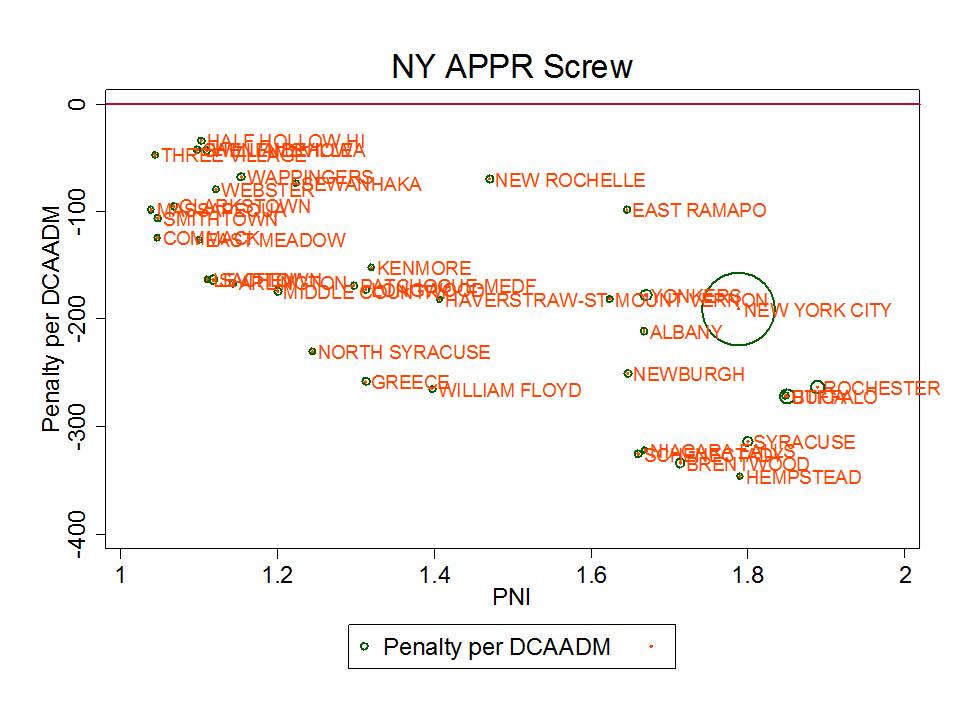
And here’s how that plays out. As I understand it, if districts don’t comply by January, they face the threat of losing the small increase in state aid they received for the current year (compared to 11-12). So, they’d lose it retro-actively, part way through this year. And guess what? Because higher need districts received a marginally greater increase in state aid, they’d lose more per pupil. But the gaps shown above actually already include that oh-so-generous increase! That’s right, the poorer you are, the bigger the financial penalty for non-compliance with the teacher evaluation mandate – and the bigger the financial hole the state has put you in to begin with!

Figure 4. State aid Per Pupil Before and After Non-Compliance Penalty by Student Need

Slide4

Figure 5. Compliance Penalty by Student Need

Slide5This recent article explains that Hempstead, already underfunded by the largest per pupil amount of any large district in the state, stands to lose another $3.5 million in aid if it does not come to agreement on a teacher evaluation plan. State general aid is for the general provision of education to these kids – to pay for enough teachers, classrooms etc. It’s about the day to day operations of schools to ensure the provision of a sound basic education.  This funding shouldn’t be held hostage over reformy whims.

Note that for many districts I have likely understated the amount of aid they would lose because I have counted only changes to general, foundation aid, including “gap elimination adjustment” and partial restoration of those funds. (it would appear, for example, that the potential losses to Hempstead reported in the news are closer to that districts total aid change, not just foundation/GEA change).

Step 4: Protect billions in state aid still being allocated to districts with far fewer additional student needs/costs

And let us not forget that New York State was one of the shining stars – a poster child – of my report with Sean Corcoran for the Center for American Progress where we chronicled how states actually use their aid systems to make equity worse, not better.  While the NY Gov and Legislature have continued to shed elephant tears (in purely political terms) about their fiscal dire straits, the state persists in protecting billions in state direct aid and indirect tax relief subsidies that largely support the states lower  and lowest need local public school districts.

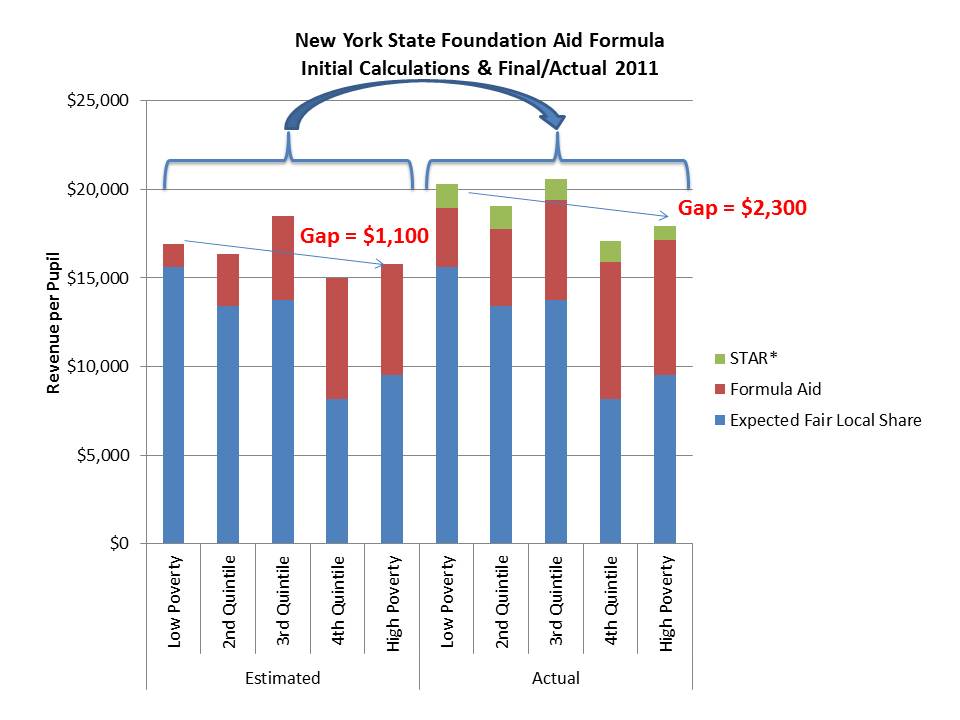
Figure 6 shows that if we look at state general aid, based on initial calculations to local districts by poverty (left hand panel), even after allocating state general aid, there remains an $1,100 per pupil gap in state and local revenue between high and lower poverty districts. But, after the state “tweaks” the  state general aid distribution to provide minimum aid to the wealthiest districts and increase aid to middle/upper middle class districts, and then adds on “tax relief” subsidies, the gap between higher and lower poverty districts increases to $2,300 per pupil. Yep – NY state is actually using billions in state funding to make the system less equitable!  Read the report below for more thorough explanation/analysis!

Figure 6. School Finance Pork in New York!

Slide6

Baker, B.D., Corcoran, S.P.(2012) The Stealth Inequalities of School Funding: How Local Tax Systems and State Aid Formulas Undermine Equality. Washington, DC. Center for American Progress. http://www.americanprogress.org/wp-content/uploads/2012/09/StealthInequities.pdf

And that is how modern state education policy works!

It’s good to be King: More Misguided Rhetoric on the NY State Eval System

Very little time to write today, but I must comment on this NY Post article on the bias I’ve been discussing in the NY State teacher/principal growth percentile ratings. Sociologist Aaron Pallas of TC and economist Sean Corcoran of NYU express appropriate concerns about the degrees of bias found and reported in the technical report provided by the state’s own consultant developing the models. And this article overall raises concern that these problems were simply blown off. I would/and have put it more bluntly. Here’s my replay of events – quoting the parties involved:

First, the state’s consultants designing their teacher and principal effectiveness measures find that those measures are substantively biased:

Despite the model conditioning on prior year test scores, schools and teachers with students who had higher prior year test scores, on average, had higher MGPs. Teachers of classes with higher percentages of economically disadvantaged students had lower MGPs. (p. 1) https://schoolfinance101.com/wp-content/uploads/2012/11/growth-model-11-12-air-technical-report.pdf

But instead of questioning their own measures, they decide to give them their blessing and pass them along to the state as being “fair and accurate.”

The model selected to estimate growth scores for New York State provides a fair and accurate method for estimating individual teacher and principal effectiveness based on specific regulatory requirements for a “growth model” in the 2011-2012 school year. p. 40 https://schoolfinance101.com/wp-content/uploads/2012/11/growth-model-11-12-air-technical-report.pdf

The next step was for the Chancellor to take this misinformation and polish it up as pure spin as part of the power play against the teachers in New York City (who’ve already had the opportunity to scrutinize what is arguably a better but still substantially flawed set of metrics). The Chancellor proclaimed:

The student-growth scores provided by the state for teacher evaluations are adjusted for factors such as students who are English Language Learners, students with disabilities and students living in poverty. When used right, growth data from student assessments provide an objective measurement of student achievement and, by extension, teacher performance. http://www.nypost.com/p/news/opinion/opedcolumnists/for_nyc_students_move_on_evaluations_EZVY4h9ddpxQSGz3oBWf0M

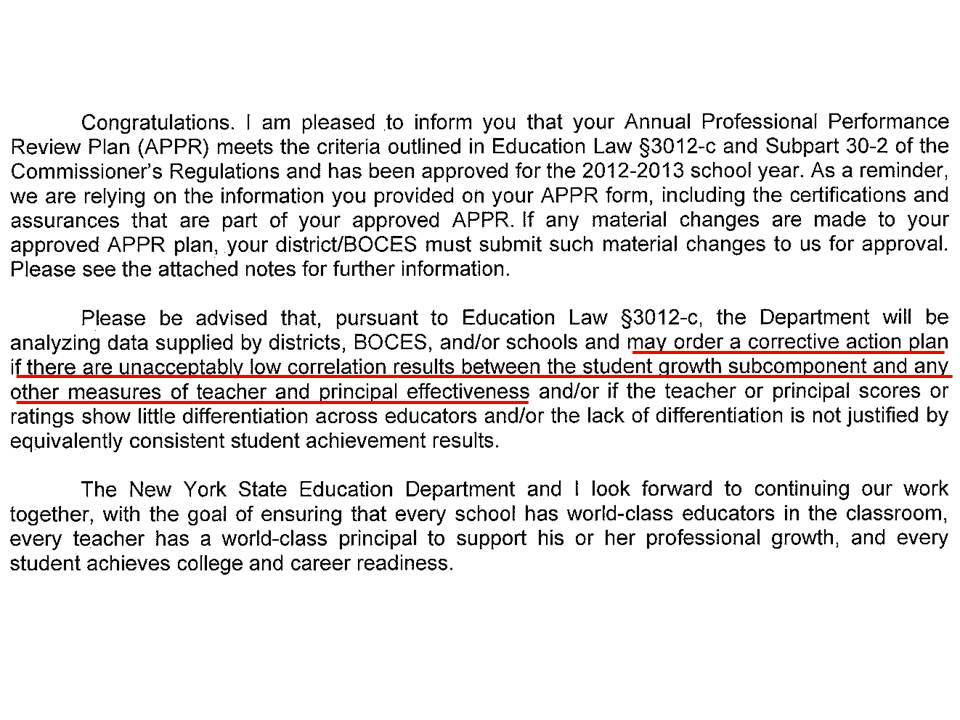
Then send in the enforcers…. This statement came from a letter sent to a district that did decide to play ball with the state on the teacher evaluation regulations. The state responded that… sure… you can adopt the system of multiple measures you propose – BUT ONLY AS LONG AS ALL OF THOSE OTHER MEASURES ARE SUFFICIENTLY CORRELATED WITH OUR BIASED MEASURES… AND ONLY AS LONG AS AT LEAST SOMEONE GETS A BAD RATING.

The department will be analyzing data supplied by districts, BOCES and/or schools and may order a corrective action plan if there are unacceptably low correlation results between the student growth subcomponent and any other measure of teacher and principal effectiveness… https://schoolfinance101.wordpress.com/2012/12/05/its-time-to-just-say-no-more-thoughts-on-the-ny-state-tchr-eval-system/

So… what’s my gripe today? Well, in this particular NY Post article we have some rather astounding quotes from NY State Commissioner John King, given the information above. Now, last I talked about John King, he was strutting about NY with this handy new graph of completely fabricated information on how to improve educational productivity. So, what’s King up to now? Here’s how John King explained the potential bias in the measures and how that bias a) is possibly not bias at all, and b) even if it is, it’s not that big a problem:

“It’s a question of, is this telling you something descriptive about where talent is placed? Or is it telling you something about the classroom effect [or] school effect of concentrations of students?” said King.

“This data alone can’t really answer that question, which is one of the reasons to have multiple measures — so that you have other information to inform your decision-making,” he added. “No one would say we should evaluate educators on growth scores alone. It’s a part of the picture, but it’s not the whole picture.”

So, in King’s view, the bias identified in the AIR technical report might just be a signal as to where the good teachers really are. Kids in schools with lower poverty – kids in schools with higher average starting scores and kids in schools with fewer children with disabilities simply have the better teachers. While there certainly may be some patterned sorting of teachers by their actual effect on test scores a) this proposition is less likely than the expectation of classroom effect and b) making this assumption when not really being able to tease out cause is a highly suspect approach to teacher evaluation (reformy thinking at its finest!).

The kicker is in how King explains why the potential bias isn’t a problem. King argues that the multiple measures approach buffers against over-reliance on the growth percentiles.  As he states so boldly – “it’s part of the picture, but it’s not the whole picture.”

The absurdity here is that KING HAS DECLARED TO LOCAL OFFICIALS THAT ALL OTHER MEASURES THEY CHOOSE TO INCLUDE MUST BE SUFFICIENTLY CORRELATED WITH THESE GROWTH PERCENTILE MEASURES!  That’s precisely what the letter quoted above and sent to one local official says! Even this wasn’t the case, the growth percentiles which may wrongly classify teachers for factors outside their control, might carry disproportionate weight in determining teacher ratings (merely as a function of the extent of variation – most of which is noise & much of the remainder is biased).  But, when you require that all other measures be correlated with this suspect measure – you’ve stacked the deck to be substantially if not entirely built on a flawed foundation.

THIS HAS TO STOP. STATE OFFICIALS MUST BE CALLED OUT ON THIS RIDICULOUS CONTORTED/DECEPTIVE & OUTRIGHT DISHONEST RHETORIC!


Note: King also tries to play up the fact that at any level of poverty, there are some teachers  getting higher or lower ratings. This explanation ignores the fact that much of the remaining variation in teacher estimates is noise.  Some will get higher or lower ratings in a given year simply because of the noise/instability in the measures. These variations may be entirely meaningless.

Forget the $300m Deal! Let’s talk $3.4 billion (or more)!

Sometime last week or so, Sockpuppets for Ed Reform marched on City Hall in NY demanding that the city and teachers union come to a deal on a teacher evaluation system compliant with the state’s new regulations for such systems, so that the district could receive an approximately $300 million grant payment associated with the implementation of that system. Well, actually, it was more about trying to enrage the public that the evil teachers union in particular was at fault for holding hostage and potentially losing this supposedly massive sum of funding.

As one can see by the signs the SFER protesters were displaying, the protest was much less clearly articulated than I’ve described above. On would think, from looking at stuff like this: http://nyulocal.com/wp-content/uploads/2012/11/DSC_0841.jpg that this protest was actually about obtaining funding for the district – funding that would provide for substantive and sustained improvement to district programs/services.

But hey, far be it for SFER to actually carry placards that are in any way accurate or precise (or to have any clue what they are talking about). At this particular event in NYC, they even convinced a 15 year old that the fight was really about funding.

So, we’ve got a protest that is presented as being about funding, but is really about a teacher evaluation system driven by student test scores, being carried out by a group that clearly has little or no understanding of either.

You know, I would typically give a group of undergrads a break on stuff like this.  Hey, they’re undergrads and have time to learn/develop the discipline/understanding of these complex topics. Heck, I was anything but a disciplined undergrad myself.  But unfortunately, this group has thus far displayed to me the worst attributes of the most intellectually lazy of today’s college students – a persistent pattern of copying and pasting low quality content from web sites and presenting it as novel content of their own. It’s as if their placards, and their entire website was generated by lifting content from “reformy-pedia.”

So then, what is the real story on what’s goin’ on with Teacher Evaluation and School Funding in New York State?

The State Evaluation System/Guidelines

I’ve written several posts recently about the state metrics for teacher evaluation and the state department of education push to get districts on board. I also wrote about the letter from the Chancellor of the Board of Regents which appeared in the NY Post, encouraging NYC in particular to get on board with that $300m RAW deal!

In my humble opinion, no-one should sign on to a deal to implement a teacher evaluation system under the current NYSED guidelines, given the evidence I’ve laid out over the past few weeks. No-one. Just say NO.

First, the state’s consultants designing their teacher and principal effectiveness measures find that those measures are substantively biased:

Despite the model conditioning on prior year test scores, schools and teachers with students who had higher prior year test scores, on average, had higher MGPs. Teachers of classes with higher percentages of economically disadvantaged students had lower MGPs. (p. 1) https://schoolfinance101.com/wp-content/uploads/2012/11/growth-model-11-12-air-technical-report.pdf

But instead of questioning their own measures, they decide to give them their blessing and pass them along to the state as being “fair and accurate.”

The model selected to estimate growth scores for New York State provides a fair and accurate method for estimating individual teacher and principal effectiveness based on specific regulatory requirements for a “growth model” in the 2011-2012 school year. p. 40 https://schoolfinance101.com/wp-content/uploads/2012/11/growth-model-11-12-air-technical-report.pdf

The next step was for the Chancellor to take this misinformation and polish it up as pure spin as part of the power play against the teachers in New York City (who’ve already had the opportunity to scrutinize what is arguably a better but still substantially flawed set of metrics). The Chancellor proclaimed:

The student-growth scores provided by the state for teacher evaluations are adjusted for factors such as students who are English Language Learners, students with disabilities and students living in poverty. When used right, growth data from student assessments provide an objective measurement of student achievement and, by extension, teacher performance. http://www.nypost.com/p/news/opinion/opedcolumnists/for_nyc_students_move_on_evaluations_EZVY4h9ddpxQSGz3oBWf0M

Then send in the enforcers…. This statement came from a letter sent to a district that did decide to play ball with the state on the teacher evaluation regulations. The state responded that… sure… you can adopt the system of multiple measures you propose – BUT ONLY AS LONG AS ALL OF THOSE OTHER MEASURES ARE SUFFICIENTLY CORRELATED WITH OUR BIASED MEASURES… AND ONLY AS LONG AS AT LEAST SOMEONE GETS A BAD RATING.

The department will be analyzing data supplied by districts, BOCES and/or schools and may order a corrective action plan if there are unacceptably low correlation results between the student growth subcomponent and any other measure of teacher and principal effectiveness… https://schoolfinance101.wordpress.com/2012/12/05/its-time-to-just-say-no-more-thoughts-on-the-ny-state-tchr-eval-system/

This is a raw deal, whether attached to what appears to be a pretty big bribe or not. And quite honestly, while $300 million is nothing to sneeze at, it pales in comparison to what the city schools are actually owed under the state’s own proposal for how it would fund its schools to comply with a court order of nearly a decade ago.

THE REAL ISSUE in NY State

Meanwhile, at the other end of the state – well sort of – a different protest was going on. This protest in Albany actually was about funding and the fact that the state of New York has repeatedly cut state aid from local public school districts each of the past few years, has systematically cut more per pupil funding from districts serving needier student populations and has never once come close to providing the funding levels that the state’s own funding formula suggest are needed (actually, were needed back in 2007!).

Here’s a quick run-down on the state of school funding in New York:

  1. New York continues to maintain one of the least equitable school finance systems in the country, where districts serving higher concentrations of children in poverty have systematically less state and local revenue per pupil.
  2. New York State accomplishes these patterns of egregious disparity not merely by lack of effort, but by actually allocating substantial state resources – disproportionate state resources – toward buying down the tax rates of the state’s wealthiest districts and making other politically convenient state aid allocations to economically advantaged districts, at the expense of children in poverty.
  3. Even though the state was ordered by the NY court of appeals nearly a decade ago to provide adequate resources to children attending high need districts, and even though the court accepted the state’s own proposed funding formula to meet that goal (which was much lower than more rigorously determined spending targets), the state has chosen to not even come close to funding those targets and in recent years has systematically cut more funding from children with greater needs.

So, how does this all affect districts across New York State and NYC in particular? I’m going to set a really low bar here for my comparisons. In response to court order in the Campaign for Fiscal Equity case the state of New York proposed a new school finance formula – a foundation aid formula – to begin implementation in 2007. It was actually a pretty lame, relatively low-balled funding formula to begin with, as explained here!

But even that low-balled estimate of what districts were supposed to get has never been close to fully funded. Several large districts, including Albany, for example, receive in 2012-13, less than half of the state aid they are supposed to receive if the formula was implemented.

The formula provides a target level of funding for each district based on student needs and regional costs. Then, the formula determines the share of that target funding that should come from the state. Then, the formula as actually implemented, ignores all of that and provides a marginal increase or decrease (over what districts have historically received) maintaining the persistent inequities of the system.

The first figure below shows the difference between actual state foundation aid per pupil (after applying this trick they refer to as gap elimination adjustment) and the aid calculated to be needed according to THE STATE’S OWN FORMULA for addressing regional costs and student needs. Districts are organized from low need (left) to high need (right) using the state’s own pupil need index. Bubble size indicates district enrollment size. NYC is the BIG ONE! And, we can see, by eyeballing the middle of that bubble, that NYC is being shorted between $3,000 and $4,000 per pupil. At 1 million kids, that’s about $3.4 billion … each year… every year… over time.  No, not a $300m implementation grant, but $3.4 billion in annual operating funds. Yeah… the stuff that actually provides for smaller class sizes, decent teacher pay, up to date materials, supplies and equipment, and arts, music and all that other stuff!

Slide1

The table below provides a closer look at districts with the largest funding gap between what the formula calculates is needed and what districts actually receive in state aid.

Slide2

So, instead of talking about a one shot $300m bribe to implement a bad system based on bad data, at a cost that may exceed the amount of grant to begin with, perhaps it would make more sense to focus on that $3.4 billion deal! You know, the one state officials themselves promised in response to that court order all those years ago.

And when we do start taking more seriously this much bigger funding issue, don’t forget to send me a cool lookin’ knit protest hat!

Readings

Policy Brief on State Aid in New York (Summer 2011) NY Aid Policy Brief_Fall2011_DRAFT6

Baker, B.D., Welner, K.G. (2012) Evidence and Rigor: Scrutinizing the Rhetorical Embrace of
Evidence-based Decision-making. Educational Researcher 41 (3) 98-101

Baker, B.D., Welner, K. (2011) School Finance and Courts: Does Reform Matter, and How Can We
Tell? Teachers College Record 113 (11) p. –

Baker, B.D., Corcoran, S.P.(2012) The Stealth Inequalities of School Funding: How Local Tax
Systems and State Aid Formulas Undermine Equality. Washington, DC. Center for American
Progress. http://www.americanprogress.org/wp-content/uploads/2012/09/StealthInequities.pdf

Baker, B.D., Sciarra, D., Farrie, D. (2012) Is School Funding Fair? Second Edition, June 2012.
http://schoolfundingfairness.org/National_Report_Card_2012.pdf

Baker, B.D. (2012) Revisiting the Age Old Question: Does Money Matter in Education. Shanker
Institute. http://www.shankerinstitute.org/images/doesmoneymatter_final.pdf

Baker, B.D., Welner, K.G. (2011) Productivity Research, the U.S. Department of Education, and
High-Quality Evidence. Boulder, CO: National Education Policy Center. Retrieved [date] from
http://nepc.colorado.edu/publication/productivity-research.

Friday Thoughts on Data, Assessment & Informed Decision Making in Schools

Some who read this blog might assume that I am totally opposed, in any/all circumstances to using data in schools to guide decision-making. Despite my frequent public cynicism I assure you that I believe that much of the statistical information we collect on and in schools and school systems can provide useful signals regarding what’s working and what’s not, and may provide more ambiguous signals warranting further exploration – through both qualitative information gathering (observation, etc.) and additional quantitative information gathering.

My personal gripe is that thus far – especially in public policy – we’ve gone about it all wrong.  Pundits and politicians seem to have this intense desire to impose certainty where there is little or none and impose rigid frameworks with precise goals which are destined to fail (or make someone other than the politician look as if they’ve failed).

Pundits and politicians also feel the intense desire to over-sample the crap out of our schooling system – taking annual measurements on every child over multiple weeks of the school year when strategic sampling of selected testing items across samples of students and settings might provide more useful information at lower cost and be substantially less invasive (NAEP provides one useful example). To protect the health of our schoolchildren, we don’t make them all walk around all day with rectal thermometers hanging out of…well… you know?  Nor do political pollsters attempt to poll 100% of likely voters.  Nor should we feel the necessity to have all students take all of the assessments, all of the time, if our goal is to ensure that the system is getting the job done/making progress.

In my view, a central reason for testing and measurement in schools is what I would refer to as system monitoring,  where system monitoring is best conducted in the least intrusive and most cost-effective way – such that the monitoring itself does not become a major activity of the system!  We just need enough sampling density in our assessments to generate sufficient estimates at each relevant level of the system.

I know there are those who would respond that testing everyone every year ensures that no kids fall through the cracks. If we did it my less intrusive way… kids who weren’t given all test questions in math in a given year might fall through some hypothetical math crack somewhere. But it is foolish to assume that NCLB-every-student-every-year testing regimes actually solve that problem. Further, high stakes testing with specific cut scores either for graduation or grade promotion violates one of the most basic tenets of statistical measurement of student achievement – that these measures are not perfectly precise. They can’t identify exactly  where that crack is, or which kid actually fell through it! One can’t select a cut score and declare that the child one point above that score (who got one more question correct on that given day) is ready (with certainty) for the next grade (or to graduate) and the child 1 point below is not. In all likelihood these two children are not different at all in their actual “proficiency” in the subject in question. We might be able to say – by thoughtful and rigorous analysis – that on average, students who got around this score in one year, were likely to get a certain score in a later year, and perhaps even more likely to make it beyond remedial course work in college. And we might be able to determine if students attending a particular school or participating in a particular program are more or less likely (yeah… probability again) to succeed in college.

Thoughtful analysis and more importantly thoughtful USE of testing data in schools requires a healthy respect for what those numbers can and cannot tell us… and nuanced understanding that the numbers typically include a mix of non-information (noise/unexplainable, non-patterned information), good information (true signal) and perhaps misinformation (false signal, or bias, variation caused by something other than what we think it’s caused by).

These issues apply generally to our use of student assessment data in schools and also apply specifically to an area I discuss often on this blog – statistical evaluation of teacher influence on tested student outcomes.

I was pleased to see the Shankerblog column by Doug Harris a short while back in which Doug presented a more thoughtful approach to integrating value-added estimates into human resource management in the schooling context. Note that Doug’s argument is not new at all, nor is it really his own unique view. I first heard this argument in a presentation by Steve Glazerman (of Mathematica) at Princeton a few years ago. Steve also used the noisy medical screening comparison to explain the use of known-to-be-noisy information to assist in making more efficient decisions/taking more efficient steps in diagnosis. That is, with appropriate respect for the non-information in the data, we might actually find ways to use that information productively.

Last spring, I submitted an article (still under review) in which I, along with my coauthors Preston Green and Joseph Oluwole explained:

As we have explained herein, value-added measures have severe limitations when attempting even to answer the narrow question of the extent to which a given teacher influences tested student outcomes. Those limitations are sufficiently severe such that it would be foolish to impose on these measures, rigid, overly precise high stakes decision frameworks.  One simply cannot parse point estimates to place teachers into one category versus another and one cannot necessarily assume that any one individual teacher’s estimate is necessarily valid (non-biased).  Further, we have explained how student growth percentile measures being adopted by states for use in teacher evaluation are, on their face, invalid for this particular purpose.  Overly prescriptive, overly rigid teacher evaluation mandates, in our view, are likely to open the floodgates to new litigation over teacher due process rights, despite much of the policy impetus behind these new systems supposedly being reduction of legal hassles involved in terminating ineffective teachers.

This is not to suggest that any and all forms of student assessment data should be considered moot in thoughtful management decision making by school leaders and leadership teams. Rather, that incorrect, inappropriate use of this information is simply wrong – ethically and legally (a lower standard) wrong. We accept the proposition that assessments of student knowledge and skills can provide useful insights both regarding what students know and potentially regarding what they have learned while attending a particular school or class. We are increasingly skeptical regarding the ability of value-added statistical models to parse any specific teacher’s effect on those outcomes. Further, the relative weight in management decision-making placed on any one measure depends on the quality of that measure and likely fluctuates over time and across settings. That is, in some cases, with some teachers and in some years, assessment data may provide leaders and/or peers with more useful insights.  In other cases, it may be quite obvious to informed professionals that the signal provided by the data is simply wrong – not a valid representation of the teacher’s effectiveness.

Arguably, a more reasonable and efficient use of these quantifiable metrics in human resource management might be to use them as a knowingly noisy pre-screening tool to identify where problems might exist across hundreds of classrooms in a large district. Value-added estimates might serve as a first step toward planning which classrooms to observe more frequently. Under such a model, when observations are completed, one might decide that the initial signal provided by the value-added estimate was simply wrong. One might also find that it produced useful insights regarding a teacher’s (or group of teachers’) effectiveness at helping students develop certain tested algebra skills.

School leaders or leadership teams should clearly have the authority to make the case that a teacher is ineffective and that the teacher even if tenured should be dismissed on that basis. It may also be the case that the evidence would actually include data on student outcomes – growth, etc. The key, in our view, is that the leaders making the decision – indicated by their presentation of the evidence – would show that they have used information reasonably to make an informed management decision. Their reasonable interpretation of relevant information would constitute due process, as would their attempts to guide the teacher’s improvement on measures over which the teacher actually had control.

By contrast, due process is violated where administrators/decision makers place blind faith in the quantitative measures, assuming them to be causal and valid (attributable to the teacher) and applying arbitrary and capricious cutoff-points to those measures (performance categories leading to dismissal).   The problem, as we see it, is that some of these new state statutes require these due process violations, even where the informed, thoughtful professional understands full well that she is being forced to make a wrong decision. They require the use of arbitrary and capricious cutoff-scores. They require that decision makers take action based on these measures even against their own informed professional judgment.

My point is that we can have thoughtful, data informed (NOT DATA DRIVEN) management in schools. We can and should! Further, we can likely have thoughtful data informed management (system monitoring) through far less intrusive methods than currently employed – taking advantage of advancements in testing and measurement, sampling design etc. But we can only take these steps if we recognize the limits of data and measurement in our education systems.

Unfortunately, as I see it, current policy efforts enforcing the misuse of assessment data (as illustrated here, here and here) and misuse of estimates of teacher effectiveness based on those data (as illustrated here) will likely do far more harm than good.  Unfortunately, I don’t see things turning corner any time soon.

Until then, I may just have to stick to my current message of Just say NO!

It’s time to just say NO! More thoughts on the NY State Tchr Eval System

This post is a follow up on two recent previous posts in which I first criticized consultants to the State of New York for finding substantial patterns of bias in their estimates of principal (correction: School Aggregate) and teacher (correction: Classroom aggregate) median growth percentile scores but still declaring those scores to be fair and accurate, and next criticized the Chancellor of the Board of Regents for her editorial attempting to strong-arm NYC to move forward on an evaluation system adopting those flawed metrics – and declaring the metrics to be “objective” (implying both fair and accurate).

Let’s review. First, the AIR report on the median growth percentiles found, among other biases:

Despite the model conditioning on prior year test scores, schools and teachers with students who had higher prior year test scores, on average, had higher MGPs. Teachers of classes with higher percentages of economically disadvantaged students had lower MGPs. (p. 1)

In other words… if you are a teacher who so happens to have a group of students with higher initial scores, you are likely to get a higher rating, whether that difference is legitimately associated with your teaching effectiveness or not. And, if you are a teacher with more economically disadvantaged kids, you’re likely to get a lower rating. That is, the measures are biased – modestly – on these bases.

Despite these findings, the authors of the technical report chose to conclude:

The model selected to estimate growth scores for New York State provides a fair and accurate method for estimating individual teacher and principal effectiveness based on specific regulatory requirements for a “growth model” in the 2011-2012 school year. p. 40

I provide far more extensive discussion here!  But even a modest bias across the system as a whole can indicate the potential for substantial bias for underlying clusters of teachers serving very high poverty populations or very high or very low prior scoring students. In other words, THE MEASURE IS NOT ACCURATE – AND BY EXTENSION – IS NOT FAIR!!!!! Is this not obvious enough?

The authors of the technical report were wrong – technically wrong – and I would argue morally and ethically wrong in providing NYSED their endorsement of these measures!  You just don’t declare outright, when your own analyses show otherwise, that a measure [to be used for labeling people] is fair and accurate!  [setting aside the general mischaracterization that these are measures of “teacher and principal effectiveness”]

Within a few days after writing this post, I noticed that Chancellor Merryl Tisch of the NY State Board of Regents had posted an op-ed in the NY POST attempting to strong-arm an agreement on a new teacher evaluation system between NYC teachers and the city. In the op-ed, the Chancellor opined:

The student-growth scores provided by the state for teacher evaluations are adjusted for factors such as students who are English Language Learners, students with disabilities and students living in poverty. When used right, growth data from student assessments provide an objective measurement of student achievement and, by extension, teacher performance.

As I noted in my post the other day, one might quibble that Chancellor Tisch has merely stated that the measures are “adjusted for” certain factors and she has not claimed that those adjustments actually work to eliminate bias – which the technical report indicates THEY DO NOT. Further, she has merely declared that the measures are “objective” and not that they are accurate or precise. Personally, I don’t find this deceitful propaganda at all comforting! Objective or not – if the measures are biased, they are not accurate and if they are not accurate they, by extension are not fair.

Sadly, the story of misinformation and disinformation doesn’t stop here. It only gets worse! I received a copy of a letter yesterday from a NY school district that had its teacher evaluation plan approved by NYSED. Here is a portion of the approval letter:

NYSED Letter

Now, I assume this language to be boilerplate. Perhaps not. I’ve underling the good stuff. What we have here is NYSED threatening that they may enforce a corrective action plan on the district if the district uses any other measures of teacher or principal effectiveness that are not sufficiently correlated WITH THE STATE’S OWN BIASED MEASURES OF PRINCIPAL AND TEACHER EFFECTIVENESS!

This is the icing on the cake!  This is sick- warped- wrong!  Consultants to the state find that the measures are biased, and then declare they are “fair and accurate.” The Chancellor spews propaganda that reliance on these measures must proceed with all deliberate speed! (or ELSE!!!!!!!). Then the Chancellor’s enforcers warn individual district officials that they will be subjected to mind control – excuse me – departmental oversight – if they dare to present their own observational or other ratings of teachers or principals that don’t correlate sufficiently with the state imposed, biased measures.

I really don’t even know what to say anymore??????????

But I think it’s time to just say no!