I’ve had the pleasure of running some new models with updated data in the past few days. I recently produced a lengthy report on school funding in Florida.
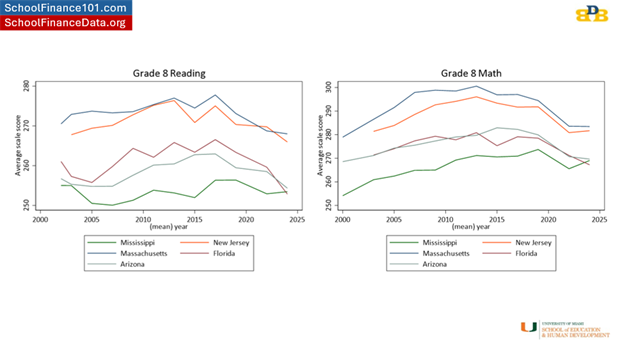
I’ve pointed out on several occasions recently that Florida schools have continued their rapid decline in 8th grade outcomes in reading and math. Florida is one of the reasons why Mississippi’s overall rank improves on national assessments. Yay for Florida.
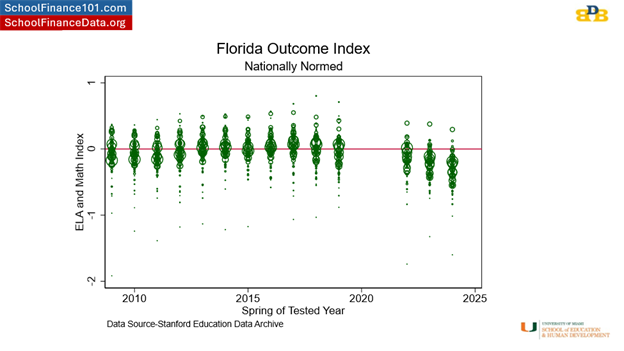
The thing about Florida is that the state, over the past decade and more, has uniformly crushed the public schooling system and the outcomes it produces. Here’s the distribution of district average performance on reading and math for all FL districts compared to national average outcomes (0- horizontal red line). The vast majority of Florida kids are now below – well below that line.
Not shockingly, relating back to my report linked above, there’s a connection between these performance declines and the inadequacy of funding provided to Florida public schools over the past decade. As I explained in my report – and in several other reports and peer reviewed articles – I have a model based on data for every school district in the U.S. which generates predictions of the spending needed in each school district to achieve different levels of student outcomes (standardized reading/math outcomes).
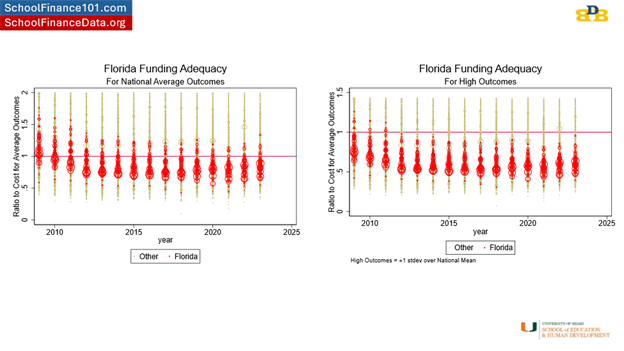
Here’s where Florida districts stand when comparing their current spending as a ratio to the estimated need for achieving a) national average and b) 1 standard deviation above national average outcomes in reading and math. I actually had to cut off the top part of these graphs to focus in on the bottom and show the spread of Florida districts which are now almost entirely packed into the bottom half.
Now, in my report, I explained how the Florida Supreme Court said there’s really no way to set a manageable standard for what’s adequate anyway, so the legislature should just do whatever it wants. Well, those red horizontal lines aren’t just manageable standards, they are reasonable empirical predictions that could be directly used in guiding the state school finance formula. But, silly me, with my data and models (courts in other states have relied heavily on such evidence for setting such standards).
Florida’s constitution (education article), ratified/revised by Florida’s citizens in 1998 and 2002, requires provision of a high quality system of public schools. We can quibble over whether national averages in reading and math are “high quality,” or merely average. I’d say the latter. What’s clear is that Florida’s school finance system, for MOST OF FLORIDA’S CHILDREN falls short of providing sufficient financing for even that goal – and as a result – most Florida children no longer meet even that modest goal?
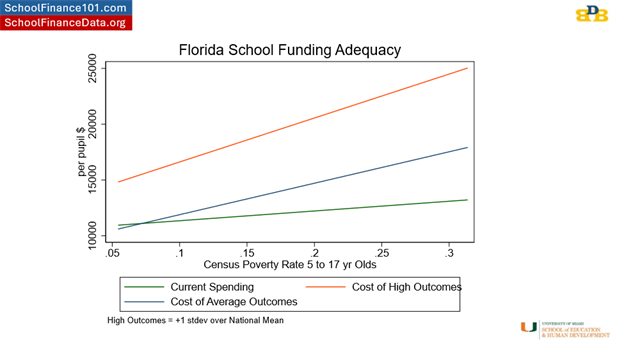
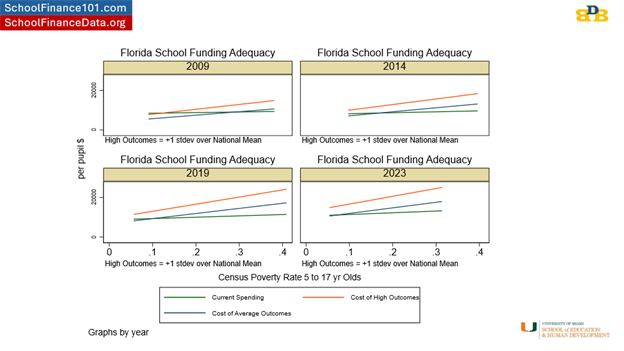
This figure shows the distribution of a) current spending with respect to differences in child poverty rate and b) cost estimates for the low (national average) and high (+1 standard deviation) outcome goals. Florida specifically falls well short of providing sufficient funding for children in higher poverty communities to achieve even the modest outcome goal – national average.
Over time, the reality of Florida school funding – actual spending – has slid further and further below these targets – things weren’t actually so bad in 2009 (kinda “meh” but not like they are now).
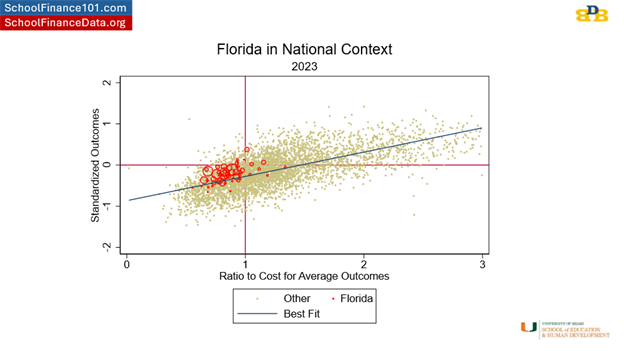
Here’s another view of the problem. A self-inflicted – excuse me – legislatively inflicted problem. After all, the adequacy of school funding in every state is a responsibility of state elected officials. When it’s good, that’s their accomplishment. When it’s not so good? That’s on them too!
Here, we see the overall relationship, across the US, in 2023, between the relative adequacy of funding to achieve national average outcomes (current spending / spending needed), and, their actual outcomes! Shockingly, or perhaps not, districts (each dot is a district – beige are all districts nationally) with more adequate funding have higher outcomes in reading and math. Districts to the right of the vertical red line spend more than their cost estimate (to achieve national average outcomes). Districts to the left of the vertical red line spend less than their need estimate. Districts above the horizontal red line perform above national average outcomes and districts below the horizontal red line perform below national average outcomes. The worst place to be is in the lower left quadrant – not enough money and poor outcomes. And that’s exactly where most Florida school districts presently sit – with better funded districts performing better and worse funded districts performing, well, worse.
One upside for Florida districts is that they generally sit on or above the diagonal line which might be interpreted as representing average efficiency in producing outcomes. Florida school districts are efficiently producing the outcomes they produce – getting better than expected outcomes. By the way, that’s what actual efficiency analysis looks like – not the DOGEY BS we keep hearing about. It’s about rigorously evaluating the quality of output of a business or government entity, given the inputs, and NOT about creating faux outrage over some anecdotal line item on an expense sheet.
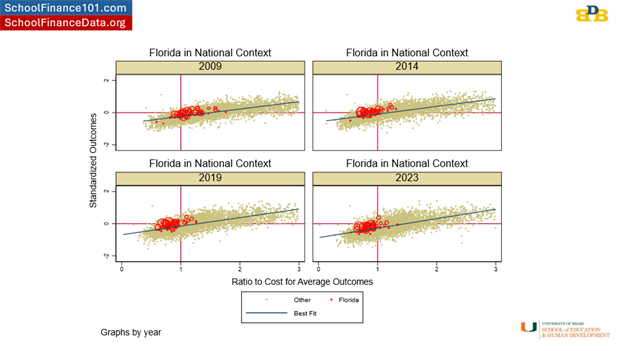
Florida school districts just don’t have the resources to do much better, and as a result, aren’t doing better. The solution one can derive from this image is to push Florida districts up that slide – that diagonal – from lower left to upper right! That is – to provide more adequate funding, and particularly to those furthest in the lower left – which tend to be districts serving higher poverty student populations.
But, rather than push districts from the lower left to the upper right, the state has instead, let districts slide from the middle/upper right to the lower left. This is a problem that can be fixed. And the solution is rather transparent – Adequate funding. And funding progressively distributed to schools and districts serving higher need student populations.
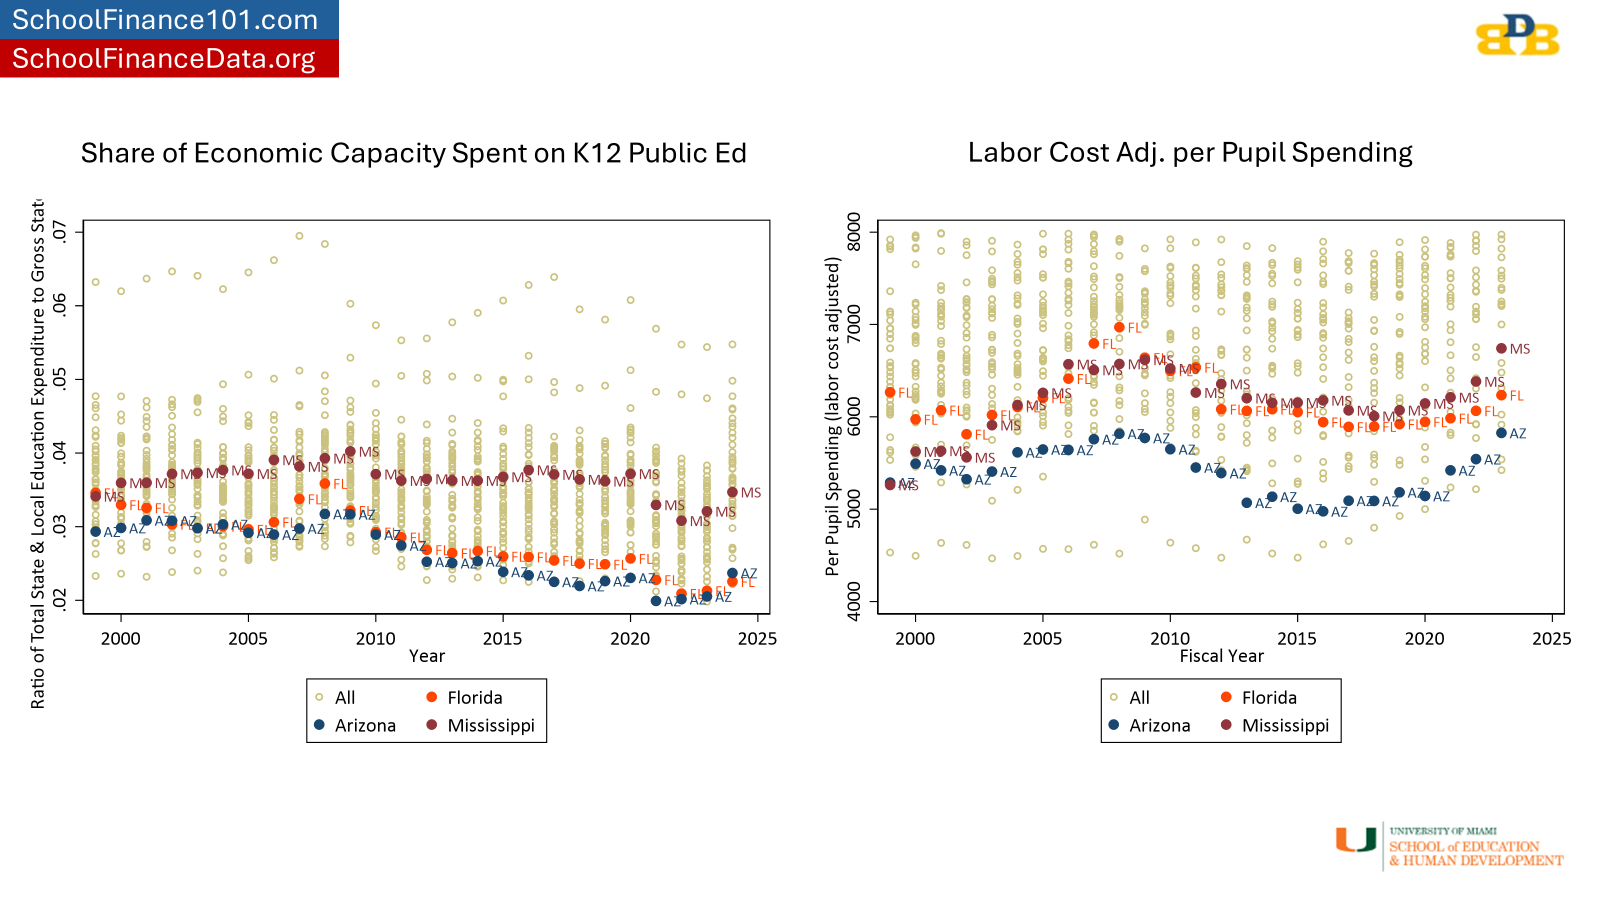
The solution is adequate funding. At least for Florida – here and now. And yes, Florida can afford that solution. Florida is near last in the country on the share of its economic capacity spent on K12 schooling. As a result, Florida school districts actually spend less, in adjusted dollars, per pupil than they did in 1993 and now spend less than Mississippi. Woohooo. Yay for Florida again. As I point out in my report linked above, even if Florida merely spent the same share of state GDP on public ed now as in the mid 2000s, the state would spend nearly 30% more than it does now. That would close a significant portion of the funding gap toward moving the state back to average outcomes. Still not high. But not falling off the cliff they have been for the past several years.
Time to start having the right conversation about school finance in Florida to ensure that all children in Florida have access to “a uniform, efficient, safe, secure, and high quality system of free public schools that allows students to obtain a high quality education…”
