The Real NJ Graduation Scam?

Bob Bowdon, of Cartel fame and E-3 make the claim that New Jersey’s poor urban districts are scamming the public and taxpayers by having overstated graduation rates. About half of poor district kids pass the HSPA test, but 85% graduate. Their brilliant solution to this problem, as I’ve noted previously, is to give kids the choice to attend charters – on the argument that charters are less likely to do such scamming?  So, here are some fun numbers.

First, the percent proficient or higher on HSPA MATH Assessments by district factor group for 2008:

Slide1

So, what we have here is that Charters (DFG R) actually had the lowest rate of kids proficient or higher on HSPA (matching my graph on previous posts, but lower here because only math is included). Yep, even lower than the poorest urban publics (DFG A). Yes, this is an average – among general ed test-takers – and averages conceal the highs… but they similarly conceal the lows.

Now, here are graduation rates for the schools by DFG:

Slide2

Wait one second. How can charters have a 97% graduation rate if only about half of the kids pass HSPA? Where’s the scam here? I thought you said that the differential between HSPA proficiency and graduation rates was supposed to be indicative of a scam? And that charters were the solution to the scam? But where is that differential bigger? Charters are lower on HSPA proficiency by a few points and are 12% higher on graduation rate? Now I’m really confused.

Okay – I’m not trying to pick on charter schools here. You guys are mostly working your butts off for a great cause, and quite honestly I don’t hear these completely absurd arguments coming from the charter leaders and teachers themselves. But the supposed “advocacy” out there on your behalf is deeply problematic. Quite honestly, if someone was out there advertising so poorly for my cause, I’d be a little concerned… or perhaps outraged.

Note to Non-Jersey readers about my casual use of Jersey terminology – DFG. In New Jersey, district factor groups or DFGs are a classification scheme that has been used for decades to characterize socio-economic features of public school districts. DFG A districts are generally poor urban districts, but many NJ poor urban districts are relatively small in total enrollment (a cluster of poor urban neighborhoods segregated from their more affluent neighbors). DFG I and J districts are affluent suburban districts. Charters are labeled “R.”

NJ School Funding Suburban Taxpayer Scam?

I hate wasting so much time countering completely absurd claims, like those that spill out on the E3 Cartel commercials. This is a short reply this time. At the end of one of the commercials, the spokesperson slips in the claim that not only are we wasting a ton of money on our low graduation rates in poor urban schools (I discuss this claim here: https://schoolfinance101.wordpress.com/2009/10/31/cartel-recap/), but this whole inefficient mess is a “suburban taxpayer scam.” Yep, suburbanites (like myself) are being dreadfully over-taxed and our hard earned money is being thrown down the rat-hole. We don’t get any of it back.

A simple question to answer here is whether the property tax effort in suburban communities (however we are supposed to define suburban?)  is that much greater than in “urban” communities. An appropriate way to measure this is by calculating the percent of income paid in property taxes.

Here’s a quick snapshot of tax effort in Essex County by income level and in Monmouth county by income level. These data are taken from http://www.nj.com/news/bythenumbers/, and the data are generally from 2005. Most “Abbott” funding to school districts had scaled up between 1998 and 2005.

Essex Tax Effort

Hmmm… no systematic pattern here. Yep, some pretty big differences, but no systematic pattern between poorer and wealthier communities.

Monmouth Tax Effort

As it turns out, tax effort in Monmouth declines systematically as homeowner income increases. Perhaps this is the “urban tax scam” not suburban one?

Yes, the property tax bill in an affluent suburban community is larger – because it is the tax bill on a more expensive home!  (should I really have to say that?) Yes, low property value, low income communities receive higher rates of state subsidy through the state aid formula for schools. That’s generally how aid equalization formulas work. And yes, New Jersey’s aid is targeted to higher need districts, above and beyond typical equalization (but only since 1998-2003).

Let’s get this straight. If the idea of the funding formula was to send back to communities and school districts exactly the amount submitted to state coffers from residents of those communities – then why the heck would we be collecting it to begin with? This would be a particularly foolish exercise since it costs money to process the tax revenues and send them back. That’s how taxes work – whether collected at the municipal level, providing benefit to the people across the street whose house may be valued (taxable value) less than yours, and tax bill may be proportionately less, or across the state. For those who don’t quite understand this, I recommend the Schoolhouse Rock tune about the Taxman. Pretty good stuff!

In a previous post, I also explain how local media in NJ has distorted comparisons of New Jersey property taxes with other states – https://schoolfinance101.wordpress.com/2009/10/03/should-nj-really-try-to-be-like-de-md-mo-ga-wa/

The Intellectually Vacuous Bob Bowdon’s “Cartel”

See updated post on this topic: https://schoolfinance101.wordpress.com/2010/04/16/cartel-recap/

===== Old post

Had a busy week, so I haven’t posted, but saw a new report yesterday which relates nicely back to the shallow logic of Bob Bowdon’s intellectually vacuous Cartel movie.

The Cartel movie is based on the premise that (a) public schools nationally are failing, (b) public schools in the US spend a ton of money to achieve little, (c) New Jersey is the perfect example of a state which spends a ton of money and fails. All of this, of course, occurs because of a self-interested, self-indulgent cartel of teachers unions and greedy bureaucrats (here’s how their salaries stack up to those “real world” “private sector” workers in NJ). I’ll avoid this latter piece for now, and take a closer look at the logic of points “a” through “c.”

Bowdon cherry picks some national average results from the PISA international assessment of 15 year old students to show that the US compared poorly on math in 2003 and worse in 2006. Of course, any national averages in the U.S. combine the performance of children in states that have largely thrown their public schooling system under the bus  – like Louisiana and Mississippi among others – with those that have done quite well like Massachusetts and New Jersey (indeed it is somewhat unfair to compare directly LA and MS to MA and NJ).

As I have shown in recent posts, there does exist at least some relationship between state aggregate spending (controlling for a variety of factors) and national assessment performance – albeit a relationship heavily entangled with socioeconomic conditions and adult population education levels in states.

Further, as I have also explained previously, an extensive body of research on the effects of school finance reforms including infusion of new resources into poor schools, shows significant positive effects.

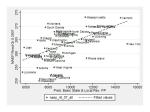
A new study out this month from the American Institutes for Research seeks to make more appropriate statistical comparisons of student math performance on another international assessment – TIMSS (Trends in International Math and Science Study). The authors construct a statistical cross-walk between NAEP state assessment scores and TIMSS scores which can be used for international comparisons.  From this analysis, the authors are able to evaluate where individual states stack up against countries participating in TIMSS. This is important because of the variance in state level performance and differences in state policies, fiscal effort and students served.

For starters, on international comparisons, the US on average scored just below the mean for OECD (organization for economic cooperation and development) countries at the 4th and 8th grade level (we do lag from 4th to 8th, an issue of concern). At both 4th and 8th grade on math, the US average is well above the international mean for all TIMSS participants. Now, we may wish to do better – and should. AIR assigns grades to the score ranges for each country and points out that we don’t perform at the levels we should. But this is far from the absurd, apocalyptic (and simply irresponsibly misguided) view presented by Bowdon.

But wait, Bowdon’s premise is that states like New Jersey are the perfect example of inefficiency – spending so much yet producing these terrible national averages. Certainly, New Jersey can’t be blamed for the national average – which carries with it the baggage of states like Louisiana and Mississippi.

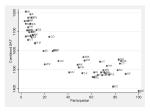
How does New Jersey compare to the OECD average? New Jersey ranks 3rd among states on 4th grade math with 25 states beating the OECD average performance. Not bad for Jersey, along with Massachusetts and Minnesota! Louisiana, Alabama, New Mexico, California and Mississippi carry up the bottom end of the rankings, falling below the OECD mean, but above the overall international mean. That is, even Mississippi and Louisiana beat the international mean.

New Jersey drops a little on 8th grade math (consistent with other NAEP based analyses of NJ), but still does well, coming in 6th among the 27 states which perform above the OECD mean. Again, even Louisiana and Mississippi exceed the international mean, but well below the OECD mean.

I am by no means arguing for complacency  – saying – hey – that’s good enough. Rather, my point here is to re-emphasize that the US has a wide variety of education systems in place across states – some which spend a great deal and in fact perform very well, even in international comparisons. New Jersey is among them. We also in this country have some states that have seriously neglected their education systems, spent little, and shifted large shares of (primarily upper class) children in private schooling (schools that spend more, not less than the public schools in those states) where their performance goes unmeasured in these international and even state by state comparisons (in fact, these may be the children who do well in those states, but we don’t know). WHAT THESE STATES HAVE DONE IS A NATIONAL CONCERN!

It is foolish stretch of logic to blame New Jersey’s high spending (and the Cartel that demanded it) for the poor national average performance on select international comparisons. Yes, New Jersey spends on education, and in fact, New Jersey does quite well with that spending compared to other states and on international comparisons.

Certainly, spending alone is not the solution. But little is added to the debate by producing bombastic, misguided, poorly conceived and irresponsible slick-production rhetoric posing as documentary.

Idiot of the Week (year) Award… The Cartel… Check this out!

See updated post on this topic: https://schoolfinance101.wordpress.com/2010/04/16/cartel-recap/

====

Okay… so I’m curious about The Cartel movie that documents the failures of New Jersey’s public education system… and the high costs of those failures. One might construct a reasonable statistical case for some of the problems facing New Jersey schools… but not documentary filmmaker Bob Bowdon in “The Cartel.” I’ve not seen it yet…. but their page on Facts and Figures here, includes some of the dumbest assertions I think I’ve seen in a long time:

http://thecartelmovie.com/

Go to the bottom of the page where this complete moron attempts to argue that states which spend more on education have lower SAT scores… that spending more leads to lower SAT scores.

[BOWDON APPEARS TO HAVE REMOVED THE TWO CHARTS WHICH ATTEMPT TO MAKE THIS ARGUMENT. SEE COMMENT BELOW]

QUOTES/LABELS FROM THE CHARTS INCLUDED:

“THE MORE A STATE SPENDS ON SCHOOLS THE LOWER ITS KIDS’ SAT SCORES”

“EVERY EXTRA $100 IN EDUCATION SPENDING LOWERS SAT SCORES BY 1 1/3 POINTS”

He kept this statement “With spending as high as $483,000 per classroom (confirmed by NJ Education Department records), New Jersey students fare only slightly better than the national average in reading and math, and rank 37th in average SAT scores.” On his “The Deal” page…

In fact, there may be a connection… that is… states that spend more which happen to be in the northeast, happen to have higher SAT participation rates… because northeastern colleges and universities use the SAT. 82% of New Jersey students take the SAT.  This figure is 9% in Alabama and 4% in Mississippi, and students taking the SAT in those states tend to be the select few interested in attending competitive northeastern colleges.  So, we’re comparing the top 4% of Mississippi students to the 82% of NJ students. Anyway… that absurdity aside, here’s a better picture of how the relationship between state spending on schools relates to state average outcomes. The following four graphs show the relationship between predicted basic state and local revenue per pupil (controlling for sparsity, econ. of scale, state poverty rates, ELL children and regional wage variation) and National Assessment of Educational Progress 2007 scores. Actually, somewhat to my own surprise there is a reasonably positive relationship here. THAT SAID… I DO NOT ASSUME  THIS TO BE A SIMPLE DIRECT CAUSAL RELATIONSHIP. There are many potentially interesting underlying stories that might be told here about regional differences in income, adult population education levels, tax policy structures, etc.

Anyway… for me… this foolishness has reduced significantly any interest I may have had in actually seeing the movie.  Ignorant… juvenile… silly… I’m not even sure how to classify this attempt at a “brilliant revelation” from a scatterplot (FYI – I used to teach my 7th graders how to do this stuff… and draw appropriate inferences…not this kind of crap.)

I was initially pleased to see that the “facts and figures” page on the site actually had links to reasonable facts and figures and reports… rather than making them up off the cuff…(a topic I’ve written about with regard to teacher salaries, administrative salaries, Abbott spending and many other related topics – https://schoolfinance101.wordpress.com/2008/12/09/notes-from-a-school-finance-curmudgeon/).

Here’s the relationship between SAT participation rates and SAT combined scores.

Presentation1

By the way… this graph I previously posted compares teacher salaries other professions holding similar degree levels, at similar age, over time in NJ. And these are hourly wage comparisons. Interestingly, teachers have fallen further and further behind over time.

https://schoolfinance101.wordpress.com/2009/01/14/those-darn-overpaid-nj-teachers-sucking-the-life-out-of-the-lagging-economy/

========

And here’s where NJ actually stands on corrected spending measures and standardized outcomes: