Charter Averages Worse than Originally Estimated

Note: The information below is not a comprehensive research study on the relative effectiveness of New Jersey Charter Schools. Rather, it is a quick summary of average proficiency rates for charters compared to other New Jersey schools by socio-economic strata. Unfortunately, New Jersey Charter schools were not part of two major recent multi-state analyses of charter school effectiveness, which can be found here, along with reviews & critiques of those studies. http://www.epicpolicy.org/think-tank/reviews These studies also found mixed results, with charters in some states slightly outperforming their public school counterparts, in other states performing comparably and in others performing less well. I have put together this post merely to stimulate conversation on how NJ charter schools are doing and perhaps encourage additional more thorough research.

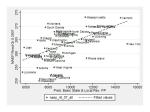
In my original post on NJ Charter School performance, Charter schools appeared to be performing somewhere between performance levels of DFG A and DFG B traditional publics. Here’s one of the graphs to that effect.

% Proficient for All Tested Students

Note that the charter line – R – falls between the DFG A (poorest traditional publics) and DFG B lines. But, this analysis includes all tested students. While I expected that children with disabilties were underrepresented in Charter schools, I had no idea just how under represented until I took a look, here: https://schoolfinance101.com/wp-content/uploads/2009/11/charter-special-ed.jpg

For example, Robert Treat Academy has 3.8% and North Star Academy 7.8% children with disabilities in a district that has 18.1% in 2007. These are higher than many, which actually serve 0%.

So, correcting for this problem by looking only at General Education students, the graph above becomes the graph below:

updated charter rel performance

In this graph, the Charter line maps almost precisely with that of the DFG A line. That is, the slightly higher performance in the first graph is almost entirely a function of the fact that NJ Charters simply don’t serve children with disabilities and don’t have them in their test taking pool. My apologies for this apparently glaring omission.

The biggest change to my analysis however is in the relative probability that a student attends a tested grade level where less than 40% of students are proficient or higher. Making the above correction, leads to the finding that a child in a charter school is 35% more likely than a student in a DFG A traditional school to be in a tested grade level where fewer than 40% of general education students scored proficient or higher.

Here’s the logistic regression, weighted for number of test takers in grade level and on test (general education only), based on the 2008 report card data:

Logistic Regression of Low Performance Grade Level (<40% prof. or adv.)

DFG A is the baseline comparison group. An odds ratio of greater than 1.0 indicates a greater likelihood of being in a grade level with fewer than 40% proficient or advanced than in a traditional DFG A school. Only charters have a greater likelihood – and much greater – 36% greater. Likelihoods vary dramatically for the different tests and subject areas. Apparently, 6th grade tests have cut scores aligned such that many more students do poorly on them. I don’t think that it’s just that 6th graders get dumb for  a year. Newer tests take some tweaking. Note the dip in previous graphs. Note also that in affluent communities (GH through J), there is statistically no chance of being in a low performing grade level.

Here’s a link to the School Reports 2008 Data:

http://education.state.nj.us/rc/rc08/database/nj_rc08.xls

Please – take your own stab at this. I’ve been running these quickly. My Stata data are here.

New Update: Here’s my last shot at it for now. I’ve got the odds for charters down to about 25% greater chance than DFG A schools of being in a grade level where fewer than 40% were proficient or higher. Unfortunately, poverty rates among test takers were only calculable at the district level (and for charters) not school and charters with these data (must use the enrollment data for whole school for that). Also, NJDOE continues the habit of not identifying specific locations of charters in their coding system by county. I have a bridge file somewhere, constructed by zip code, but for charters through 2006. May revisit. Anyway, here’s the logistic regression:

updated logit

Ah the perils of goofing around with data too quickly/on the fly. Fun though.

NJ School Funding Suburban Taxpayer Scam?

I hate wasting so much time countering completely absurd claims, like those that spill out on the E3 Cartel commercials. This is a short reply this time. At the end of one of the commercials, the spokesperson slips in the claim that not only are we wasting a ton of money on our low graduation rates in poor urban schools (I discuss this claim here: https://schoolfinance101.wordpress.com/2009/10/31/cartel-recap/), but this whole inefficient mess is a “suburban taxpayer scam.” Yep, suburbanites (like myself) are being dreadfully over-taxed and our hard earned money is being thrown down the rat-hole. We don’t get any of it back.

A simple question to answer here is whether the property tax effort in suburban communities (however we are supposed to define suburban?)  is that much greater than in “urban” communities. An appropriate way to measure this is by calculating the percent of income paid in property taxes.

Here’s a quick snapshot of tax effort in Essex County by income level and in Monmouth county by income level. These data are taken from http://www.nj.com/news/bythenumbers/, and the data are generally from 2005. Most “Abbott” funding to school districts had scaled up between 1998 and 2005.

Essex Tax Effort

Hmmm… no systematic pattern here. Yep, some pretty big differences, but no systematic pattern between poorer and wealthier communities.

Monmouth Tax Effort

As it turns out, tax effort in Monmouth declines systematically as homeowner income increases. Perhaps this is the “urban tax scam” not suburban one?

Yes, the property tax bill in an affluent suburban community is larger – because it is the tax bill on a more expensive home!  (should I really have to say that?) Yes, low property value, low income communities receive higher rates of state subsidy through the state aid formula for schools. That’s generally how aid equalization formulas work. And yes, New Jersey’s aid is targeted to higher need districts, above and beyond typical equalization (but only since 1998-2003).

Let’s get this straight. If the idea of the funding formula was to send back to communities and school districts exactly the amount submitted to state coffers from residents of those communities – then why the heck would we be collecting it to begin with? This would be a particularly foolish exercise since it costs money to process the tax revenues and send them back. That’s how taxes work – whether collected at the municipal level, providing benefit to the people across the street whose house may be valued (taxable value) less than yours, and tax bill may be proportionately less, or across the state. For those who don’t quite understand this, I recommend the Schoolhouse Rock tune about the Taxman. Pretty good stuff!

In a previous post, I also explain how local media in NJ has distorted comparisons of New Jersey property taxes with other states – https://schoolfinance101.wordpress.com/2009/10/03/should-nj-really-try-to-be-like-de-md-mo-ga-wa/

NJ Charters & Disability Rates

Here’s a quick snapshot of the percent of children classified as having disabilities in Charter schools and in Traditional Public Schools in Essex County. These figures add some context to the spending deficit figures in my previous post. Yes, Charters receive a reduced operating aid subsidy. Charters are most disadvantaged financially by not receiving support for facilities, and having to draw on operating funds for facility leases, or receive substantial private support. But, this piece – special education populations- cuts the other way. Traditional public school districts have about 14% to 18% children with disabilities, which typically run about 90% to 110% above “average” expenditure (to provide typical – not necessarily adequate or great – special education services). For example, if 16% of children qualified as disabled and required additional per pupil expenditure of 100% each, these students would add 16% total cost onto district operating costs – or $1,920 over $12,000 for an average per pupil cost of $13,920. That is – just to provide average/typical special education services – the per pupil cost in a district with 16% special ed would be 16% above the per pupil cost of a district with 0% special ed. In other words, if a district with 16% special ed spends $13,920 and another with 0% special ed spends $12,000, those spending figures are comparable – not vastly different.

Here are the special ed rates among Essex county districts and charters:

https://schoolfinance101.com/wp-content/uploads/2009/11/charter-special-ed.jpg

Note: A knowledgeable reader has informed me that the “0” value for Greater Newark Charter is actually “missing data,” for that year and has assured me that Greater Newark Charter does indeed enroll children with disabilities. At some point, I may get around to updating these analyses. Other “0” values may also represent missing data. But, very low, actual reported rates likely do not.

Charter School Special Education Classification

A few quick NJ Charter School Facts & Figures

AFTER READING THIS, PLEASE SEE CORRECTIONS AT: https://schoolfinance101.wordpress.com/2009/11/04/charter-averages-worse-than-originally-estimated/

If one watches the trailer clips from the Cartel movie on two highly successful New Jersey charter schools, one might be misled to believe that Charter schools are simply uniformly freakin’ awesome. They can do no wrong. They are clearly the answer to all of our problems in urban schooling in New Jersey.  Indeed there is some, if not much solid empirical research literature out there which finds favorable results for charter schools and much which finds that charters on average, are pretty much a break even option.

For an exceptional review of charter school research, I would recommend Robert Bifulco and Katrina Bulkley’s chapter on Charter Schools in the Handbook of Research on Education Finance and Policy. Neither of these scholars are charter school naysayers, yet they conclude:

Research to date provides little evidence that the benefits envisioned in the original conceptions of charter schools – organizational and educational innovation, improved student achievement, and enhanced efficiency – have materialized.”

I am also not a Charter school naysayer, having written in my own previous work that leaders of charter schools seem more likely to recruit or select teachers with stronger academic credentials than traditional public schools in the same state. But, I’m also a realist when I look at data on charter schools, their students and their outcomes.

For starters, let’s look at how New Jersey charter schools begin with a public subsidy disadvantage – which may explain some of the mixed results that follow. Current expenditures from NJDOE annual financial reports through 2005, show charters spending less than many districts, organized by factor group (A being generally poor urban districts, through I & J, being relatively affluent suburbs).

Per Pupil Spending by DFG

In many parts of the country, Charter schools make up for this difference with private fund raising. In fact, most infrastructure costs are covered by such fund raising especially where states fail to provide any facilities support to charter schools. A few years back, I was able to compile the tax returns of the non-profits that support Washington DC charters to show that they received, on average, 14% of their revenue through private contributions. I ran an extract the other day of New Jersey Charter school IRS 990 forms, but few reported their data. Still working on that.

Now, on to the raw outcomes of charter schools in New Jersey based on 2008 assessments. Again, based on the cherry picking in the Cartel movie, one would think that all charters in NJ are kicking butt like North Star Academy. However, prior Charter research and the logic of deregulation lead to more realistic assumptions that – some do well – some not so well – and on average, there may be little difference (if the system, either the “market” or the accountability system, does not shut down those who do not do well). Under less regulation one would simply expect more dispersion. Higher highs perhaps, but also lower lows.

Here’s a quick run down. I begin with the “averages” by grade level and by district factor group. Here’s the % proficient or advanced by DFG, with Charters labeled “R.”

Charters labeled "R"

Charter schools, most though not all of which serve relatively poor student populations, hang right down there, across grade levels with DFG A and B poor schools – especially at both the beginning and end grades. Charters look little different when viewing only those who score advanced and higher.

% Advanced 2008

Okay, so these are the averages which conceal the really fun and interesting variations and drag down the superstars. Here’s the 3rd grade assessment data for two groups of schools – those in District Factor Group A and Charters. Schools are sorted by poverty. DFG A – Poor traditional publics are Blue Cirlces and Charters are hollow red diamonds.

Red Diamonds are Charters, other are DFG A (Poor)
Red Diamonds are Charters, Others are DFG A (poor)
Red Diamonds are Charters

In each case above, the schools are sorted by poverty along the horizontal axis and by proficiency rates on the vertical axis. In each case above, charters are represented by the red diamonds and traditional public schools including only those schools in the poorest district factor groups are represented as blue circles.

The bottom line is that Charter school performance varies widely and varies as widely as traditional public school performance in poor districts. What we do not know yet, because of lack of data is whether the successful charter schools are, in part, successful due to their ability to raise substantial additional resources for their schools. It may be the case that the unsuccessful charters – those that do much less well than even the worst traditional publics are suffering from lack of resources.

Sadly, rather than address these real, substantive issues, organizations such as NJ E3 and individuals like Bob Bowdon have decided to pitch a load of baseless propaganda on public audiences that deserve better. In fact, by pitching this schlock that all charters can do no harm (just look at these 2 really awesome ones!), ignorant pundits like Bowdon are arguably compromising the market decisions of parents – leading them to believe that all charters must necessarily be better than all traditional publics. Market decisions must be based on good information regarding product quality. In this case, it would appear that at least some pundits are creating a new “market for lemons” (knowingly marketing bad charters) at the expense of parents and children for purely political gain (or to sell movie tickets and build reputation). This sales pitch may encourage parents to continue choosing low performing charters, sustaining those schools and holding down the charter average – making the case for charters harder to argue.

The Intellectually Vacuous Bob Bowdon’s “Cartel”

See updated post on this topic: https://schoolfinance101.wordpress.com/2010/04/16/cartel-recap/

===== Old post

Had a busy week, so I haven’t posted, but saw a new report yesterday which relates nicely back to the shallow logic of Bob Bowdon’s intellectually vacuous Cartel movie.

The Cartel movie is based on the premise that (a) public schools nationally are failing, (b) public schools in the US spend a ton of money to achieve little, (c) New Jersey is the perfect example of a state which spends a ton of money and fails. All of this, of course, occurs because of a self-interested, self-indulgent cartel of teachers unions and greedy bureaucrats (here’s how their salaries stack up to those “real world” “private sector” workers in NJ). I’ll avoid this latter piece for now, and take a closer look at the logic of points “a” through “c.”

Bowdon cherry picks some national average results from the PISA international assessment of 15 year old students to show that the US compared poorly on math in 2003 and worse in 2006. Of course, any national averages in the U.S. combine the performance of children in states that have largely thrown their public schooling system under the bus  – like Louisiana and Mississippi among others – with those that have done quite well like Massachusetts and New Jersey (indeed it is somewhat unfair to compare directly LA and MS to MA and NJ).

As I have shown in recent posts, there does exist at least some relationship between state aggregate spending (controlling for a variety of factors) and national assessment performance – albeit a relationship heavily entangled with socioeconomic conditions and adult population education levels in states.

Further, as I have also explained previously, an extensive body of research on the effects of school finance reforms including infusion of new resources into poor schools, shows significant positive effects.

A new study out this month from the American Institutes for Research seeks to make more appropriate statistical comparisons of student math performance on another international assessment – TIMSS (Trends in International Math and Science Study). The authors construct a statistical cross-walk between NAEP state assessment scores and TIMSS scores which can be used for international comparisons.  From this analysis, the authors are able to evaluate where individual states stack up against countries participating in TIMSS. This is important because of the variance in state level performance and differences in state policies, fiscal effort and students served.

For starters, on international comparisons, the US on average scored just below the mean for OECD (organization for economic cooperation and development) countries at the 4th and 8th grade level (we do lag from 4th to 8th, an issue of concern). At both 4th and 8th grade on math, the US average is well above the international mean for all TIMSS participants. Now, we may wish to do better – and should. AIR assigns grades to the score ranges for each country and points out that we don’t perform at the levels we should. But this is far from the absurd, apocalyptic (and simply irresponsibly misguided) view presented by Bowdon.

But wait, Bowdon’s premise is that states like New Jersey are the perfect example of inefficiency – spending so much yet producing these terrible national averages. Certainly, New Jersey can’t be blamed for the national average – which carries with it the baggage of states like Louisiana and Mississippi.

How does New Jersey compare to the OECD average? New Jersey ranks 3rd among states on 4th grade math with 25 states beating the OECD average performance. Not bad for Jersey, along with Massachusetts and Minnesota! Louisiana, Alabama, New Mexico, California and Mississippi carry up the bottom end of the rankings, falling below the OECD mean, but above the overall international mean. That is, even Mississippi and Louisiana beat the international mean.

New Jersey drops a little on 8th grade math (consistent with other NAEP based analyses of NJ), but still does well, coming in 6th among the 27 states which perform above the OECD mean. Again, even Louisiana and Mississippi exceed the international mean, but well below the OECD mean.

I am by no means arguing for complacency  – saying – hey – that’s good enough. Rather, my point here is to re-emphasize that the US has a wide variety of education systems in place across states – some which spend a great deal and in fact perform very well, even in international comparisons. New Jersey is among them. We also in this country have some states that have seriously neglected their education systems, spent little, and shifted large shares of (primarily upper class) children in private schooling (schools that spend more, not less than the public schools in those states) where their performance goes unmeasured in these international and even state by state comparisons (in fact, these may be the children who do well in those states, but we don’t know). WHAT THESE STATES HAVE DONE IS A NATIONAL CONCERN!

It is foolish stretch of logic to blame New Jersey’s high spending (and the Cartel that demanded it) for the poor national average performance on select international comparisons. Yes, New Jersey spends on education, and in fact, New Jersey does quite well with that spending compared to other states and on international comparisons.

Certainly, spending alone is not the solution. But little is added to the debate by producing bombastic, misguided, poorly conceived and irresponsible slick-production rhetoric posing as documentary.

NJ Teacher and Administrator Wages

I got curious this morning, and ended up spending more time than I wanted to on this quick and dirty analysis. You see… the whole premise of this Cartel movie is that the teacher unions in NJ are a mob cartel that has bullied the state into lining their (union members) pockets with high salaries, guaranteed annual increases, and all for no actual return in the quality of schooling. My slides in a previous post actually speak to the relative quality of NJ schooling in relation to NJ state and local revenues for schooling.

Anyway, this morning I ran a quick check on how elementary and secondary teacher and administrator wages stack up compared to other workers in NJ from 2000 to 2007. You’d think from all the rhetoric that they’ve run away from the pack. As in a much earlier post, I’ve taken data from the U.S. Census Integrated Public Use Micro Data System (Census 2000) and from the subsequent American Community Surveys. I’ve included only individuals with a BA or MA degree and between the ages of 23 and 65. I’ve computed relative “income from wages” from a regression model which controls for the Hours Worked per Week, Weeks Worked per Year, Age of Individual, whether they hold an MA or BA, race and gender (essentially comparing male wages to male wages, female to female, black to black, white to white… which, given gender wage gaps in many fields and the high percentage teachers who are female, potentially leads to overstating teacher relative wages).  Here’s what I got:

Slide33

Yep… teachers have fallen sligthly behind. Administrator estimates have jumped around average. The green line  is the average predicted income from wages for a worker of similar attributes (hours per week, weeks per year, age, sex, race, degree level) as the teacher or administrator. Personally, I’d expect a 40 year old school administrator to make more than “average” for any 40 year old worker with a masters degree working similar weeks and hours per year. But even that has not systematically been the case in NJ over the past several years. Nor have administrator wages grown systematically relative to other comparable workers. (note that by excluding professional degrees and doctorates, I’ve excluded doctors and lawyers, but have not excluded other managers, individuals with MBAs, or architects and engineers).

Idiot of the Week (year) Award… The Cartel… Check this out!

See updated post on this topic: https://schoolfinance101.wordpress.com/2010/04/16/cartel-recap/

====

Okay… so I’m curious about The Cartel movie that documents the failures of New Jersey’s public education system… and the high costs of those failures. One might construct a reasonable statistical case for some of the problems facing New Jersey schools… but not documentary filmmaker Bob Bowdon in “The Cartel.” I’ve not seen it yet…. but their page on Facts and Figures here, includes some of the dumbest assertions I think I’ve seen in a long time:

http://thecartelmovie.com/

Go to the bottom of the page where this complete moron attempts to argue that states which spend more on education have lower SAT scores… that spending more leads to lower SAT scores.

[BOWDON APPEARS TO HAVE REMOVED THE TWO CHARTS WHICH ATTEMPT TO MAKE THIS ARGUMENT. SEE COMMENT BELOW]

QUOTES/LABELS FROM THE CHARTS INCLUDED:

“THE MORE A STATE SPENDS ON SCHOOLS THE LOWER ITS KIDS’ SAT SCORES”

“EVERY EXTRA $100 IN EDUCATION SPENDING LOWERS SAT SCORES BY 1 1/3 POINTS”

He kept this statement “With spending as high as $483,000 per classroom (confirmed by NJ Education Department records), New Jersey students fare only slightly better than the national average in reading and math, and rank 37th in average SAT scores.” On his “The Deal” page…

In fact, there may be a connection… that is… states that spend more which happen to be in the northeast, happen to have higher SAT participation rates… because northeastern colleges and universities use the SAT. 82% of New Jersey students take the SAT.  This figure is 9% in Alabama and 4% in Mississippi, and students taking the SAT in those states tend to be the select few interested in attending competitive northeastern colleges.  So, we’re comparing the top 4% of Mississippi students to the 82% of NJ students. Anyway… that absurdity aside, here’s a better picture of how the relationship between state spending on schools relates to state average outcomes. The following four graphs show the relationship between predicted basic state and local revenue per pupil (controlling for sparsity, econ. of scale, state poverty rates, ELL children and regional wage variation) and National Assessment of Educational Progress 2007 scores. Actually, somewhat to my own surprise there is a reasonably positive relationship here. THAT SAID… I DO NOT ASSUME  THIS TO BE A SIMPLE DIRECT CAUSAL RELATIONSHIP. There are many potentially interesting underlying stories that might be told here about regional differences in income, adult population education levels, tax policy structures, etc.

Anyway… for me… this foolishness has reduced significantly any interest I may have had in actually seeing the movie.  Ignorant… juvenile… silly… I’m not even sure how to classify this attempt at a “brilliant revelation” from a scatterplot (FYI – I used to teach my 7th graders how to do this stuff… and draw appropriate inferences…not this kind of crap.)

I was initially pleased to see that the “facts and figures” page on the site actually had links to reasonable facts and figures and reports… rather than making them up off the cuff…(a topic I’ve written about with regard to teacher salaries, administrative salaries, Abbott spending and many other related topics – https://schoolfinance101.wordpress.com/2008/12/09/notes-from-a-school-finance-curmudgeon/).

Here’s the relationship between SAT participation rates and SAT combined scores.

Presentation1

By the way… this graph I previously posted compares teacher salaries other professions holding similar degree levels, at similar age, over time in NJ. And these are hourly wage comparisons. Interestingly, teachers have fallen further and further behind over time.

https://schoolfinance101.wordpress.com/2009/01/14/those-darn-overpaid-nj-teachers-sucking-the-life-out-of-the-lagging-economy/

========

And here’s where NJ actually stands on corrected spending measures and standardized outcomes:

Do School Finance Reforms Make Any Difference?

Well… here’s what a number of reasonably strong empirical studies have shown…

•   David Card & A. Abigail Payne, School Finance Reform, The Distribution of School Spending, and the Distribution of Student Test Scores, 83 J. Pub. Econ. 49 (2002)
–    Using micro samples of SAT scores from this same period, we then test whether changes in spending inequality affect the gap in achievement between different family background groups. We find evidence that equalization of spending leads to a narrowing of test score outcomes across family background groups. (p. 49)
•    John Deke, A Study of the Impact of Public School Spending on Postsecondary Educational Attainment Using Statewide School District Financing in Kansas, 22 Econ. Educ. Rev. 275 (2003)
–    In this paper, I use a policy change in Kansas involving statewide school district refinancing to measure the impact of per-pupil spending on the probability that a student will choose to acquire more education. Using panel models that, if biased, are likely biased downward, I have a conservative estimate of the impact of a 20% increase in spending on the probability of going on to postsecondary education. The regression results show that such a spending increase raises that probability by approximately 5%.
•   Thomas Downes (2004) School Finance Reform and School Quality: Lessons from Vermont. In Yinger, J. (ed) Helping Children Left Behind: State Aid and the Pursuit of Educational Equity. Cambridge, MA: MIT Press.
–    All of the evidence cited in this paper supports the conclusion that Act 60 has dramatically reduced dispersion in education spending and has done this by weakening the link between spending and property wealth. Further, the regressions presented in this paper offer some evidence that student performance has become more equal in the post–Act 60 period. And no results support the conclusion that Act 60 has contributed to increased dispersion in performance. (p. 312)
•    Tom Downes, Jeffrey Zabel, Dana Ansel (2009) Incomplete Grade: Massachusetts Education Reform at 15. Boston, MA. MassINC.
–    The achievement gap notwithstanding, thisresearch provides new evidence that the state’s investment has had a clear and significant impact. The achievement gap notwithstanding, this research provides new evidence that the state’s investment has had a clear and significant impact. how education reform has been successful in raising the achievement of students in the previously low-spending districts.4  Quite simply, this comprehensive analysis documents that without Ed Reform the achievement gap would be larger than it is today. (p. 5)
•    Jonathan Guryan (2003) Does Money Matter? Estimates from Education Finance Reform in Massachusetts. Working Paper No. 8269. Cambridge, MA: National Bureau of Economic Research.
–    Using state aid formulas as instruments, I find that increases in per-pupil spending led to significant increases in math, reading, science, and social studies test scores for 4th- and 8th-grade students. The magnitudes imply a $1,000 increase in per-pupil spending leads to about a third to a half of a standard-deviation increase in average test scores. It is noted that the state aid driving the estimates is targeted to under-funded school districts, which may have atypical returns to additional expenditures.
•    Margaret Goertz & Michael Weiss (2008) Assessing Success in School Finance Litigation: The Case of New Jersey
–    State Assessments: The gap between Abbott districts and all other districts was reduced to 12 points by 2005 or 0.40 standard deviation units. The gap between the Abbott districts and the high wealth districts closed from 25 points to 15 points in 2005 (Figure 7). Performance in the low, middle, and high wealth districts essentially remained parallel during this time. (p. 17)
–    NAEP: The NAEP results confirm the changes we saw using state assessment data. NAEP scores in 4th grade reading and mathematics in Central Cities rose 19 and 20 points, respectively between the mid-1990s and 2005, a rate that was faster than either the Urban Fringe or the state as a whole. P. 20)

Those darn overpaid NJ teachers sucking the life out of the lagging economy

njdec62007_final

I start this entry with a graph. We’ve all been hearing about the rough economic times and troubled state budgets. And, in New Jersey we’ve been hearing about how public employees should take the hit, just like private sector employees. At least some media outlets love to to toss around the bombastic rhetoric about how everyone else is suffering and has been for years… while those damn teacher salaries – because of their powerful unions – have just continued to climb and climb – seemingly leaving the rest of us  in the dust.

Well, above is one verison of the story – a comparison of teacher wages with wages from other professions for individuals aged 25 to 40 holding a bachelors or masters degree (degree levels held by most teachers). For this analysis I use hourly wages drawn from decennial census data (www.ipums.org) and from the American Community Survey (ACS for 2005). Teacher wages are shown on the blue line, and were relatively competitive in 1980 according to these data. Since 1990 teacher wages have lagged significantly relative to other individuals with a BA or MA (and similar age span) in other professions.

I too was surprised by this.

FOR AN UPDATED POST, SEE: https://schoolfinance101.wordpress.com/2010/01/27/new-jersey-teacher-salaries-spiraling-out-of-control/

Consolidation and the Costs of Public School Systems

When budgets get tight across states, legislatures try to figure out where they are going to find savings… as fast as possible.  One idea that resurfaces now and then is  consolidation of school districts and/or other layers of government within states, where some of those layers draw on state resources – especially schools. The issue has again emerged in Kansas as having the potential to produce “huge” savings. There is little doubt in the research literature on public education costs that smaller school districts do have elevated costs of producing even the same outcome levels of larger districts. The best review of literature on this topic was written by Andrews, Duncombe and Yinger (2002) in the Economics of Education Review, which noted that costs tend to rise for districts enrolling fewer than 2,000 students. Costs tend to rise most sharply for districts enrolling fewer than 300 students. Duncombe and Yinger have also produced more recent work on the potential savings from consolidation.

Click to access Does_School_Consolidation_Nov_05.pdf

In this article (later published in the Journal of Education Finance and Policy) the authors do find that consolidation can lead to reduced operating costs – assuming schools within districts are reorganized to achieve more optimal size.

As you might expect, Kansas Liberty, throwing its support behind the conservative house Speaker Mike O’Neil has chosen to echo the speaker’s arguments about the huge potential savings… most likely from reduction of administrative redundancies (their argument… certainly not mine).

http://www.kansasliberty.com/liberty-update-archive/2009/12jan/house-speaker-says-the-legislature-needs-to-start-examining-consolidation-of-school-district-administrators/

Consolidating Kansas school districts and other layers of government further is probably a good idea, but the savings are unlikely to be any where near as large as legislators might desire. A few important points:

1. central administrative overhead costs for public schools are relatively small – as a share of public education expenditures. The real long term savings comes not so much from reducing centralized administration (numbers of district units) but from reorganizing individual schools into more optimal operating sizes – where feasible (elementary schools of 300 to 500 students and high schools of 600 to 900 students). But, achieving this optimal long run arrangement often means significant increases in short run capital costs. As such, a well designed consolidation plan likely does not help with the short term budget crunch.

2. When one thinks of consolidating Kansas school districts, one often thinks only of consolidating the smallest of rural school districts, but many of these districts likely can’t feasibly be consolidated at the school level. Only the relatively small district level redundancies might be eliminated. One must also look to reorganize smaller districts that are carved out of and clustered near the state’s much larger cities and towns (e.g. consolidating Piper with KCK).

As for total savings, the legislature needs to realize that large shares of the state’s children already attend scale efficient, reasonably well organized school districts (as a function of the 1963 consolidations) and many of the children who attend very small districts also attend districts that are geographically remote, such that the bulk of operating costs cannot (with present teaching/learning strategies) be cut.

Consolidating and/or reorganizing school districts is likely an even more viable option for states other than Kansas.  I cannot say enough that the rationality, equity and adequacy of state programs for financing public school systems is inextricably linked to the organization of those school districts  – the grade ranges of children they serve, the enrollment size of those districts and the extent to which many small “un-organized” school districts are, in some states, carved out of densely populated areas.

Below is a table of states ranked by the percentage of children in those states who attend scale efficient (>2,000 students) unified K-12 school districts (NCES Common Core of Data fro 2006-07). While states like Montana, South Dakota, Wyoming and Nebraska make this list – as does Kansas, there is arguably less that can be done in these states to feasibly relocate children into schools and districts of optimal size.

Vermont, on the other hand is a particularly interesting case – with only slightly more students in total than Wyoming, but very few attending unified public school districts of reasonable size. Vermont is near the top of my list for major re-organization, especially as student enrollments continue to decline. The lack of organization of Vermont school districts, the role of non-operating districts and complex tuition arrangements between elementary and union high school districts has – year after year – undermined that state’s ability to achieve greater equity in school funding.

The case is similar, though arguably even more exaggerated in the nation’s most population dense state – New Jersey. Like Vermont, New Jersey has a multitude of small, non-unified school districts, not in the remote southern pine barrens area, but in densely populated areas adjacent to New York City (Bergen County) and near Philadelphia. In some cases, undersized K-8 school districts span a few city blocks. Even more so than Vermont, New Jersey has made efforts to improve equity in school funding – but some of these gains are necessarily offset by the awkward and inefficient organization of New Jersey school districts.

Finally, there’s Illinois – which unlike Vermont or New Jersey has never really made any effort to improve equity in financing schools. In fact, Illinois is among the only states that to this day maintains a persistent strong negative relationship between available school resources and school district poverty and racial composition. Now, not familiar with details of school district organization in Illinois, one might assume the unorganized school districts to exist in the southern and more rural regions of the state. However, Illinois’ lack of organization of school districts mirrors that of New Jersey – existing primarily in the most densely populated suburbs around Chicago.

So, there they are… my picks for the day for consolidation and reorganization – Vermont, Illinois and New Jersey – if anyone is paying attention. In Illinois and New Jersey especially, the geographic constraints to reorganizing where students attend school are minimized. Vermont might take a little more work, and all three will require some significant investment in new and reorganized infrastructure.

organization1