In Connecticut, Where There’s a Reformy Con, There’s a CAN!

I was intrigued a few days ago when I saw this headline in my news alerts regarding school funding.

Headline: Report: Funding helps low-performing school districts

I was particularly intrigued because the headline comes from a Connecticut newspaper where I am fully aware that the state really hasn’t done crap to substantively increase resources for low performing, or more specifically high need schools and districts.

Disclaimer: I am fully aware of this because I have been providing technical/expert assistance to local public school districts that have been persistently shortchanged by the state school finance formula (Education Cost Sharing Formula). That, and even prior to my involvement supporting these districts (and more importantly, the kids they serve) in Connecticut, I had already blogged on their plight.

So then, how can it possibly be that that a CT newspaper would print such a ridiculous headline? And where could one possibly find a “Report” that somehow validates that the state has provided funding to help low performing districts?

Well, in Connecticut, where there’s data-free drivel on education policy spewing from the headlines, there’s usually one single source for that drivel – our old friends at ConnCAN!

Yep, they’ve produced a new report! And it’s about as technically solid as many of their previous reports!

An important caveat here is that the ConnCAN report itself (the linked report) doesn’t really seem to address directly the point that is highlighted in this article – that the reforms being implemented by the Malloy administration have improved the financial conditions of districts serving high need populations.

So then where does this strange assertion come from? Did the author of the “news” (used as loosely as possible) article simply make this up – or were they fed this line by ConnCAN? I’m not sure… but the author of the article in the Middletown newspaper begins with this bold statement:

Funding made available by last year’s Public Act 12-116 has helped some of the states lowest-performing school districts, including Middletown, according to the Connecticut Coalition for Achievement Now, an education advocacy organization based in New Haven.

Then, the author of the article summarizes what are characterized as “Highlights from ConnCAN’s March 2013 Progress Report.”

I find it hard to believe the author of the article crafted these summaries on his/her own. So, let’s take these fact-challenged reformy highlights one at a time (again, on the assumption that these highlights are somehow intended to support the article’s thesis – that the reforms have somehow mitigated funding problems/disparities?):
ConnCAN Con:

School Finance: P.A. 12-116 created a Common Chart of Accounts to be implemented in 2014-15, creating across the board standards aimed at enhancing transparency in education spending. To date, the Office of Policy and Management has selected the accounting firm Blum Shapiro to develop a framework for Common Chart of Accounts development and execution.

MY REPLY

Let’s start here with simple acknowledgement that creating a common chart of accounts does little or nothing – okay, NOTHING – to enhance the equity or adequacy of educational funding across districts. So, what did the state actually do to enhance that funding? Not so much really.

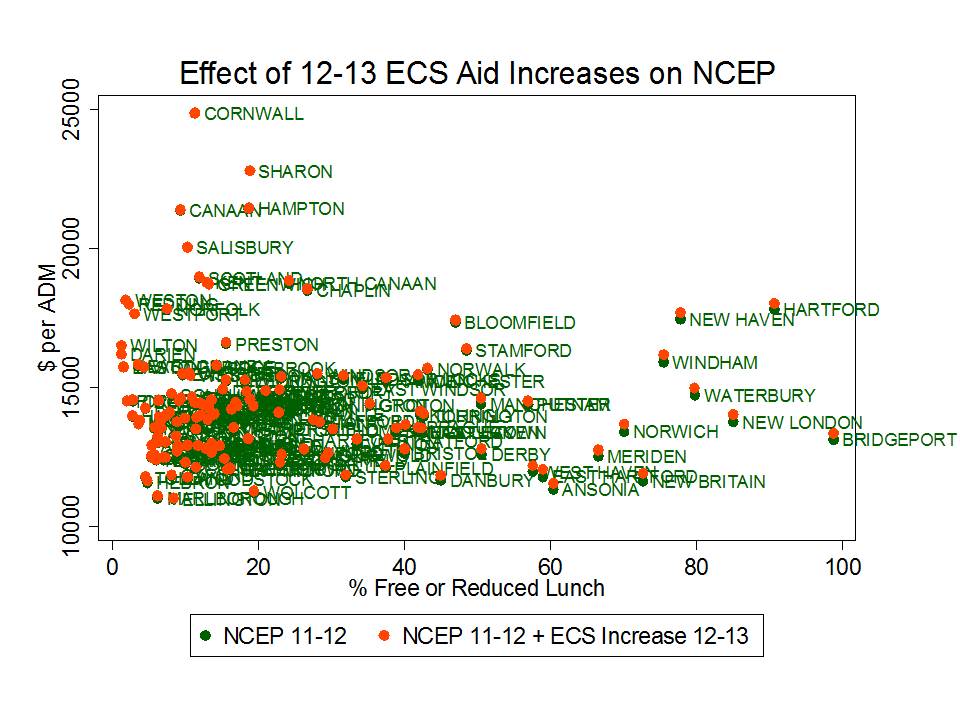
Figure 1 shows the effect of the $50 million dollar increase in ECS Aid for 2012-13, when added to Net Current Expenditures (NCEP) for 2011-12. The 2011-12 NCEP distribution is shown in green dots. The changes to NCEP that would result from the additional state aid are shown in orange dots. In green dots, we see that districts like Bridgeport, New Britain, Waterbury and Meriden are significantly disadvantaged by the ECS formula in 2011-12, in terms of their resultant NCEP.

AND, perhaps more importantly, we see that “increases” to funding for 12-13 really didn’t change much!

Figure 1.

Slide1

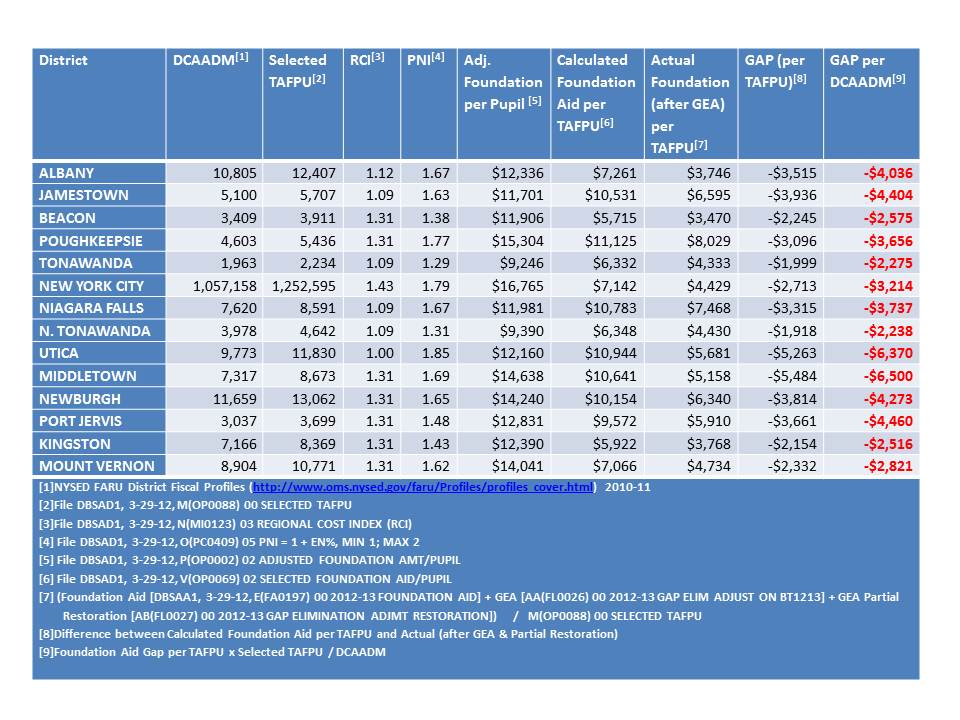
Table 1 includes NCEP for 2011-12 and the actual aid increases for 2012-13 (divided by ADM for 11-12) for Alliance Districts which include several high need districts.  I have also expressed the ECS aid increase as a percent increase over NCEP 2011-12. Most increases were less than $200 per pupil and well less than 2%.

Table 1.

Alliance District Spending & Aid Increases 12-13

Malloy_arky
ConnCAN Con:

School Choice: P.A. 12-116 increased per-pupil funding for public charter students ($10,500/FY13, $11,000/FY14, and $11,500/FY15) and allowed for the creation of 4 new state approved charters. Since then, per-pupil charter funds were cut by $300 for the FY13, and 27 letters-of-interest were submitted to the State Department of Education for launching new charters.

MY REPLY:

It is indeed true that recent adjustments to the funding formula provided more significant increases in aid to charter schools.  At best, these increases fail to alter the distribution of opportunities to Connecticut schoolchildren.  More likely, they in fact exacerbate disparities. Charters serve a relatively small share of the total student population. Most children in high need districts remain in district schools that saw negligible increase in funding. In that sense, charter funding increases have limited effect.

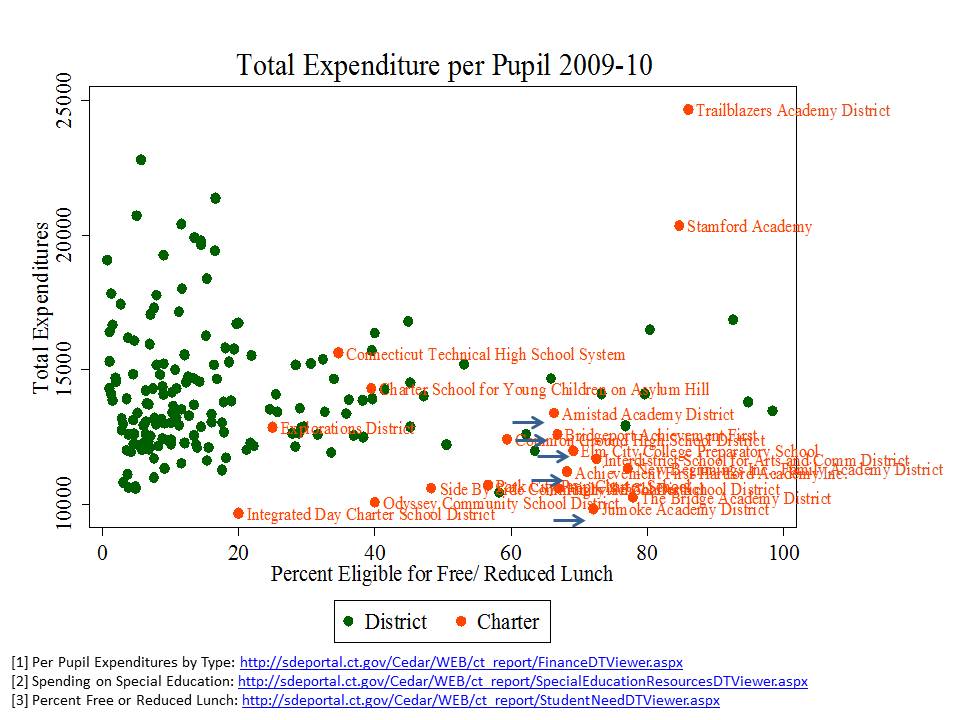
But, as it turns out, many of the charter schools in high need districts that received the greater increases in funding actually serve much lower need student populations (See Table 2).

Table 2. Selected Characteristics of Charter Schools in Cities where Mean % Free Lunch Exceeds 50%

Slide2

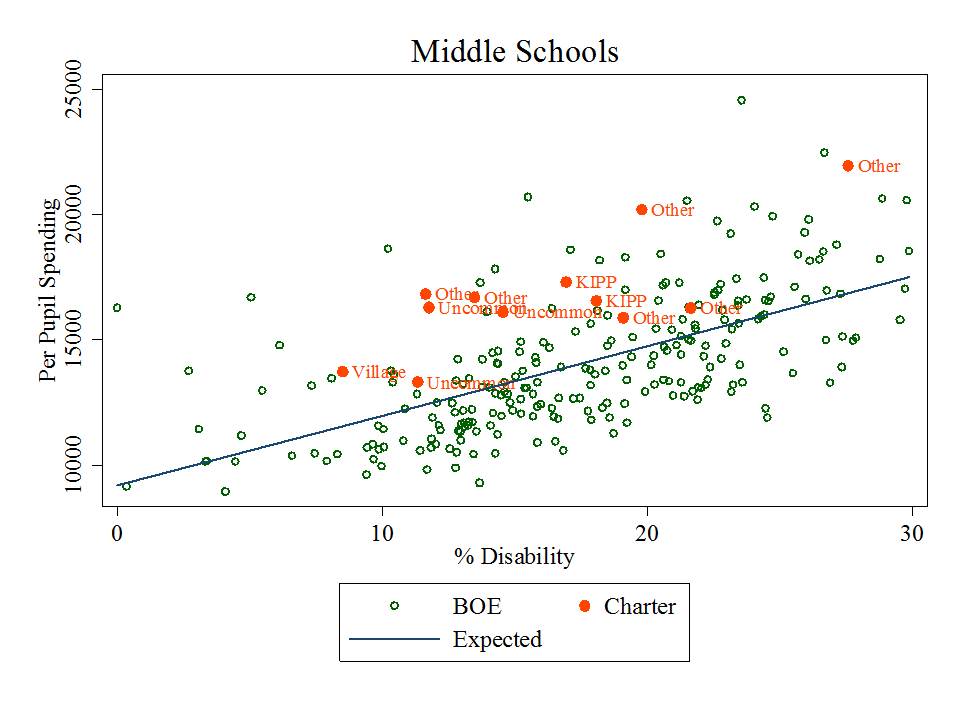
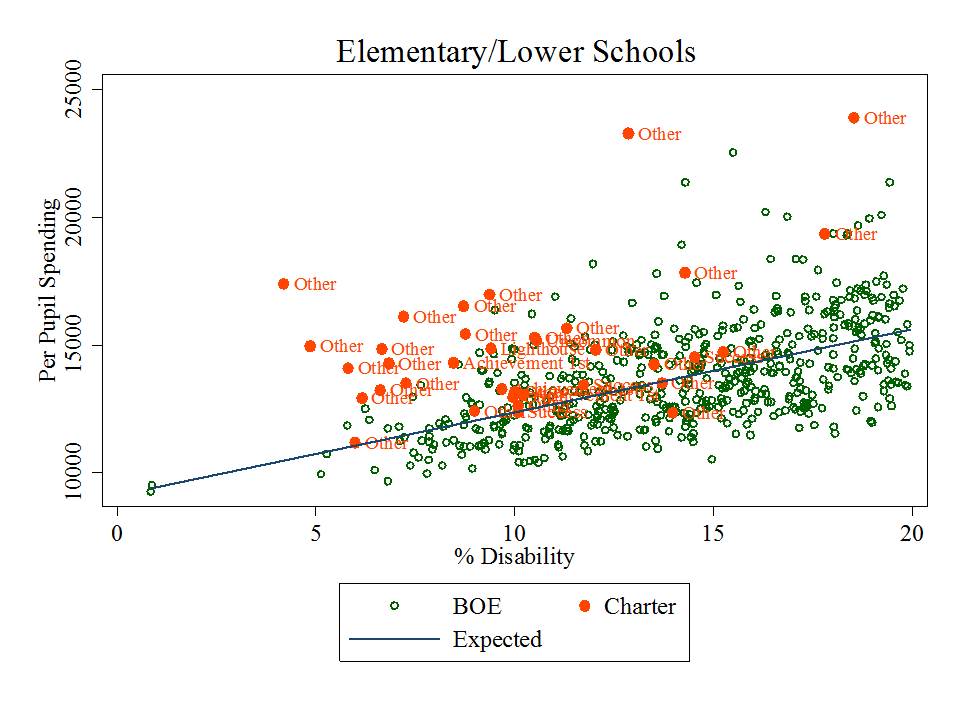
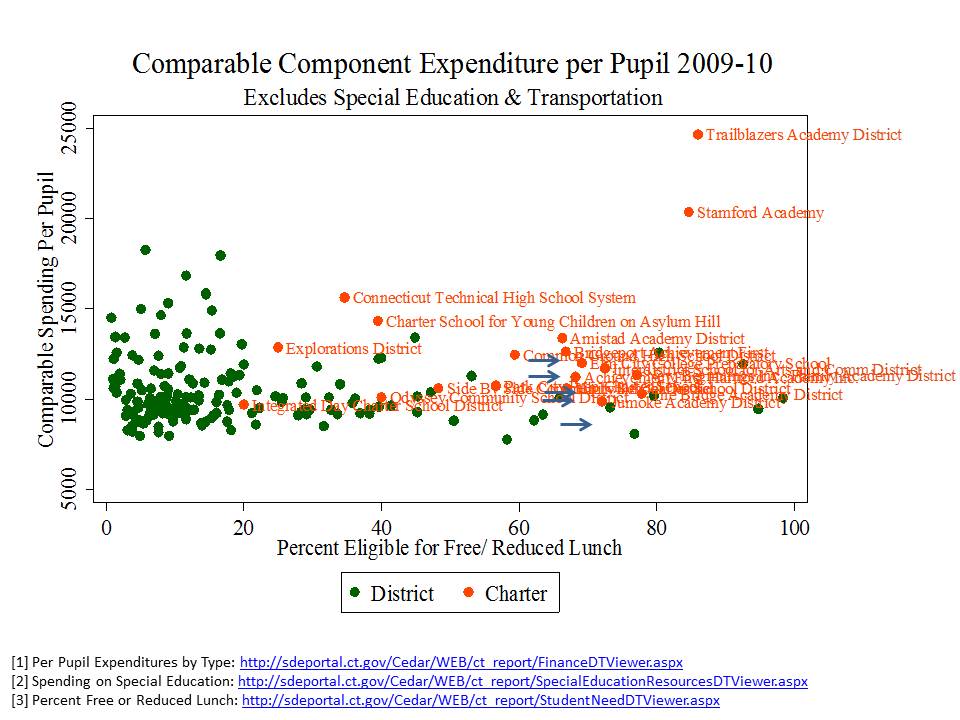
Further, after removing district expenditures on transportation and special education (expenses for which host districts are primarily responsible), many charters already substantially outspent district averages (see Table 3).[1]

In short, increasing funding to charters which already outspent host districts while cream-skimming lower need students, exacerbates rather than moderating disparities in opportunity.

Table 3. Total & Comparable per Pupil Spending for Charters & Districts with Free/Reduced Lunch >50%, 2009-10, Prior to Funding Boost for Charter Schools

Slide4

[1] Per Pupil Expenditures by Type: http://sdeportal.ct.gov/Cedar/WEB/ct_report/FinanceDTViewer.aspx

[2] Spending on Special Education: http://sdeportal.ct.gov/Cedar/WEB/ct_report/SpecialEducationResourcesDTViewer.aspx

[3] Percent Free or Reduced Lunch: http://sdeportal.ct.gov/Cedar/WEB/ct_report/StudentNeedDTViewer.aspx

ConnCAN Cons (lumping these last two together):

Commissioner’s Network: P.A. 12-116 gave the Commissioner of Education and the State Board of Education authority to select up to 25 of the lowest performing schools into the Commissioner’s Network school turnaround effort. Currently, 4 schools are in the Commissioner’s Network (located in Bridgeport, Hartford, New Haven, and Norwich). The state recently invited six additional schools to submit plans for inclusion in 2013-14 (located in Bridgeport, New Britain, Norwalk, Waterbury (2), and Windham).

Alliance Districts: P.A. 12-116 earmarked $39.5 million in conditional aid for the state’s 30 lowest performing school districts. So far, all 30 district plans have been approved and $39.5 million allocated.

MY REPLY

Now, in the charts above, you’ve seen the rather dramatic (cough/gag) effect that adding $50 million has on Connecticut’s high need districts through the aid formula. Well, here what we have is an even smaller amount of additional aid, to be handed out at the discretion of a single bureaucrat. Nothing systematic. Nothing substantial. Entirely discretionary, and meager.

As noted by ConnCAN, the legislation provides for 25 schools to enter the Commissioner’s network and maybe have access to some additional financial assistance.  There are far more than 25 schools in total in high need districts.  Further, each school can remain in the network for a maximum of three years, and it is unclear whether any supports would exist beyond those three years.

Let’s be absolutely clear here: Educational adequacy and equal educational opportunity a) should not be reserved for a tiny minority of schools, b) should not sunset and c) should not be at the discretion of a single political appointee.

Equally if not more likely, the various proposed structural and governance changes, coupled with new unfunded mandates, will exacerbate existing inequities across Connecticut schools and districts.   For example, many of the policy changes addressed by ConnCAN are little more than labeling schemes that merely highlight existing disparities.

Worse, the most negative and consequential labels fall disproportionately on schools in those districts already disadvantaged financially.

A substantial body of existing literature links school rating systems with local residential property values, including state accountability system assigned school grades.[2]  In short, negative labels may lead to further erosion of housing values and tax base. Further, it is likely that increased threat of state intervention and reduction of local control over schools may adversely affect local property values. The proposed reforms, lacking any substantive provision of additional resources, threaten to accelerate a downward spiral of districts already in long-run economic and educational decline.

Already, a large share of schools classified as “review” schools are not only high need schools, but high need schools concentrated in very high need, and underfunded districts (Bridgeport, Meriden, New Britain, New London & Waterbury).[5]  By contrast, the main distinction of many of the “distinction” schools identified in urban Connecticut contexts is that they serve very few of the lowest income children, few or no children with disabilities and few or no children with limited English language proficiency (See Table 4).

Meanwhile, other schools of distinction are those in the state’s most affluent suburbs.  In other words, the state has adopted a rating scheme driven primarily by student demographics to mislabel the “quality” or “effectiveness” of local public schools. Further, the rating scheme is designed to grant the state greater authority to disrupt local governance of schools, which, while the state may perceive this alternative only in positive light, local property owners and potential property owners may view it quite differently.

Table 4. Selected Characteristics of “Distinction Schools” in Cities where Mean % Free Lunch Exceeds 50%

Slide3ConnCAN Con:

Educator Evaluations: P.A. 12-116 mandated that the educator evaluation program be piloted in 8-10 sites across Connecticut. The Performance Evaluation Advisory Council (PEAC) came to an agreement that the new educator evaluation system would be implemented in all districts with flexibility in 2013-14, and the system would launch statewide with full implementation in 2014-15.

MY REPLY:

Even if one chose to accept that improved teacher evaluation systems and teacher effectiveness measures could be leveraged to better select among teachers on the labor market or in a particular district workforce, our ability to apply that leverage to improve the workforce as a whole, or achieve more equitable distribution of teaching quality would be constrained by a) the overall landscape of teacher compensation relative to other career alternatives and b)  the persistent inequities in financial resources across districts and resulting inequities teacher compensation across advantaged and disadvantaged schools and districts.

The suggestion that mandated changes to teacher evaluation alone will improve the equity and adequacy of the teacher workforce – regardless of resources – ignores that the proposed evaluation models have the potential to significantly increase job uncertainty for teachers without providing increased wages or benefits to counterbalance the risk. Increased job/career and wage expectation uncertainty, while holding wages on average, constant, is likely to lead to reduced, not increased quality of entrants to the profession.

Further, given the emerging body of evidence on the types of metrics proposed for teacher evaluation, career uncertainty is likely to be inequitably distributed, disadvantaging children in already disadvantaged districts and schools.[6]

NOTES


[1] Not accounted for here are potential differences in facilities operation & lease costs. It is often argued that the costs of facilities are particularly high for charter schools, consuming large shares of their budgets, while facilities are “free” for public districts. In reality, one can expect facilities leases for Connecticut charter schools to range from $1,500 per pupil to around $2,000 per pupil (which is indeed significant) and one can expect annual maintenance and operations (not including long term debt expense) for districts to be around $1,400 per pupil (in 2010 based on CTDOE Data).  The state’s choice to provide substantially increased funding for charter schools and not to host district schools was not based on any thorough analysis of actual differences in costs or needs.

[2] Figlio, D. N., & Lucas, M. E. (2004). Whats in a Grade? School Report Cards and the Housing Market. The American Economic Review, 94(3), 591-604.

[6] Baker, B.D., Oluwole, J., Green, P.C. III (2013) The legal consequences of mandating high stakes decisions based on low quality information: Teacher evaluation in the race-to-the-top era. Education Policy Analysis Archives, 21(5). This article is part of EPAA/AAPE’s Special Issue on Value-Added: What America’s Policymakers Need to Know and Understand, Guest Edited by Dr. Audrey Amrein-Beardsley and Assistant Editors Dr. Clarin Collins, Dr. Sarah Polasky, and Ed Sloat. Retrieved [date], from http://epaa.asu.edu/ojs/article/view/1298

From Portfolios to Parasites: The Unfortunate Path(ology) of U.S. Charter School Policy

I recall several years ago attending an initial organizing meeting for a special interest group on Charter Schools at the American Educational Research Association. Note to outsiders – AERA has several special interest groups, some research oriented, some advocacy oriented…  many somewhere in between. These are member organized groups and many are very small. If I recall correctly, there were a handful of us at that meeting, including Gary Miron, Katy Bulkley and a few others. If memory serves me, I think Rick Hess may have paid a visit to the meeting to argue that this new group should really just be a part of the school choice special interest group. All of that aside, I and others attended this meeting out of our interest in studying this relatively new concept of charter schools. Most of us were intrigued by the possibilities of alternative governance structures that might provide opportunity for innovation (what might now be referred to a disruptive innovation).

I didn’t spend a whole lot of time researching charters in my first few years after that, but eventually I did start to explore charter schooling and teacher labor markets – specifically the recruitment/retention of teachers based on different academic backgrounds – specifically college selectivity. My perspective was that some creative, energetic leadership (which might now be referred to as Cage-busting leadership) that might be associated with a mission-driven start-up school, coupled with an ounce or two of deregulation, and applied in the right context, might provide opportunities to recruit an academically talented pool of teachers. Our research largely supported these assertions.

  • Baker, B. D., & Dickerson, J. L. (2006). Charter Schools, Teacher Labor Market Deregulation, and Teacher Quality Evidence From the Schools and Staffing Survey. Educational Policy, 20(5), 752-778.

In recent years, however, my perception is that this whole movement has gotten way out of control – it has morphed dramatically – especially the punditry and resultant public policy surrounding charter schooling. Sadly, I’m reaching a point where I now believe that the end result is causing more harm than good.  In my view, many charter schools, and certainly the political movement of charter schooling, are no-longer operating in the public interest. In fact, they have all the incentive in the world to do just the opposite, and there is little or no sign of this turning around any time soon.

We’ve shifted dramatically, and rather quickly from what some might refer to as a portfolio model, to what I would now characterize as a parasitic one.

Overarching Incentives & Chartery Miracles

Since the early phases of significant national charter expansion which coincided (somewhat) with early implementation of NCLB, chartery success has been reduced to a definition reminiscent of the cult of efficiency. Chartery success (accompanied by headlines, news magazine segments and visits from politicians) is largely defined as A) getting higher test scores or greater test score growth, B) for less money, and C) with the “same” kids. Because this is the supposed definition of success, punditry around charter schooling – and research designed to endorse this punditry – makes every effort to validate A, while obfuscating or completely misrepresenting B and/or C.

Figure 1. Chartery Miracle Success Framework

Slide1

The central objective in Chartery Miracle Punditry is to prove that average scores, and otherwise methodologically weak policy analyses show that charter students outperform their traditional public school counterparts.

These studies rarely if ever include any accurate measure of the resources used by charters, more often than not citing bogus, irrelevant studies or providing flimsy back of the napkin analysis.

These studies often use entirely insufficient measures for declaring students as being “matched” with peers between district and charter schools, fail to consider fully the role of peer effects as one of the largest school factors, or the intersection of selective attrition and peer effects.

In part, because it is increasingly well understood that this is the way the game is played, charter school operators have all the incentive in the world to play the game this way (even if they were otherwise predisposed not to). And apparently far too many charter operators are responsive to these incentives.

Competition for Demographic Advantage

This recent Reuters article by Stephanie Simon explains practices actually used by many charter operators, arguably in response to current incentives.

http://www.reuters.com/article/2013/02/15/us-usa-charters-admissions-idUSBRE91E0HF20130215

In short, charter schools are applying a variety of creative strategies to screen out those students they feel won’t help their numbers. In some/many cases, children will be screened out on the basis of otherwise unobservable characteristics. Two low income children wish to apply… but only one is sufficiently motivated to complete the 15 page entry essay. They are labeled as similar as one returns to the district school and one matriculates to the charter, but clearly there is at least some difference between them which may influence their future performance. But these mechanisms also serve to sort out poorer children from more disrupted households, more mobile families, and non-English speaking families. And clearly they send a signal to parents of children with disabilities that this may not be the school for you.

In many parts of the country, especially in areas where charter schools serve a larger share of total enrollment, charter schools do seem to serve more lower income students. And in states where there exists an incentive to serve children with disabilities, charters often do so (boutique special education charters). But these incentives get out of hand as well.

In affluent, economically diverse states like New Jersey, New York and Connecticut, as I commented in the Reuters article, my research (& related posts) shows substantial cream-skimming among charters.  Many of these findings are validated by others, as I explain in my reports/publications.  Here are a few figures on demographics of New York and Connecticut charter schools.

This figure on New York City Charter schools draws on data from a forthcoming article (related to a recent report). In this analysis, I use three years of data from 2008-10, and I estimate a regression equation for each demographic measure, comparing schools that serve the same grade level in the same borough of the city. The graph shows how much lower (or higher) the population share is in each charter school chain, relative to NYC district schools.

Figure 2. New York City Relative Demographics

Slide2

This next figure shows the demographics of Connecticut Charter Schools that are in high poverty cities. To construct this comparison, I combine CTDOE data with data from NCES Common Core. I sum the total number of public & charter school enrolled children by City (school location in CCD) and the total numbers of free lunch, ELL and special education enrolled children. Note that the special education concentrations are for only regular district (& charter) schools. Overall district rates of children with disabilities are marginally higher (because some are in special &/or private placements).

Table 1. Connecticut Charter Schools in High Poverty (<50% Free Lunch) Cities

Slide8

Let me make this absolutely clear. In a heterogeneous urban schooling environment, the more individual schools or groups of schools engage in behavior that cream skims off children who are less poor, less likely to face language barriers, far less likely to have a disability to begin with, and unlikely at all to have a severe disability, the higher the concentration of these children left behind in district schools.(see for example: https://schoolfinance101.wordpress.com/2012/08/06/effects-of-charter-enrollment-on-newark-district-enrollment/)

Indeed, as I’ve pointed out previously, districts create some similar (or even more extreme) segregation on their own through magnet schools, but under these circumstances, districts can (and should) regulate the extent of segregation – and specifically the extent to which high need children are left behind clustered in certain district schools. Certainly some urban districts do a very poor job at managing this balance.

But with independent charter expansion, districts lose the ability to even try to manage the balance. Sadly, what may initially have been conceived of as a symbiotic relationship between charter and district schools is increasingly becoming parasitic!

In a “competitive marketplace” of schooling within a geographic space, under this incentive structure, the goal is to be that school which most effectively cream skims – without regard for who you are leaving behind for district schools or other charters to serve – while best concealing the cream-skimming – and while ensuring lack of financial transparency for making legitimate resource comparisons.

This is precisely why the idea of replacing entirely urban public school systems with a portfolio of charters competing against one another with minimal centralized oversight, is a massively stupid [from a public policy perspective] idea.  That is, unless the overarching incentive structure were to change entirely. But I have little hope of that happening, and there seems to be little incentive for advocates of the extreme extension of charter madness to support altering the incentives.

There does seem to be some increased media and public awareness that many charter schools are indeed attempting to game their enrollments. Some charter (and chartering) advocates, including Mike Petrilli have capitulated on this point, but have suggested that this isn’t necessarily a bad thing. I might agree that with moderation, under the right controls, which requires some centralized governance/management, this may be partly true. But under current circumstances, it’s not.

[sidebar – one need only look at the geographic distribution of charters in New Orleans or Kansas City with respect to neighborhood income to see how such a system, under the current incentive structure, will fail to serve the neediest children]

Competition for Resources

The last frontier of deception in the charter debates seems to be over comparability of resources.  Few if any studies which praise charter successes make any legitimate attempt to measure resources. Ken Libby, Katy Wiley and I did our best to tease out resource comparability in NYC, Texas and Ohio. The fact that our report has so darn many pages (over 20) of appendices, footnotes, caveats and explanations regarding those comparisons is testament to the fact that policymakers (and the charter industry influencing them) seem to have little interest in improving transparency or comparability of charter school finances.

Lack of clear reporting, transparency and comparability permits the most vocal charter pundits to continue advancing utterly ridiculous arguments about their supposed massive, persistent resource disadvantage.

Thus, they (charter pundits) perpetuate the myth that charters everywhere and always are disadvantaged in terms of resources access – and specifically by the design of state funding systems.  Some indeed are, but others clearly are not. Thus, they position themselves to lobby fiercely for their supposed “fair share” of public resources. These arguments are most often anchored to the completely bogus Ball State/Public Impact study of charter school funding (see explanation of Bogosity here![1])

My recent report, and forthcoming article with expanded analyses, on New York City charter schools shows that most substantially outspend NYC BOE schools serving similar student populations and the same grade levels.  Figure 3 shows the scatterplot of middle schools by special education population share (where special education population is the strongest predictor of school site spending differences for NYC BOE schools).

Figure 3. Site Based Spending and % Special Education in NYC Middle Schools

Slide3

Figure 4 shows the elementary schools.

Figure 4. Site Based Spending and % Special Education in NYC Elementary Schools

Slide4

Figure 5 shows the total expenditures per pupil for Connecticut district and Charter schools. It would appear from Figure 5 that charter schools are getting the short end of the stick? Right? Especially those high flying charters like Amistad and Achievement First in Bridgeport? The problem with this comparison is that it is the host districts that are responsible for financing transportation costs, and ultimately responsible for serving children with disabilities (including/especially severe disabilities) and the expenditures for transportation and special education (including transportation of charter students) are reported on district expenditures.

Figure 5. Total Expenditures per Pupil for Connecticut District & Charter Schools

Slide9

When we pull out transportation and special education spending the picture changes quite substantially as shown in Figure 6. The charter schools are doing reasonable well in comparable expenditures per pupil – setting aside lengthy discussion of chartery misrepresentations of comparisons of facilities costs (the classic charter reactionary argument being that charters in a state like CT spend about $1700 per pupil on facilities, whereas district facilities are supposedly “free.” Even if that was the case, many CT charters would still be ahead. But, district facilities also come with maintenance costs and long term debt payments [which yes, are expenditures] that while not equaling charter lease payments as a share of operating expense, they do close the supposed gap quite substantially – see lengthy note below).

Figure 6. Comparable Expenditures per Pupil for Connecticut District & Charter Schools

Slide10

Collateral Damage of the Parasitic Chartering Model

In previous posts I showed how the population cream-skimming effect necessarily leads to an increasingly disadvantaged student population left behind in district schools. High need, urban districts that are hosts to increasing shares of cream-skimming charters become increasingly disadvantaged over time in terms of the students they must serve.

It would be one thing if state policies were in some way trying to intervene to scale up district resources to mitigate this damage. It would be one thing if we could count on charter advocates/pundits to support public policy that would help local districts deal with these (intended) consequences.

But again, the overarching incentives do not favor such advocacy. Resources are finite, and in the never ending quest to “win” the chartery success wars, it is in the interest of charter advocates to do whatever they can to get the largest share of the resources, and not care so much whether district schools get anything. In fact, it’s easier to win if they don’t.

I was not initially so cynical as to believe that charter advocates would seemingly endorse persistent deprivation of needy traditional districts in their own effort to garner more resources, and “win”. But, increasingly, it seems they are. At the very least, they want what they perceive to be their share, regardless of consequences for district schools. We see this in the persistent drive for access to facilities in New York City, subtle shifts in charter vs. district subsidy rates that appear to advantage the charters (see IBO reports) and the continued flood of philanthropy.

Meanwhile, what is the status of funding for high need districts in New York State? Well, Table 2 summarizes the current degrees of underfunding of New York State’s school finance formula.

Several high need districts are “underfunded” on the state’s own formula by thousands per pupil, including New York City. And where is the outcry from charter advocates that their hosts are being underfunded?

Table 2. Underfunding of New York State’s foundation formula

Slide12

Districts are starting to get fed up. But they still seem to lack the sex appeal (or bank accounts) and media access of leading charter advocates.

Yet, we don’t hear the cry from charter advocates to support the formula. Doing so might actually increase the pass through funds to charters. But, well endowed charters can offset whatever losses they might face by an underfunded formula… and be that much more likely to “win!” Is that really in the public interest? When is the last time you heard a charter advocate argue for fully funded the state aid formula (as opposed to mandating specifically an increase to their allotment of it).

Connecticut provides a similar case of collateral damage. Figure 7 shows the per pupil increases in the Education Cost Sharing formula adopted for the current year, over prior year spending levels. In short, it ain’t much! Okay… it’s actually next to nothing. Persistent inequities exist between higher and lower need districts, and for that matter, among higher need districts (notably, Hartford and New Haven spending in this graph are distorted by magnet school aid, some of which is spent on kids from other districts).

In the same year, the CT legislature did manage to more significantly increase charter school funding (on the order of $2k per pupil), despite the fact that many charter schools were both serving lower need student populations and already spending more per pupil on a comparative basis than their host districts. Why? Well, first of all, it’s a lot cheaper – takes much less total funding increase – to increase funding for just charter kids. Second, that’s where the current punditry is – with charter advocates successfully conveying their (false) message of severe fiscal disadvantage. Pauvre, Pauvre Charter Schools?

Meanwhile, charters like Achievement First in Bridgeport seem more than happy to take their windfall and allow their “competition” (Bridgeport Public Schools) to languish.  It is indeed easier to win that way. And that seems to be what it’s all about.

Figure 7. 2012-13 increases to District Funding in Connecticut

Slide11

Closing Thoughts

It’s quite sad that we’ve reached this stage. As I envisioned it from the outset (or early on, around the late 1990s), it wasn’t supposed to turn out this way. It would, in theory be possible to establish an avenue for creative experimentation, increased flexibility – for appropriately moderated disruptive innovation and cagebusting leadership. It might even all fit into a portfolio model. Yeah… we could use all of the reformy language to describe what might have been a far more reasonable, thoughtful extension of chartering.

But alas, the potential for charters to contribute positively to the public good, in my view, has been severely compromised in part by the ill conceived incentive framework policymakers and pundits have wrapped around the concept of chartering.  Unfortunately, for the foreseeable future it is all too convenient for them to perpetuate this faulty incentive system. Yeah… the public is catching on, and eventually this too shall pass. The only question is just how much damage will have been done before we turn the corner.

[final side bar: Among the damages not discussed herein, but discussed in a previous post, are the increasing shares of students, primarily in urban districts serving low income children and minorities that will be forced to forgo constitutional rights and statutory protections that would be available to them in true public schools, in order to gain access to the only available charter schools. Sadly, many charters have chosen as one method to improve their chance of winning, discipline policies & requirements that would be impermissible in “public” schools (in legalize “state actors”)].

Notes:

[1] Footnote #22  from: http://nepc.colorado.edu/files/rb-charterspending_0.pdf

A study frequently cited by charter advocates, authored by researchers from Ball State University and Public Impact, compared the charter versus traditional public school funding deficits across states, rating states by the extent that they under-subsidize charter schools. The authors identify no state or city where charter schools are fully, equitably funded.

But simple direct comparisons between subsidies for charter schools and public districts can be misleading because public districts may still retain some responsibility for expenditures associated with charters that fall within their district boundaries or that serve students from their district. For example, under many state charter laws, host districts or sending districts retain responsibility for providing transportation services, subsidizing food services, or providing funding for special education services. Revenues provided to host districts to provide these services may show up on host district financial reports, and if the service is financed directly by the host district, the expenditure will also be incurred by the host, not the charter, even though the services are received by charter students.

Drawing simple direct comparisons thus can result in a compounded error: Host districts are credited with an expense on children attending charter schools, but children attending charter schools are not credited to the district enrollment. In a per-pupil spending calculation for the host districts, this may lead to inflating the numerator (district expenditures) while deflating the denominator (pupils served), thus significantly inflating the district’s per pupil spending. Concurrently, the charter expenditure is deflated.

Correct budgeting would reverse those two entries, essentially subtracting the expense from the budget calculated for the district, while adding the in-kind funding to the charter school calculation. Further, in districts like New York City, the city Department of Education incurs the expense for providing facilities to several charters. That is, the City’s budget, not the charter budgets, incur another expense that serves only charter students. The Ball State/Public Impact study errs egregiously on all fronts, assuming in each and every case that the revenue reported by charter schools versus traditional public schools provides the same range of services and provides those services exclusively for the students in that sector (district or charter).

Charter advocates often argue that charters are most disadvantaged in financial comparisons because charters must often incur from their annual operating expenses, the expenses associated with leasing facilities space. Indeed it is true that charters are not afforded the ability to levy taxes to carry public debt to finance construction of facilities. But it is incorrect to assume when comparing expenditures that for traditional public schools, facilities are already paid for and have no associated costs, while charter schools must bear the burden of leasing at market rates – essentially and “all versus nothing” comparison. First, public districts do have ongoing maintenance and operations costs of facilities as well as payments on debt incurred for capital investment, including new construction and renovation. Second, charter schools finance their facilities by a variety of mechanisms, with many in New York City operating in space provided by the city, many charters nationwide operating in space fully financed with private philanthropy, and many holding lease agreements for privately or publicly owned facilities.

New York City is not alone it its choice to provide full facilities support for some charter school operators (http://www.thenotebook.org/blog/124517/district-cant-say-how-many-millions-its-spending-renaissance-charters). Thus, the common characterization that charter schools front 100% of facilities costs from operating budgets, with no public subsidy, and traditional public school facilities are “free” of any costs, is wrong in nearly every case, and in some cases there exists no facilities cost disadvantage whatsoever for charter operators. Baker and Ferris (2011) point out that while the Ball State/Public Impact Study claims that charter schools in New York State are severely underfunded, the New York City Independent Budget Office (IBO), in more refined analysis focusing only on New York City charters (the majority of charters in the State), points out that charter schools housed within Board of Education facilities are comparably subsidized when compared with traditional public schools (2008-09). In revised analyses, the IBO found that co-located charters (in 2009-10) actually received more than city public schools, while charters housed in private space continued to receive less (after discounting occupancy costs). That is, the funding picture around facilities is more nuanced that is often suggested.

Batdorff, M., Maloney, L., May, J., Doyle, D., & Hassel, B. (2010). Charter School Funding: Inequity Persists. Muncie, IN: Ball State University.

NYC Independent Budget Office (2010, February). Comparing the Level of Public Support: Charter Schools versus Traditional Public Schools. New York: Author, 1.

NYC Independent Budget Office (2011). Charter Schools Housed in the City’s School Buildings get More Public Funding per Student than Traditional Public Schools. New York: Author. Retrieved April 24, 2012, from http://ibo.nyc.ny.us/cgi-park/?p=272.

NYC Independent Budget Office (2011). Comparison of Funding Traditional Schools vs. Charter Schools: Supplement. New York: Author .Retrieved April 24, 2012, from http://www.ibo.nyc.ny.us/iboreports/chartersupplement.pdf.

Note: The average “capital outlay” expenditure of public school districts in 2008-09 was over $2,000 per pupil in New York State, nearly $2,000 per pupil in Texas and about $1,400 per pupil in Ohio. Based on enrollment weighted averages generated from the U.S. Census Bureau’s Fiscal Survey of Local Governments, Elementary and Secondary School Finances 2008-09 (variable tcapout): http://www2.census.gov/govs/school/elsec09t.xls

Real Reform versus Fake Reformy Distractions: More Implications from NJ & MA for CT!

Recently, I responded to an absurd and downright disturbing Op-Ed by a Connecticut education reform organization that claimed that Connecticut needed to move quickly to adopt teacher evaluation/tenure reforms and expand charter schooling because a) Connecticut has a larger achievement gap and lower outcomes for low income students than Massachusetts or New Jersey and b) New Jersey and Massachusetts were somehow outpacing Connecticut in adopting new reformy policies regarding teacher evaluation. Now, the latter assertion is questionable enough to begin with, but the most questionable assertion was that any recent policy changes that may have occurred in New Jersey or Massachusetts explain why low income children in those states do better, and have done better at a faster rate than low income kids in Connecticut. Put simply, bills presently on the table, or legislation and regulations adopted and not yet phased in do not explain the gains in student outcomes of the past 20 years.

Note that I stick to comparisons among these states because income related achievement gaps are most comparable among them (that is, the characteristics of the populations that fall above and below the income thresholds for free/reduced lunch are relatively comparable among these states, but not so much to states in other regions of the country).

I’m not really providing much new information in this post, but I am elaborating on my previous point about the potential relevance of funding equity – school finance – reforms – and providing additional illustrations.

First, let’s take a look at the relationship between state and local revenues per pupil and median household income over time in Mass, CT, RI and NJ. These data are drawn from an article I published in 2010 in which I estimated a model for all states of the relationship between median household income and state and local revenue per pupil over time. In that recent article, I plotted the relationship over time for several states. Here, I have re-plotted that relationship for New Jersey, Massachusetts, Connecticut and Rhode Island.

This graph shows the slope of the statistical relationship between state and local revenues per pupil and median household income, controlling for differences in regional labor costs and economies of scale of districts. All 4 states managed to reduce or eliminate what had been positive relationships between household income and district revenues. That is, in 1990, in each state higher income districts had more revenue. By the late 1990s, Mass and NJ had reversed that pattern, and in fact had redistributed revenue such that districts with lower median household income actually had more revenue. The finance systems had become “progressive,” so-to-speak.

By contrast, the relationship between income and revenue remained more random – and on average flat – in RI and CT.  How Connecticut made so little consistent progress toward fiscal equity over time is another story for another day.

By 2009, things were pretty much the same, as the next figure shows. The next figure compares current operating expenditures per pupil and district poverty rates. Current operating expenditures include expenditure of federal funds, including Title I funds. Those federal funds tend to add marginally to the progressiveness of the system. But, what’s also important is not just whether the trendline tilts upward, but whether the pattern is systematic or predictable. In New Jersey, among districts enrolling 2,000 or more students (scale efficient), census poverty rates alone explain 47% of the variation in current spending. It’s a predictable, upward slope whereby higher poverty districts actually have and spend more per pupil. In Massachusetts, poverty explains nearly 40% of the variation in spending per pupil.

But, by contrast, in Connecticut, poverty explains only about 15% of the variation in spending across districts. Notably, a handful of high poverty districts including Bridgeport, Waterbury and New Britain have been left well behind… well below  the curve.  Further, even though Hartford and New Have have more funding, much of that funding has been channeled through a magnet school aid program, so the seemingly high position of these two districts is somewhat deceptive, and not part of any systematic effort to improve equity.

I’m doing some picking on CT here in particular, because CT has hardly provided systematic targeted support to high need districts. That said, CT is hardly the worst offender among states. Several states do far worse than CT, including PA, NY and IL in particular.  But that’s a post for another day. Those states are not sufficiently comparable in other ways to include in these comparisons. Our report on School Funding Fairness provides a full breakdown across states (www.schoolfundingfairness.org).

In the best possible case, CT has selectively targeted funding to some high need districts and has left out others. Rhode Island funding is somewhat more predictable (though deceptive because of the small number of districts) than CT but clearly less systematic than NJ or Mass.

Now, here are the longitudinal trends in student outcomes in these states, cut a few different ways and focusing on disadvantaged children. First, because I’m not a fan of comparing “low income” kids to “low income” kids even across these relatively similar economies, I take a look at children of mothers who were high school dropouts, and 8th grade math performance:

From 2000 forward (where the scores are relatively comparable over time), children of maternal high school dropouts in Mass and NJ far outpace those in CT or RI.

Next, here are the trends for children who qualify for free lunch, also on 8th grade math:

Finally, here are the trends for 4th grade reading:

In each case, low income kids in the two states that have more aggressively pursued funding equity reforms outperform and have improved their performance faster than low income kids in states that have not.

While these trends are hardly conclusive evidence [more extensive analysis is underway] of a link between the funding shifts and outcome gains, these trends are consistent with a significant body of research on the effects of school finance reforms, which I summarize in these articles/papers:

  1. http://www.tcrecord.org/library/abstract.asp?ContentId=16106
  2. http://www.shankerinstitute.org/images/doesmoneymatter_final.pdf

These illustrations coupled with the larger body of related research present a more compelling case for improving funding equity and adequacy than the case that has been presented thus far for other reforms – reforms which lack both any significant research base OR other compelling evidence.

Simply arguing that teacher quality varies – good teachers matter – and that we have to “fix” teacher quality says nothing of how to actually improve teacher quality or the resources required to get the job done. “Teacher quality” is not a policy.

Notably, the CT Education reform group that posted the original absurd claims later softened their arguments regarding the causes of Connecticut’s failures and Mass and NJ’s successes. But somehow, they still found it in them to pitch the same policy solutions. Yes, solutions that had nothing to do with why Mass and NJ were outperforming CT. If the original argument doesn’t hold, then neither do the proposed solutions! That’s how dumb this debate has gotten!

Let’s be absolutely clear here – During the years over which Mass and NJ saw these substantial improvements in outcomes, both states had teacher tenure systems – in both successful and less successful schools! Both states had rather traditional teacher evaluation policies in place. Both states had relatively small overall shares of children attending charter schools. Massachusetts has received some accolades for its accountability system adopted concurrent with funding reforms.

Even if the path to improved productivity and efficiency did involve reforms with any resemblance to the teacher evaluation or charter school reforms on the table, equitable and adequate financing would be a prerequisite condition for doing any of it well. Real innovation requires real investment.

Notably, the types of innovations adopted by those few charter chains which show relatively consistent records of success are rather mundane strategies which involve providing more time and intensive supplemental tutoring, typically at a substantially greater per pupil cost – much of it reflected in higher teacher salaries to support the additional time and responsibilities.   Yes, even in Connecticut those higher flying charters, while serving far less needy student populations than other schools in their host districts, are also outspending them! (and pay teachers more!)

We also have pretty good evidence from research that salaries matter (see page 7-)– that the average level of teacher salaries affects the quality of entrants to the profession – and that the relative salary paid in one district versus another may affect teacher job choice – leading to sorting of teacher credentials across districts.

By contrast we have little evidence that mass deselection of teachers on the basis of noisy and potentially biased measures of student achievement growth – without counterbalancing the risk with substantial additional reward would have any benefit whatsoever [outside of self-fulfilling simulated correlations] – and it might, in fact, do significant harm! We also have a pretty solid track record of studies suggesting few or no benefits of attaching compensation to similar performance metrics (e.g. merit pay).[1] Yet the reformy rhetoric advancing these policies through copy-and-paste template legislation persists! Is anyone taking even a brief time out to think and evaluate these proposals?

Even if we didn’t have all of this evidence for how and why money matters, wouldn’t it make sense on its face to provide schools and districts a level playing field? What possible argument is there for deciding to completely overlook substantial financial inequities in favor of policy options which, to implement properly (if that’s even possible), require equitable financial resources. Yes, real reform costs money.  Good schools cost money!

If reformy advocates really don’t believe that money has anything to do with improving schooling quality, then why do charter advocates in Connecticut (and elsewhere) push so hard for substantial increases in funding ($2,600 per pupil in CT)? Yet the underfunded high need districts stand to gain far, far less under current proposals (only about $250 per pupil). Funding those districts appropriately comes with a higher price tag than increasing charter funding because they serve a lot more students and far more needy students than CT charters. The persistent inequities faced by these districts are glaring… right down to the delivery of basic curricular options, especially in the neediest, least well resourced districts. Larger class sizesAdvanced and enriched curricular optionsTeacher SalariesConcentration of novice teachers.

These are the real differences between well resourced, high performing and poorly resourced, low performing districts in Connecticut.  Both groups of districts pay teachers based on degrees and experience. Both sets of districts have tenure systems. I suspect that both sets of districts do little systematically different regarding teacher evaluation (which might be improved, but not by some ill-conceived state legislation).  So clearly none of that stuff has much of anything to do with which districts are succeeding and which are not ! The districts are substantively  different in terms of who they serve, and in terms of the resources (by the measures noted above) they have to serve them!

I’ve long argued that it seems rather hypocritical to hear staunch charter advocates argue that more money wouldn’t help traditional public schools, and then those same charter advocates set out to help their favored charters substantially outspend the nearby public schools (meanwhile, invariably serving less needy, less costly children to educate).

If money has nothing to do with improving schooling quality – or providing high quality schooling – then why is the average tuition of private independent day schools in Connecticut typically well above (around $25k elem, up to $35k HS) current spending levels of nearby public districts (where tuition covers only a portion of current spending).[2] Money – and what it buys – clearly means something to the consumers of what I might call luxury schooling.  Nationally, private independent schools spend on average 1.96 times average spending of public districts in their same labor market. [3] Meanwhile, these schools DO NOT generally fire teachers at will. They do typically pay based largely on seniority and degree level. What do they do? Well, for one thing, they provide small class sizes [whether that’s the most efficient allocation or not is a separate question, but that is what they choose to do… and what they often advertise]!

It is about the money. Even/especially those disingenuous arguments that it’s NOT about money? Those arguments perhaps, are the ones that most clearly indicate that it IS about money – and a complete unwillingness to acknowledge the importance of money to anyone else but one’s self. Strangely, we’ve reached a point in the discourse where it’s all about finding any rationale we can to NOT give money to the schools and districts that need it most while continuing to blame them, their teachers and the children they serve for the persistent cycle of poor performance – and where we define their performance as poor by comparison to their more advantaged and better resourced peers! Isn’t anyone else seeing the absurdity?[4] [starve them… shift money away from them… then blame them for doing even worse?]

Clearly the media isn’t catching it. I’m less frustrated by the absurdity of these arguments (I rather expect it in the political sphere) than the fact that the media is either complicit in advancing the silliness, or intellectually incapable of seeing through it.

Those who continue to ignore outright the role of money in schooling in favor of reformy window dressing – meanwhile leveraging every opportunity to access a greater share of the federal, state and local tax dollar, present a laughable case for their preferred reforms.  But for some reason, I’m finding it really hard to laugh.

=======

[1]Glazerman, S., Seifullah, A. (2010) An Evaluation of the Teacher Advancement Program in Chicago: Year Two Impact Report. Mathematica Policy Research Institute. 6319-520
Springer, M.G., Ballou, D., Hamilton, L., Le, V., Lockwood, J.R., McCaffrey, D., Pepper, M., and Stecher, B. (2010). Teacher Pay for Performance: Experimental Evidence from the Project on Incentives in Teaching. Nashville, TN: National Center on Performance Incentives at Vanderbilt University.
Marsh, J. A., Springer, M. G., McCaffrey, D. F., Yuan, K., Epstein, S., Koppich, J., Kalra, N., DiMartino, C., & Peng, A. (2011). A Big Apple for Educators: New York City’s Experiment with Schoolwide Performance Bonuses. Final Evaluation Report. RAND Corporation & Vanderbilt University.  http://www.americanprogress.org/issues/2011/04/pdf/class_size.pdf

[2] http://www.brunswickschool.org/admissions/fees-financial-aid/, http://www.chasecollegiate.org/page.cfm?p=208, http://www.fairfieldprep.org/page.cfm?p=24, http://www.greenwichacademy.org/podium/default.aspx?t=32259, http://www.klht.org/podium/default.aspx?t=2170, http://www.stanwichschool.org/admissions/tuition.asp, http://woosterschool.org/admissions/tuition-fees

[3] Baker, B. (2009). Private schooling in the U.S.: Expenditures, supply, and policy implications.
Boulder and Tempe: Education and the Public Interest Center & Education Policy Research
Unit. Retrieved [date] from http://epicpolicy.org/publication/private-schooling-US

[4] An argument taken to its extremes in a recent NJDOE report: https://schoolfinance101.wordpress.com/2012/02/24/how-not-to-fix-the-new-jersey-achievement-gap/

Follow up on Reformy Logic in Connecticut

A few days ago, I responded to an utterly silly CT Ed Reform op-ed which argued that poverty doesn’t really matter so much, nor does funding (by omission), and that Massachusetts and New Jersey do better than Connecticut on behalf low income kids because they’ve adopted accountability and teacher evaluation reforms in the past few years. Thus, the answer is for Connecticut to follow suit by adopting SB 24 in its original form. To be clear, NJ has absolutely not adopted anything like SB 24.  Here’s a key section of that op-ed:

We think folks would be hard-pressed to argue that low-income students right over the border in Massachusetts or New Jersey face very different circumstances at home than the low-income students in Connecticut.  So, what actions have our neighboring states taken to address their achievement gaps that Connecticut hasn’t?  Put bluntly, they have adopted education reform policies very similar to the ones proposed in Governor Malloy’s original education reform bill.  They have adopted or implemented policies that evaluate teachers on the basis of student performance, that rank schools and districts within a tiered intervention framework, and that provide the Commissioner with the authority to intervene in the lowest performing schools and districts.

In my previous post, I already pointed out a few simple realities… like the fact that both Massachusetts and New Jersey have systematically tackled school funding equity over time, where Connecticut has not. I also suggested that it might be rather foolish to argue that policies considered and/or adopted but not even really implemented yet were the cause of improvements to New Jersey and Massachusetts low income student progress.

So, here’s just one more graph to drive home that point:

http://nces.ed.gov/nationsreportcard/naepdata/dataset.aspx

Yes – Mass and NJ do better than CT, across all student groups, including lower income students. And yes, Mass and NJ have shown higher rates of growth in student outcomes, across all student groups. And you know what, much if not most of that growth has occurred prior to considering, piloting and partially implementing new policies.

So… to put it really simply… it’s pretty darn unlikely that Mass and NJ do better than CT because of recent policy developments.

Further, across all three states, poverty continues to matter.

Children who do not qualify for either free or reduced lunch outperform those who do.

Children who qualify for reduced lunch (185% poverty income level) outperform those who qualify for free lunch (130% poverty income level).

Notably, children qualifying for free lunch in Massachusetts have surpassed those qualified for reduced lunch in CT and those qualified for free lunch in NJ are catching up with those qualified for reduced lunch in CT.

In fact, gaps in the other two states remain relatively large as well because of the growth in outcomes of higher income students which has largely paralleled the growth among lower income students.

Baseless Reformy Thoughts from Connecticut (& How this year’s reforms improved decades of past performance!?)

This utterly absurd post appeared yesterday on the CT Ed Reform blog:

http://ctedreform.org/blog/2012/04/poverty-is-not-to-blame-ct%E2%80%99s-low-income-students-rank-48th-in-the-nation-while-ma%E2%80%99s-rank-2nd/

Essentially, the argument goes:

  1. CT’s achievement gap is worse than achievement gaps in states like Massachusetts and New Jersey and in particular, CT’s low income students perform less well than low income students in those states.
  2. Massachusetts has recently adopted reforms to teacher evaluation, which is obviously why Massachusetts has a smaller achievement gap and better performance among low income students. (the post cites New Jersey as well)
  3. THEREFORE, WE KNOW THAT POVERTY IS NOT THE ISSUE…. IT’S TEACHER EVALUATION (and Charter schools, and other reformy stuff)!
  4. Therefore, the solution is to pass SB24 in its original form, which includes such fun things as student test based evaluation of teachers (3 good years to tenure, 2 bad and you’re out), additional funding for and expansion of charter schools – which we know can overcome this pesky poverty distraction!

Now, before I even begin here, I found it most absurd that this particular Ed Reform posting attributed progress made in Massachusetts over the past two decades, to policies adopted in the past two years! As they put it:

We think folks would be hard-pressed to argue that low-income students right over the border in Massachusetts or New Jersey face very different circumstances at home than the low-income students in Connecticut.  So, what actions have our neighboring states taken to address their achievement gaps that Connecticut hasn’t?  Put bluntly, they have adopted education reform policies very similar to the ones proposed in Governor Malloy’s original education reform bill.  They have adopted or implemented policies that evaluate teachers on the basis of student performance, that rank schools and districts within a tiered intervention framework, and that provide the Commissioner with the authority to intervene in the lowest performing schools and districts.

That’s just funny! Ridiculous in fact, making me wonder if this really was just an April fool’s joke.   Let’s make this really plain and simple.

Policies adopted in Massachusetts in the past two years and not yet even fully implemented did not cause low income children in Massachusetts to outperform low income children in Connecticut between 1992 and 2009!

And about New Jersey, I’m not quite sure what policies (legislation) they are talking about, since legislation regarding teacher evaluation is still in its early incubation stages. Pilot studies have begun in a handful of districts but  to suggest that pilot studies being implemented and evaluated now somehow explain past performance of low income students in New Jersey is, well, just dumb.

Now, Massachusetts and New Jersey have in fact implemented reforms that Connecticut has not – SCHOOL FINANCE REFORMS (in Mass, coupled with accountability reforms in the 1990s). Both states have more systematically targeted funding to higher need districts. And for a review of the literature on the effects of such school finance reforms, with specific references to New Jersey and Massachusetts, see:

  1. http://www.tcrecord.org/library/abstract.asp?ContentId=16106
  2. http://www.shankerinstitute.org/images/doesmoneymatter_final.pdf

While Connecticut has selectively driven magnet aid to Hartford and New Haven, Connecticut has left other high need districts out entirely. Further, in recent years, as shown in a previous post, Connecticut charter schools have substantively segregated students by income within Hartford, New Haven and Bridgeport.

Here’s a quick snapshot, using 2009 data, of the relationship between current spending per pupil and U.S. Census poverty rates for districts enrolling over 2,000 pupil within New Jersey, Massachusetts and Connecticut. The notable feature of these graphs, indicated by the r-squared value is that in both Massachusetts and New Jersey, current spending per pupil is far more predictably a function of differences in local district poverty rates (adjusted for regional cost variation). In New Jersey and Massachusetts, poverty variation explains more than a third, to nearly half the variation in per pupil spending, and in Connecticut, less than 1/6!

Financial data: http://www.census.gov/govs/school/

Poverty data: http://www.census.gov/did/www/saipe/data/schools/data/index.html

Now, on to other issues: That achievement gap!

Yes, Connecticut does have a relatively large achievement gap, but that gap has to be put in context with similar states, as I explain here. The short version of this story is that the low income- non-low income achievement gaps across states are largely a function of the income gaps between the two groups. Here’s my graph of that relationship:

In the upper right hand corner of this graph are the states with both large income gaps between poor and non-poor kids and with large achievement gaps between them. Yes, Connecticut’s gaps are larger than those of Mass or New Jersey, and those are perhaps the most relevant comparison states (the post got that right – but that’s about all).

We know the correlates of student achievement across CT schools: Poverty!

As it turns out, across these three states, in each case, lower income students perform less well on NAEP. Children qualified for reduced lunch perform less well than those not qualified for subsidized meals at all, and children qualified for free lunch perform less well than those who qualify for reduced price lunch. That’s why, in some cases, I choose t parse these populations in comparisons where most schools serve children below the upper threshold.

Data source: http://nces.ed.gov/nationsreportcard/naepdata/dataset.aspx

Data source: http://nces.ed.gov/nationsreportcard/naepdata/dataset.aspx

It also turns out that if we just go nutty with lots of different measures across Connecticut districts to identify those factors that are most highly correlated with student achievement measures (all data can be found here: http://sdeportal.ct.gov/Cedar/WEB/ct_report/DTHome.aspx & http://www.nces.ed.gov/ccd/bat) we find that various measures of poverty or household income are pretty darn highly associated with student outcome measures! This would seem to suggest that perhaps poverty and measures related to it do likely matter in some way. We’re talking about correlations near and above .80 here between % free/reduced and CMT scores across districts!

We know which districts have greater needs, by various measures!

The reality is that by any number of measures of income or poverty, we know which Connecticut districts have greater student needs, low income and in many cases more children with Limited English Language proficiency.  Here are the scatterplots of the relationships between poverty, income and ELL measures used in the above correlation analysis.

Yep. It’s all pretty straightforward. Various measures of income and poverty are pretty highly related across Connecticut. It’s a highly socioeconomically and racially segregated state. And student outcome measures remain highly correlated with socio-economic measures and with racial composition of school districts!

Malloy’s plan does little or nothing to help them financially

We also know from my previous posts that the Malloy plan does little or nothing to infuse additional resources into the highest need districts. Here it is again!

Additional data sources suggest that CT charters serve fewer needy kids and spend more per pupil than surrounding district schools

But, the Malloy plan does include substantial boost in funding for charter schools which I have shown in previous posts, tend to serve the less needy kids within the highest need settings in the state.  Further, I have shown in those earlier posts that Connecticut charter schools don’t appear to be systematically financially disadvantaged when compared to traditional public schools.

I recalled the other day that the new U.S. Department of Education school site data set released a short while ago includes per pupil spending figures for charter schools in some states. Among those states is Connecticut. The report and data also include information on shares of children by school who are low income.

Here are a few quick snapshots of how Connecticut charter schools in Hartford, New Haven and Bridgeport compare in terms of spending and poverty to “regular” public schools in each of those host districts.

First, without charter names:

Data source: http://www2.ed.gov/about/offices/list/opepd/ppss/reports.html#comparability-state-local-expenditures

[Note that the data set has the variable labeled as “school poverty rate” when in fact it is, I believe, a % free or reduced lunch measure. I’ve left the data label as it is in the original data set]

Now, with the names:

Data source: http://www2.ed.gov/about/offices/list/opepd/ppss/reports.html#comparability-state-local-expenditures

[Note that the data set has the variable labeled as “school poverty rate” when in fact it is, I believe, a % free or reduced lunch measure. I’ve left the data label as it is in the original data set]

A few things are notable here.

First, overall, there’s simply no upward tilt in per pupil spending by school poverty rate. That said, I’m only looking here within higher poverty settings (with the trendline determined by the regular public schools only).  In other words, higher poverty schools don’t generally have more resources per pupil than lower poverty ones within these cities, but my experience with similar data in other settings indicates that these variations are most often explained by the distribution of children with disabilities (also scarce in CT charters).

Second, as I illustrated in my previous post, the charter schools in these cities stand out in terms of the populations they serve (by low income status). New Haven schools have somewhat of a spread of low income rates, but Hartford and Bridgeport are all crunched up against the 100% mark (not all at 100% though, and with some more spread when I use free lunch only). In each case, charter % low income is lower than most regular schools in the host district.

Third, consistent with my previous analysis (but likely because the state reported the data to USDOE), many (more than not & all Achievement 1st schools) charter schools appear to be spending not only more than schools serving similar student populations (by income status), of which there are very few in these settings, but also more than district schools serving much lower income student populations.

These data certainly  raise questions about the validity of the current policy push in Connecticut and raise even more questions about the stated reasons for that push. That is, to the extent that anyone truly believes the absurd rhetoric that test-based teacher evaluation policies and expanding higher spending lower poverty charter schools are the solution to Connecticut’s achievement gap.

A Few Additional CT Charter Figures

I was admittedly in a bit of a rush the other day to pull together some figures on CT charter schools based largely on data I had previously compiled, some of which only included Achievement First charter schools.  Here, I include all charter schools in Hartford, New Haven and Bridgeport, and address only the % Free Lunch numbers using the most recent available data from the NCES Common Core of Data, which are from 2009-10.  A few quick points are in order.

First, this is not “old” data per se. It is one year lagged from the  most recent official state data (2010-11). Current year (2011-12) data would not be appropriate for use until the close of the year. Thus 2010-11 would be the most recent complete data, if available. Also, these types of data tend to be relatively stable over time. They don’t shift much over a 2 year period, but I’ll keep updating as complete end of year data become available. The burden of reporting accuracy falls on the schools and districts.

Second, this is not a “study.” A study, so to speak, in my view, requires far more extensive analysis than this. And yes, this is a topic on which I have conducted those more extensive analyses (though not specifically involving CT charter schools). This is a blog, and in this blog post and in the previous blog post on CT Charter schools I have merely rendered graphs of the existing data as reported by the schools. There’s no data editing involved, and no tricky statistical analyses ( like the regression model of wages in my CT teacher post – which come from previous work). It’s just graphs. Then why bother? Well, I bother because much of what I see in the ongoing debate over CT charter schools (and charters in some other locations) is guided by misinformation, or at least misconceptions (of charters beating the odds with the “same” students – proving poverty doesn’t matter! nor does money?).  Misinformation that is easily enough correctable with a simple graph or two, or map, or even table of the numbers. Hey… all of these numbers are available to each and every one of you. I’ve provided posts in the past where I explain how to get them and how to summarize and graph them.  I wish someone else would save me the time, and go make their own graphs, or at least present and discuss the existing data to provide relevant context for current policy discussions. But alas, I’ve not seen that happening (though a few individuals have jumped into the game). Thus, I stick my nose, uninvited into another state’s business once again.

All of that said, here are a few more graphs:

The upshot of these graphs is that it would certainly be unfair to criticize Achievement First specifically for serving fewer low income children than district schools in these major cities. In fact, in both New Haven and Hartford, the Achievement First charters have the higher low income concentrations among the charters, and in Bridgeport they are not the lowest.

It is also important to understand that districts have to a large extent self-induced economic segregation through their own magnet school programs. I’ve addressed the same issue regarding Newark, NJ in the past. So, economic segregation within these cities is not entirely driven by the presence of charters but rather by the complex mix of district traditional and magnet schools coupled with the introduction and expansion of charters.


SB24 won’t solve CT’s real Teacher Equity Problems

Connecticut’s SB 24 appears to be little more than boilerplate reformy legislation which, like similar legislation in other states, creates a massive smokescreen concealing the very real problems facing Connecticut school districts. I addressed in a previous post my concern that SB24’s emphasis on charter expansion as a solution for high poverty districts is misguided, mainly because most of those successful charter schools in CT are currently achieving their successes at least in part by NOT serving high poverty populations. And another part may be the additional resources of these schools, used for such things as increased school time, supported by increased teacher salaries.  But SB24 comes with few resources attached. The other major elements of SB24 involve teacher “effectiveness” with significant emphasis on use of student performance measures for teacher evaluation. For numerous posts on this topic, see: https://schoolfinance101.wordpress.com/category/race-to-the-top/value-added-teacher-evaluation/

A few points are in order before I move on.

First, even if we make value added measures about 20% of an evaluation system, and observations and other measures cover the rest, if the value-added measures vary most (which they are likely to, simply because they will be reported as statistically norm-referenced), then the value added measures likely become the tipping point more often than not. This is hugely problematic, given our inability to fully remove bias from these measures, and the fact that they remain so damn noisy as to hardly be useful at all (and are easily manipulated to yield different results for individual teachers)

Second, arguing that somehow using these noisy, potentially biased measures for personnel management or even mass deselection of teachers will somehow improve the equity of the distribution of teachers across advantaged and disadvantaged schools is simply absurd! This is especially the case if absolutely no attention is paid to existing underlying disparities in working conditions and teacher compensation.

The Real Connecticut Problem(s)

So, let’s take a look at what’s really going on in Connecticut regarding the distribution and compensation of teachers. But, let me begin with a bit of background literature on the relationship between funding and teacher quality. Rather than reinvent the wheel here, allow me to rely on a section of a policy brief I wrote last fall for Shanker Institute:

The Coleman report looked at a variety of specific schooling resource measures, most notably teacher characteristics, finding positive relationships between these traits and student outcomes. A multitude of studies on the relationship between teacher characteristics and student outcomes have followed, producing mixed messages as to which matter most and by how much.[i] Inconsistent  findings on the relationship between teacher “effectiveness” and how teachers get paid – by experience and education – added fuel to “money doesn’t matter” fire. Since a large proportion of school spending necessarily goes to teacher compensation, and (according to this argument) since we’re not paying teachers in a manner that reflects or incentivizes their productivity, then spending more money won’t help.[ii] In other words, the assertion is that money spent on the current system doesn’t matter, but it could if the system was to change.

Of course, in a sense, this is an argument that money does matter. But it also misses the important point about the role of experience and education in determining teachers’ salaries, and what that means for student outcomes.

While teacher salary schedules may determine pay differentials across teachers within districts, the simple fact is that where one teaches is also very important in determining how much he or she makes.[iii] Arguing over attributes that drive the raises in salary schedules also ignores the bigger question of whether paying teachers more in general might improve the quality of the workforce and, ultimately, student outcomes. Teacher pay is increasingly uncompetitive with that offered by other professions, and  the “penalty” teachers pay increases the longer they stay on the job.[iv]

A substantial body of literature has accumulated to validate the conclusion that both teachers’ overall wages and relative wages affect the quality of those who choose to enter the teaching profession, and whether they stay once they get in. For example, Murnane and Olson (1989) found that salaries affect the decision to enter teaching and the duration of the teaching career,[v] while Figlio (1997, 2002) and Ferguson (1991) concluded that higher salaries are associated with more qualified teachers.[vi] In addition, more recent studies have tackled the specific issues of relative pay noted above. Loeb and Page showed that:

“Once we adjust for labor market factors, we estimate that raising teacher wages by 10 percent reduces high school dropout rates by 3 percent to 4 percent. Our findings suggest that previous studies have failed to produce robust estimates because they lack adequate controls for non-wage aspects of teaching and market differences in alternative occupational opportunities.”[vii]

In short, while salaries are not the only factor involved, they do affect the quality of the teaching workforce, which in turn affects student outcomes.

Research on the flip side of this issue – evaluating spending constraints or reductions – reveals the potential harm to teaching quality that flows from leveling down or reducing spending. For example, David Figlio and Kim Rueben (2001) note that, “Using data from the National Center for Education Statistics we find that tax limits systematically reduce the average quality of education majors, as well as new public school teachers in states that have passed these limits.”[viii]

Salaries also play a potentially important role in improving the equity of student outcomes. While several studies show that higher salaries relative to labor market norms can draw higher quality candidates into teaching, the evidence also indicates that relative teacher salaries across schools and districts may influence the distribution of teaching quality. For example, Ondrich, Pas and Yinger (2008) “find that teachers in districts with higher salaries relative to non-teaching salaries in the same county are less likely to leave teaching and that a teacher is less likely to change districts when he or she teaches in a district near the top of the teacher salary distribution in that county.”[ix]

With regard to teacher quality and school racial composition, Hanushek, Kain, and Rivkin (2004) note: “A school with 10 percent more black students would require about 10 percent higher salaries in order to neutralize the increased probability of leaving.”[x] Others, however, point to the limited capacity of salary differentials to counteract attrition by compensating for working conditions.[xi]

Finally, it bears noting that those who criticize the use of experience and education in determining teachers’ salaries must of course produce a better alternative, and there is even less evidence behind increasingly popular ways to do so than there is to support the policies they intend to replace. In a perfect world, we could tie teacher pay directly to productivity, but contemporary efforts to do so, including performance bonuses based on student test results,[xii] have thus far failed to produce concrete results in the U.S. More promising efforts to measure productivity, such as new teacher evaluations that incorporate heavily-weighted teacher productivity measures based on their students’ test scores, are still a work in progress, and there is not yet evidence that they will be any more effective (or cost-effective) in attracting, developing or retaining high-quality teachers.

To summarize, despite all the uproar about paying teachers based on experience and education, and its misinterpretations in the context of the “Does money matter?” debate, this line of argument misses the point. To whatever degree teacher pay matters in attracting good people into the profession and keeping them around, it’s less about how they are paid than how much. Furthermore, the average salaries of the teaching profession, with respect to other labor market opportunities, can substantively affect the quality of entrants to the teaching profession, applicants to preparation programs, and student outcomes. Diminishing resources for schools can constrain salaries and reduce the quality of the labor supply. Further, salary differentials between schools and districts might help to recruit or retain teachers in high need settings. In other words, resources used for teacher quality matter.

So then, how does this all play out in Connecticut? By the reformy rhetoric being so casually tossed about one would think that all of those urban CT teachers must already be being paid lavishly and certainly more than enough than would be required to get the best and brightest CT college grads to want to teach in Bridgeport or New Britain.

Let’s start with wages relative to non-teaching professions. Allegretto, Corcoran and Mishel identify Connecticut as having a relatively average teaching penalty.

In Connecticut, the average weekly wages of teachers are about 77.6% of the average weekly wages of similarly educated non-teachers.

But, we also know that Connecticut’s good schools and districts are pretty darn good. So perhaps the issue isn’t so much about the average, but about the disparities. Besides, the core rhetoric around the proposed reforms seems to be much about the achievement gap in CT, which is indeed large even when corrected for the income gap.

Let’s quickly revisit my representation of which districts in CT are most disadvantaged, when we look at the relationship between cost and need adjusted per pupil expenditures and average current outcomes:

Expressing the funding as difference from the average, and throwing some cutpoints into the picture to create some fun groups for comparison, I get:

So, I’ve got the advantaged districts which have high adjusted spending and high outcomes. I’ve got my overall group of disadvantaged districts which have low adjusted spending and low outcomes, and a particularly screwed subset of these districts which I call severely disadvantaged (including Bridgeport and New Britain).

Now, recall, that the funding side of the Malloy plan isn’t going to do a whole lot to help out these districts.

Notice that huge infusion of funding represented by the red triangles relative to prior year Net Current Expenditures. Oh wait. There really isn’t any. But what’s funding got to do with it anyway? (go back and read the above section!)

So, I’ve taken the teacher level salary and characteristics data to estimate two different models of the differences in teacher characteristics between the advantaged and disadvantaged districts and between the advantaged and severely disadvantaged districts. First, let’s look simply at salary parity at constant teacher characteristics. NOTE THAT IT WOULD TAKE NOT ONLY AN EQUAL, BUT HIGHER SALARY, FOR EXAMPLE, TO GET TEACHERS WITH SPECIFIC QUALIFICATIONS TO WORK IN BRIDGEPORT AS OPPOSED TO WESTPORT.

Here’s the salary model, with comments in the margins:

All else equal, teachers in disadvantaged districts are still behind their peers in advantaged districts within the same labor market. Reformy platitudes and test based evaluation will not fix that!

Now, here’s a logistic regression of the likelihood that a teacher is a novice, or in his/her first 3 years of teaching. This is a commonly used marker for teacher quality inequity, because a substantial body of literature has found that concentrations of novice teachers (i.e. teachers with less than 3 or 4 years of experience) can have significant negative effects on student outcomes.[1] Rivkin, Hanushek, and Kain (2005) find that teacher experience is important in the first two years of a teaching career (but not thereafter).[2]  Hanushek and Rivkin note that: “we find that identifiable school factors – the rate of student turnover, the proportion of teachers with little or no experience, and student racial composition – explain much of the growth in the achievement gap between grades 3 and 8 in Texas schools.”[3] Notably, evidence from a variety of state and local contexts, provides a consistent picture that higher concentrations of novice teachers are associated with negative effects on student outcomes.

Here are the models:

So, kids in classrooms in severely disadvantaged or generally disadvantaged districts are each about 20% more likely to face novice teachers. Note that they are also more likely to be in larger classes, specifically if they are in the severe disparity group!

Again, SB24’s reformy platitudes will do nothing to remedy this disparity.

Put simply, the SB24 teacher effectiveness provisions are a massive smokescreen that do little or nothing to address persistent underlying disparities across CT districts. Worse, the misguided emphasis on reducing job security and focusing on problematic performance metrics will likely do more harm than good for children in the most disadvantaged districts.


 REFERENCES

[i] Hanushek, E.A. (1971) Teacher Characteristics and Gains in Student Achievement: Estimation Using MicroData. Econometrica 61 (2) 280-288

Clotfelter, C.T., Ladd, H.F., Vigdor, J.L. (2007) Teacher credentials and student achievement: Longitudinal analysis with student fixed effects. Economics of Education Review 26 (2007) 673–682

Goldhaber, D., Brewer, D. (1997) Why Don’t Schools and Teachers Seem to Matter? Assessing the Impact of Unobservables on Educational Productivity. The Journal of Human Resources, 332 (3) 505-523

Ehrenberg, R. G., & Brewer, D. J. (1994). Do school and teacher characteristics matter? Evidence from High School and Beyond. Economics of Education Review, 13(1), 1-17.

Ehrenberg, R. G., & Brewer, D. J. (1995). Did teachers’ verbal ability and race matter in the 1960s? Economics of Education Review, 14(1), 1-21.

Jepsen, C. (2005). Teacher characteristics and student achievement: Evidence from teacher surveys. Journal of Urban Economics, 57(2), 302-319.

Jacob, B. A., & Lefgren, L. (2004). The impact of teacher training on student achievement: Quasi-experimental evidence from school reform. Journal of Human Resources, 39(1),50-79.

Rivkin, S. G., Hanushek, E. A., & Kain, J. F. (2005). Teachers, schools, and academic achievement. Econometrica, 73(2), 471.

Wayne, A. J., & Youngs, P. (2003). Teacher characteristics and student achievement gains. Review of Educational Research, 73(1), 89-122.

For a recent review of studies on the returns to teacher experience, see:

Rice, J.K. (2010) The Impact of Teacher Experience: Examining the Evidence and Policy Implications. National Center for Analysis of Longitudinal Data in Educational Research.

[ii] Some go so far as to argue that half or more of teacher pay is allocated to “non-productive” teacher attributes, and so it follows that that entire amount of funding could be reallocated toward making schools more productive.

See, for example, a recent presentation to the NY State Board of Regents from September 13, 2011 (page 32), slides by Stephen Frank of Education Resource Strategies: http://www.p12.nysed.gov/mgtserv/docs/SchoolFinanceForHighAchievement.pdf

[iii] Lankford, H., Loeb., S., Wyckoff, J. (2002) Teacher Sorting and the Plight of Urban Schools. Educational Evaluation and Policy Analysis 24 (1) 37-62

[iv] Allegretto, S.A., Corcoran, S.P., Mishel, L.R. (2008) The teaching penalty : teacher pay losing ground. Washington, D.C. : Economic Policy Institute, ©2008.

[v] Richard J. Murnane and Randall Olsen (1989) The effects of salaries and opportunity costs on length of state in teaching. Evidence from Michigan. Review of Economics and Statistics 71 (2) 347-352

[vi] David N. Figlio (2002) Can Public Schools Buy Better-Qualified Teachers?” Industrial and Labor Relations Review 55, 686-699. David N. Figlio (1997) Teacher Salaries and Teacher Quality. Economics Letters 55 267-271. Ronald Ferguson (1991) Paying for Public Education: New Evidence on How and Why Money Matters. Harvard Journal on Legislation. 28 (2) 465-498.

[vii] Loeb, S., Page, M. (2000) Examining the Link Between Teacher Wages and Student Outcomes: The Importance of Alternative Labor Market Opportunities and Non-Pecuniary Variation. Review of Economics and Statistics 82 (3) 393-408

[viii] Figlio, D.N., Rueben, K. (2001) Tax Limits and the Qualifications of New Teachers. Journal of Public Economics. April, 49-71

See also:

Downes, T. A. Figlio, D. N. (1999) Do Tax and Expenditure Limits Provide a Free Lunch? Evidence on the Link Between Limits and Public Sector Service Quality52 (1) 113-128

[ix] Ondrich, J., Pas, E., Yinger, J. (2008) The Determinants of Teacher Attrition in Upstate New York. Public Finance Review 36 (1) 112-144

[x] Hanushek, Kain, Rivkin, “Why Public Schools Lose Teachers,” Journal of Human Resources 39 (2) p. 350

[xi] Clotfelter, C., Ladd, H.F., Vigdor, J. (2011) Teacher Mobility, School Segregation and Pay Based Policies to Level the Playing Field. Education Finance and Policy , Vol.6, No.3, Pages 399–438

Clotfelter, Charles T., Elizabeth Glennie, Helen F. Ladd, and Jacob L. Vigdor. 2008. Would higher salaries keep teachers in high-poverty schools? Evidence from a policy intervention in North Carolina. Journal of Public Economics 92: 1352–70.

[xii] For recent studies specifically on the topic of “merit pay,” each of which generally finds no positive effects of merit pay on student outcomes, see:

Glazerman, S., Seifullah, A. (2010) An Evaluation of the Teacher Advancement Program in Chicago: Year Two Impact Report. Mathematica Policy Research Institute. 6319-520

Springer, M.G., Ballou, D., Hamilton, L., Le, V., Lockwood, J.R., McCaffrey, D., Pepper, M., and Stecher, B. (2010). Teacher Pay for Performance: Experimental Evidence from the Project on Incentives in Teaching. Nashville, TN: National Center on Performance Incentives at Vanderbilt University.

Marsh, J. A., Springer, M. G., McCaffrey, D. F., Yuan, K., Epstein, S., Koppich, J., Kalra, N., DiMartino, C., & Peng, A. (2011). A Big Apple for Educators: New York City’s Experiment with Schoolwide Performance Bonuses. Final Evaluation Report. RAND Corporation & Vanderbilt University.


[1] See Charles T. Clotfelter, Helen F. Ladd and Jacob L. Vigdor, “Who Teaches Whom? Race and the distribution of novice teachers,” Economics of Education Review 24, no. 4 (August, 2005): 377-392;   See Charles T. Clotfelter, Helen F. Ladd and Jacob L. Vigdor, “Teacher sorting, teacher shopping, and the assessment of teacher effectiveness,” Sanford Institute of Public Policy, Duke University, 2004; and Hanushek, Kain, and Rivkin, “Teachers, schools, and academic achievement.”

[2] Hanushek, Kain, and Rivkin, “Teachers, schools, and academic achievement.”

Snapshots of Connecticut Charter School Data

In several previous posts I have addressed the common argument among charter advocacy organizations (notably, not necessarily those out there doing the hard work of actually running a real charter school – but the pundits who claim to speak on their behalf) that charter schools do more, with less while serving comparable student populations. This argument appears to be a central theme of current policy proposals in Connecticut, which, among other things, would substantially increase funding for urban charter schools while doing little to provide additional support for high need traditional public school districts. For more on that point, see here.

I’ve posted some specific information on Connecticut charter schools in previous posts, but have not addressed them more broadly. Here, I provide a run-down of simple descriptive data, widely available through two major credible sources. Easy enough to replicate any/all of these analyses on your own with the publicly available data:

Connecticut State Department of Education (CEDaR) reports

National Center for Education Statistics Common Core of Data

Since the common claim is that charters do more (outcomes) with less (funding) and while serving the same kids (demographics), it is relevant to walk through each of these prongs of the argument step by step.

DEMOGRAPHIC COMPARISONS

These graphs focus on Connecticut’s most acclaimed high-flying charter schools, those affiliated with Achievement First, and the graphs are relatively self explanatory.

Note: % Free lunch information comes form 2009-10 NCES Common Core of Data and includes all schools identified as being located within the city limits. % ELL data is from 2010-11 CEDaR system and includes Achievement First Charters and District Schools (leading to smaller numbers of total schools due to special school and other charter exclusions). Special education data are gathered from individual school snapshot reports (CEDaR).

For fun, in this one, I’ve also noted the position of Capital Prep – which is a magnet school, and it is well understood that the student populations at Hartford magnets are substantively different from Hartford regular public schools. But strangely, there is even substantial rhetoric out there about this school being an example of beating the odds!?!

Finally:

Put very simply – Achievement First Charter schools DO NOT SERVE STUDENT POPULATIONS COMPARABLE TO DISTRICT POPULATIONS.

I have explained previously how this is relevant to broader policy discussions. Specifically, it is relevant to the claim that these schools can serve as a model for expansion yielding similar outcomes for all children in New Haven, Bridgeport or Hartford. In very simple terms, there are not enough non-low income, non-disabled and non-ELL kids around in these settings to broadly replicate the outcomes that these schools may be achieving.  Again, this public policy perspective contrasts with the parental choice perspective. While from a public policy perspective we are concerned that these outcomes may be merely a function of selective demography, from a personal/parental choice perspective within any one of these cities, the concern is only for the outcomes, and achieving those outcomes by having a desirable peer group is as desirable as achieving those outcomes by providing higher quality service.

FINANCIAL & OTHER RESOURCE COMPARISONS

Below (at end of post) I provide an important explanation/discussion of issues in comparing charter school and traditional public district finances. First and foremost, it is important to understand simply from the above comparisons, that these schools serve substantively different student populations, thus equal dollar inputs is, from the outset, an inappropriate fairness metric. But the complexities go beyond that. In CT and other locations, host districts retain responsibility for transportation and special education costs, even for students attending charters. Thus, it would be reasonable, as I did in a previous post to subtract out those expenditures from district budgets when comparing to charter spending. Now, on the other side, Charters do often have to lease facilities at their own expense, which in a state like CT would typically run about $1,500 to $2,000 per pupil. More in NYC, similar in NJ. But, while charter advocates would have you believe that districts have $0 cost of facilities, that is not necessarily true. For CT public districts, plant operations expenses per pupil tend to be on the order of $1,000 to $2,000 per pupil, and large urban districts maintaining significant capital stock with significant deferred maintenance tend to be toward the high end. More discussion of the factors which cut each way is in the note at the end of the post. So, here’s a quick run-down on charter and district expenditures in CT, cut different ways (all expressed in per pupil terms, and with respect to district/charter % Free or Reduced price lunch shares):

So… after taking out special education and transportation, charters appear relatively well resourced.

EVEN IF WE ASSUME THAT THE NET DIFFERENCE IN FACILITIES COST IS ABOUT $1,000 PER PUPIL BETWEEN CHARTER AND DISTRICT SCHOOLS, CHARTERS ARE IN PRETTY GOOD SHAPE IN CT.  (That assumption would pull the $1,000 per pupil off the charter estimates above). This would assume the facilities maintenance/operations/debt service in hosts to be about $1,000 and lease/operations/maintenance for charters to be about $2,000 per pupil.

Here’s an alternative angle (from previous post)

I also showed in a previous post that for Amistad, the funding difference translates to both a class size advantage and salary advantage:

Class sizes are more mixed in Hartford, but in Bridgeport (the least well funded urban district), Achievement First offers much smaller class size:

OUTCOMES

The final prong of the argument involves those higher outcomes – those beating the odds with the same kids and less money – outcomes.  Here are a few samples of the 5th grade math outcomes by district, focusing on the position of the Achievement First charter schools. I’ve graphed the school level 5th grade math 2010-11 Connecticut Mastery Test mean scale score by school level % Free Lunch (prior year). It’s important to understand that these charter schools not only have much lower % Free Lunch but also tend to have low ELL populations and also have much lower shares of enrollment with disabilities.

Here’s Hartford, where the Achievement First school looks so unlike nearly every Hartford public school reporting 5th grade math scores that it’s hard to even make a comparison. But, the two dots over near the Achievement First school do perform similarly.

Comparisons are comparably ridiculous in Bridgeport.

But more reasonable in New Haven! Even then, Amistad and Elm City Prep fall somewhat in line with New Haven schools serving similar % Free Lunch.

A statewide look at 7th grade math scores provides a better showing especially for Achievement First schools, but the analysis is hardly decisive. Note that this graph uses % Free or Reduced Lunch from CEDaR sources. Using such a high income threshold for low income status tends to mash schools in urban districts against the right hand side of the figure, removing some important variation.  I’ll redo with % free if/when I get the chance. This graph includes schools statewide, including affluent suburban schools. Among the notable features of the graph is that low income status matters, whether for charter schools or for traditional district schools. Most fall along the trendline.

In this case, the Achievement First schools in particular have higher math mean scale scores than traditional public schools serving the same % Free Lunch, BUT… this DOES NOT ACCOUNT FOR THE ADDITIONAL DIFFERENCES IN ELL AND SPECIAL EDUCATION WHICH MAY (WILL) SUBSTANTIALLY INFLUENCE THESE COMPARISONS!

Perhaps most importantly, these scatterplots are essentially little more than descriptive comparisons of mean scale scores against schools similar on a single parameter (% Free Lunch). BUT, even this simple adjustment serves to undermine the current rhetoric in Connecticut, as I discussed in a previous post.

NOTE: Charter-District School Spending Comparisons & the Facilities Cost Issue

A study frequently cited by charter advocates, authored by researchers from Ball State University and Public Impact, compared the charter versus traditional public school funding deficits across states, rating states by the extent that they under-subsidize charter schools.[1] The authors identify no state or city where charter schools are fully, equitably funded. But simple direct comparisons between subsidies for charter schools and public districts can be misleading because public districts may still retain some responsibility for expenditures associated with charters that fall within their district boundaries or that serve students from their district. For example, under many state charter laws, host districts or sending districts retain responsibility for providing transportation services, subsidizing food services, or providing funding for special education services. Revenues provided to host districts to provide these services may show up on host district financial reports, and if the service is financed directly by the host district, the expenditure will also be incurred by the host, not the charter, even though the services are received by charter students. Drawing simple direct comparisons thus can result in a compounded error: Host districts are credited with an expense on children attending charter schools, but children attending charter schools are not credited to the district enrollment.  In a per pupil spending calculation for the host districts, this may lead to inflating the numerator (district expenditures) while deflating the denominator (pupils served), thus significantly inflating the district’s per pupil spending. Concurrently, the charter expenditure is deflated.

Correct budgeting would reverse those two entries, essentially subtracting the expense from the budget calculated for the district, while adding the in-kind funding to the charter school calculation. Further, in districts like New York City, the city Department of Education incurs the expense for providing facilities to several charters. That is, the City’s budget, not the charter budgets, incur another expense that serves only charter students. The Ball State/Public Impact study errs egregiously on all fronts, assuming in each and every case that the revenue reported by charter schools versus traditional public schools provides the same range of services and provides those services exclusively for the students in that sector (district or charter).

Charter advocates often argue that charters are most disadvantaged in financial comparisons because charters must often incur from their annual operating expenses, the expenses associated with leasing facilities space. Indeed it is true that charters are not afforded the ability to levy taxes to carry public debt to finance construction of facilities. But it is incorrect to assume when comparing expenditures that for traditional public schools, facilities are already paid for and have no associated costs, while charter schools must bear the burden of leasing at market rates – essentially and “all versus nothing” comparison. First, public districts do have ongoing maintenance and operations costs of facilities as well as payments on debt incurred for capital investment, including new construction and renovation.  The average “capital outlay” expenditure of public school districts  in 2008-09 was over $2,000 per pupil in New York State, nearly $2,000 per pupil in Texas and about $1,400 per pupil in Ohio. Based on enrollment weighted averages generated from the U.S. Census Bureau’s Fiscal Survey of Local Governments, Elementary and Secondary School Finances 2008-09 (variable tcapout): http://www2.census.gov/govs/school/elsec09t.xls

Second, charter schools finance their facilities by a variety of mechanisms, with many in New York City operating in space provided by the city, many charters nationwide operating in space fully financed with private philanthropy, and many holding lease agreements for privately or publicly owned facilities. New York City is not alone it its choice to provide full facilities support for some charter school operators (http://www.thenotebook.org/blog/124517/district-cant-say-how-many-millions-its-spending-renaissance-charters). Thus, the common characterization that charter schools front 100% of facilities costs from operating budgets, with no public subsidy, and traditional public school facilities are “free” of any costs is wrong in nearly every case, and in some cases, there exists no facilities cost disadvantage whatsoever for charter operators.

Baker and Ferris (2011) point out that while the Ball State/Public Impact Study claims that charter schools in New York State are severely underfunded, the New York City Independent Budget Office (IBO), in more refined analysis focusing only on New York City charters (the majority of charters in the State), points out that charter schools housed within Board of Education facilities are comparably subsidized when compared with traditional public schools (2008-09). In revised analyses, the IBO found that co-located charters (in 2009-10) actually received more than city public schools, while charters housed in private space continued to receive less (after discounting occupancy costs).[1] That is, the funding picture around facilities is more nuanced that is often suggested.

Batdorff, M., Maloney, L., May, J., Doyle, D., & Hassel, B. (2010). Charter School Funding: Inequity Persists. Muncie, IN: Ball State University.

NYC Independent Budget Office (2010, February). Comparing the Level of Public Support: Charter Schools versus Traditional Public Schools. New York: Author, 1

NYC Independent Budget Office (2011) Charter Schools Housed in the City’s School Buildings get More Public Funding per Student than Traditional Public Schools. http://ibo.nyc.ny.us/cgi-park/?p=272

NYC Independent Budget Office (2011) Comparison of Funding Traditional Schools vs. Charter Schools: Supplement http://www.ibo.nyc.ny.us/iboreports/chartersupplement.pdf

Additional Figures

Administrative expenses in charters often include facilities lease agreements in addition to any recruitment/marketing expenses and growth/expansion.

Reformy Platitudes & Fact-Challenged Placards won’t Get Connecticut Schools what they Really Need!

For a short while yesterday – more than I would have liked to – I followed the circus of testimony and tweets about proposed education reform legislation in Connecticut. The reform legislation – SB 24 – includes the usual reformy elements of teacher tenure reform, ending seniority preferences, expanding and promoting charter schooling, etc. etc. etc. And the reformy circus had twitpics of of eager undergrads (SFER) & charter school students (as young as Kindergarten?) shipped in and carrying signs saying CHARTER=PUBLIC (despite a body of case law to the contrary, and repeated arguments, some lost in state courts [oh], by charter operators that they need not comply with open records/meetings laws or disclose employee contracts), and tweeting reformy platitudes and links to stuff they called research supporting the reformy platform (Much of it tweeted as “fact checking” by the ever-so-credible ConnCAN).

Ignored in all of this theatre-of-the-absurd was any actual substantive, knowledgeable conversation about the state of public education in Connecticut, the nature of the CT achievement gap and the more likely causes of it, and other problems/failures of Connecticut education policy.

First, that achievement gap:

Yes, Connecticut has a large achievement gap… among the largest. But, I encourage you to read my previous post in which I explain that poverty achievement gaps in states tend to be mostly a function of income disparity in states. The bigger the income difference between rich and poor, the bigger the achievement gaps between them. But, even then, the CT achievement gap is a problem. CT’s income gaps between poor and  non-poor are most similar to those of MA and NJ, but both MA and NJ do better than CT on achievement gap measures. Here’s a graph relating income gap and achievement gap:

Connecticut has a higher than otherwise expected gap and MA, NJ and RI have lower.

But, is this because of teacher tenure? Is it because teachers aren’t regularly fired because of bad student test scores? Is it because there aren’t enough charter or magnet schools in CT? That’s highly unlikely for several reasons.

First, teachers have tenure status in both higher and lower performing, higher and lower income districts in CT. As I show below, teacher salaries are lower and class sizes larger in disadvantaged districts. SB24 does NOTHING to fix that.

As for highly recognized charter and magnet schools in CT, these schools are actually serving far fewer of the lower income kids within the lower income neighborhoods. So, while they might be doing okay, on average, for the kids they are serving, it is equally likely that they are contributing to the achievement gap as much if not more than helping it. That’s not to say they aren’t helping the students they are serving. But rather that the segregated nature of their services is capitalizing on a peer effect of concentrating more advantaged children. Either way, these schools are unlikely to serve as a broad based solution for CT education quality in general or for resolving achievement gaps.

During this same time period, teachers in NJ and MA also had similar tenure protections and weren’t being tenured or fired based on student test scores. Still somehow, those states had smaller gaps. Further, while both other states do have charter schools, New Jersey which has a much smaller achievement gap than CT has thus far maintained a relatively small charter sector. What Massachusetts and New Jersey have done is to more thoroughly and systematically address school funding disparities.

The Real Disparities:

In a previous series of posts, I discussed what I called Inexcusable Inequalities. I actually used CT as the main example, not because CT is among the worst states on funding inequality, but because I happened to have good data on CT. CT is not among the worst. That special space is reserved for NY, IL, PA and a few others. But CT has its problems. Let’s do a quick walk through. In my previous analysis

I started my previous post by comparing per pupil spending adjusted for needs and costs across all CT school districts with actual outcomes of those districts in order to categorize CT districts into more and less advantaged groups. The differences, starting with the figure below were pretty darn striking. Districts like New Canaan, Westport and Weston have rather high need and cost adjusted spending, certainly by comparison with Bridgeport, New London or New Britain.

For Illustrative purposes, I then picked a few of the most disadvantaged CT districts and compared them to the most advantaged on a handful of measures – shown below. In this table, I report their nominal spending per pupil – not adjusted for the various needs and additional costs. Even without those adjustments, districts like Bridgeport and New Britain start well behind their more advantaged peers. And among other differences, they pay their teachers less a) on average and b) at any given level of experience or education. Pretty darn hard to recruit and retain quality teachers into these settings given the combination of working conditions and lower pay.

AND MAKING TENURE CONTINGENT ON STUDENT TEST SCORES, OR FIRING TEACHERS BASED ON STUDENT TEST SCORES WON’T FIX THAT! IT WILL FAR MORE LIKELY MAKE IT MUCH, MUCH WORSE!

Salary disparity patterns hold when comparing a) all districts in the upper right of the first figure with b) all districts in the lower left, and c) districts furthers in the lower left (severe disparity):

On top of that, class sizes are also larger in the higher need districts, despite the need for smaller class sizes to aid in closing the achievement gaps for these children (more here).

Further, as I showed in my previous post, the funding disparities have significant consequences for the depth and breadth of curricular offerings available to high students in these districts:

For this analysis, I used individual teacher level data on individual course assignments to determine the distribution of teacher assignments per child, thus characterizing each district’s and group of districts’ offerings (for related research, see: https://schoolfinance101.files.wordpress.com/2010/01/b-baker-mo_il-resourcealloc-aera2011.pdf)

Disadvantaged districts have far fewer total positions per child, and if we click and blow up the graph, we can see some striking discrepancies! Those high need districts have far more special education and bilingual education teachers (squeezing out other options, from their smaller pot!). Those high need districts have only about half the access to teachers in physical education assignments or art, much less access to Band (little or none to Orchestra), and significantly less access to math teachers!

IN REALLY SIMPLE TERMS, UNDER CT POLICIES, HIGH NEED DISTRICTS SUCH AS BRIDGEPORT AND NEW BRITAIN HAVE FAR FEWER RESOURCES AND FAR GREATER NEEDS. THEIR TEACHERS HAVE LOWER SALARIES AND, ON AVERAGE, LARGER CLASSES.

Messing with teacher evaluation, especially in ways as likely to do harm as to do good, is an unfortunate distraction at best. Doing so on the basis that those are the policy changes needed to close Connecticut’s achievement gap reflects an astounding degree of utter obliviousness!

What about those amazing CT charter and magnet schools? Aren’t they the ultimate scalable solution?

I’ve written much more detail here, about the issue of whether renowned CT charter schools actually “do more, with less while serving the same students.” Here are a few quick graphs. First, Amistad Academy of New Haven in context, by % free lunch:

Next, Capital Prep in Hartford in context. Now, I typically wouldn’t (shouldn’t) have to point out that a small selective magnet program drawing students across district lines is simply NOT REPRESENTATIVE and not likely a scalable solution for all kids.  It’s a potentially good option for those with access, and much of the benefit of the option likely rests in selective peer group effect (as noted above). I feel compelled, however, to point out how Capital Prep is (obviously) not a typical  school only because the head of the school seems to be trying to argue that it is a model scalable reform Really? Really? I mean…. REALLY?):

But what about Governor Malloy’s funding plan? That’ll fix it! Won’t it?

Amidst all of the reformy platitudes, misguided and fact-challenged placards and the like, there were occasional references to Governor Malloy’s changes to the state school finance formula – seemingly implying that the Governor has taken major steps toward making the (supposedly already overfunded) system fairer. There was certainly no outrage expressed at the types of disparities I note above, and all the warm fuzzy feeling anyone could possibly conjure that any finance package tied to the vast batch of reformyness on steriods would be sufficient to get the job done.

After all, new aid would be progressively distributed. Those poor districts would get, on average, about… oh… a whopping new $250 per pupil while richer districts would get only about $50 per pupil. And with this astounding outlay of fiscal effort, the most important thing is to make sure it doesn’t just go straight into the pockets of those union-lacky-lazy-self-interested-teachers, of course – or at least certainly not the “ineffective” ones.

Here are the effects of the Malloy funding increases, on a per pupil basis, if added on to Net Current Expenditures per Pupil (pulling out magnet school aid which creates a distorted representation for New Haven and Hartford):

What we have in this picture is each district as a dot (circle or triangle). Districts are sorted from low to high percent free/reduced lunch along the horizontal axis. Net Current Expenditures are on the vertical axis. Blue Circles represent current (okay, last year) levels of current expenditures per pupil. RED TRIANGLES REPRESENT THE ADDITION OF MALLOY AID. Wow… that’s one heck of a difference. That should certainly fix the disparities I laid out above! NOT!

Here it is with district names added, so you can see where some of our more disadvantaged districts start and end up:

Not that helpful for Bridgeport or New Britain, is it?

To summarize:

The fact is that EQUITABLE AND ADEQUATE FUNDING IS THE NECESSARY UNDERLYING CONDITION FOR IMPROVING EDUCATION QUALITY IN CONNECTICUT AND REDUCING ACHIEVEMENT GAPS!!!!!! (related research: http://www.tcrecord.org/library/content.asp?contentid=16106)

Equitable and adequate funding is a necessary underlying condition for running any quality school, be it a traditional public school, charter school or private school. Money matters and it matters regardless of the type of school we’re talking about.

Equitable and adequate funding is required for recruiting and retaining teachers in Connecticut’s high need, currently under-resourced schools (something charter operators realize). Recruiting and retaining teachers to work in these communities will take more, not less money.

Reformy platitudes (and fact-challenged placards) about tenure reform won’t change that.  And altering the job security landscape to move toward ill-conceived evaluation frameworks and flawed metrics will likely hurt far more than it will help.

It’s time to pack up the reformy circus, load up the buses and shred the placards and have some real, substantive conversations about improving the quality and equality of public schooling in Connecticut.