Blog

America’s Most Screwed City Schools: Where are the least fairly funded city districts?

Contrary to reformy wisdom regarding spending bubbles… the harmlessness …. oh wait… the benefits of spending cuts… and the fact that we all know as a reformy fact that we’ve already dumped plenty of money into our high need districts nationwide – it turns out that there actually are still some school districts out there that appear somewhat disadvantaged when it comes to funding.

Soon, we will be releasing our annual update of our report on school funding fairness. In that report, we emphasize that school funding fairness is an issue primarily governed by and primarily a responsibility of the states. And school funding fairness varies widely across states.  First, the overall level of funding varies significantly from state to state. Second, the extent to which states provide additional resources to districts with higher concentrations of children in poverty varies widely across states. In fact, several large, diverse states still maintain state school finance systems where the highest need districts receive substantially less state and local revenue per pupil than the lowest need districts. These states include Illinois, New York, Pennsylvania and Texas among others.

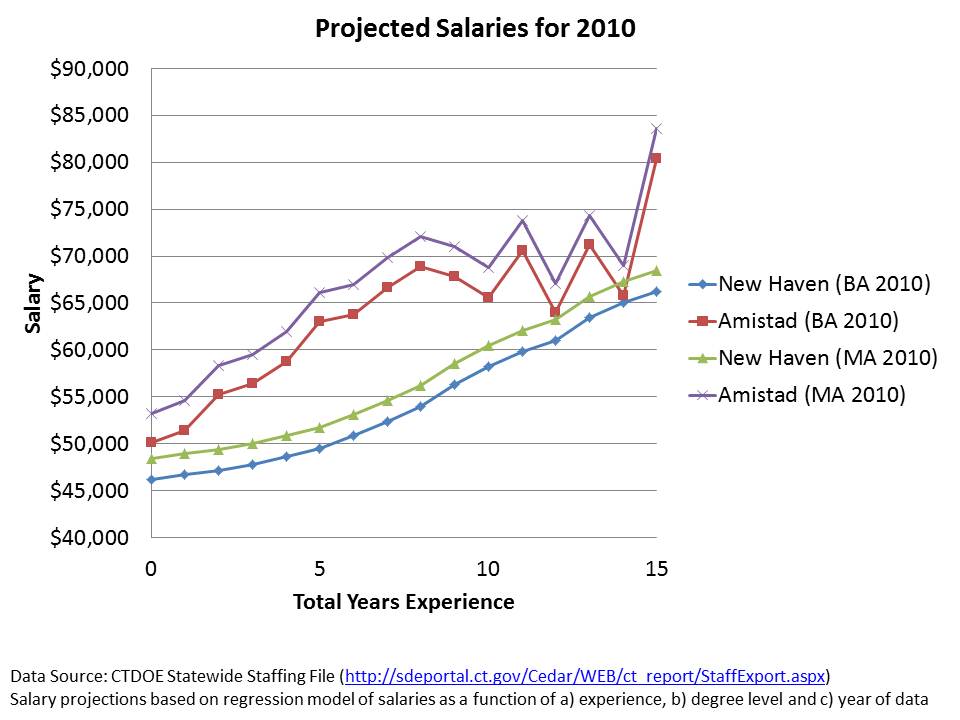
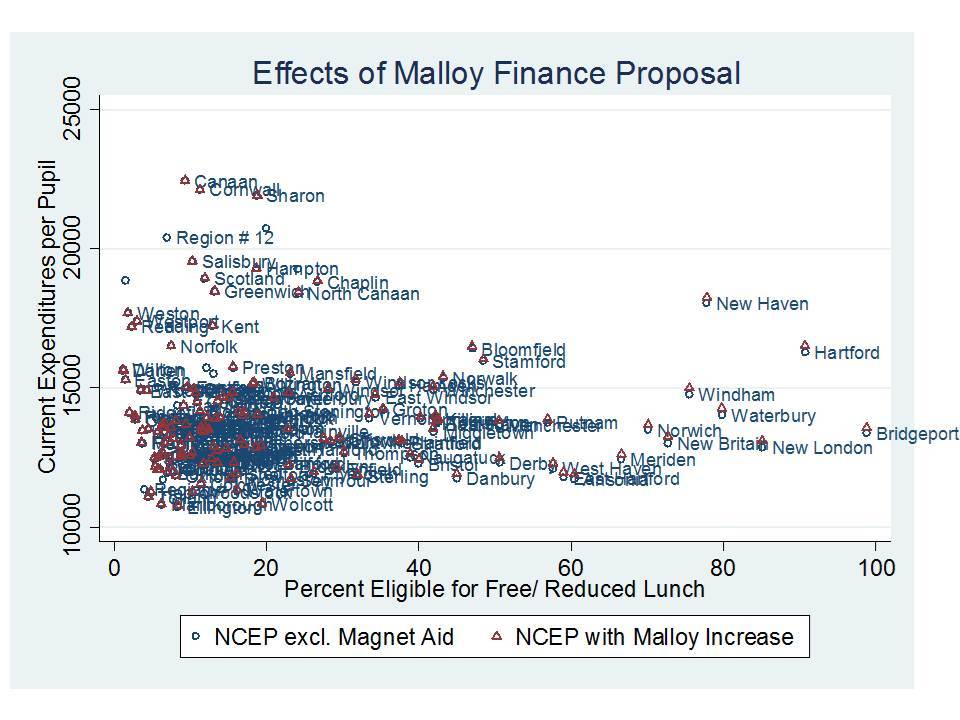
It’s important to understand that the value of any given level of education funding, in any given location, is relative. That is, it doesn’t simply matter that a district has or spends $10,000 per pupil, or $20,000 per pupil. What matters is how that funding compares to other districts operating in the same labor market, and for that matter, how that money relates to other conditions in the region/labor market. Why? Well, schooling is labor intensive.  And the quality of schooling depends largely on the ability of schools or districts to recruit and retain quality employees. And yes… despite reformy arguments to the contrary – competitive wages for teachers matter!  The largest share of school district annual operating budgets is tied up in the salaries and wages of teachers and other school workers. The ability to recruit and retain teachers in a school district in any given labor market depends on the wage a district can pay to teachers a) relative to other surrounding schools/districts and b) relative to non-teaching alternatives in the same labor market.

In our funding fairness report, we present statewide profiles of disparities in funding with respect to poverty. But, I thought it would be fun (albeit rather depressing) here to try to identify some of the least well-funded districts in the country. Now, keep in mind that there are still over 15,000 districts nationwide. I’m focusing here on large and mid-sized cities using a Census Bureau Locale classification.

Following are two lists. In each case, I have selected districts where:

  • The combined state and local revenue per pupil is less than the average for districts in the same labor market (core based statistical area);
  • The U.S. Census Poverty rate for the district is more than 50% higher than the average for districts in the same labor market.

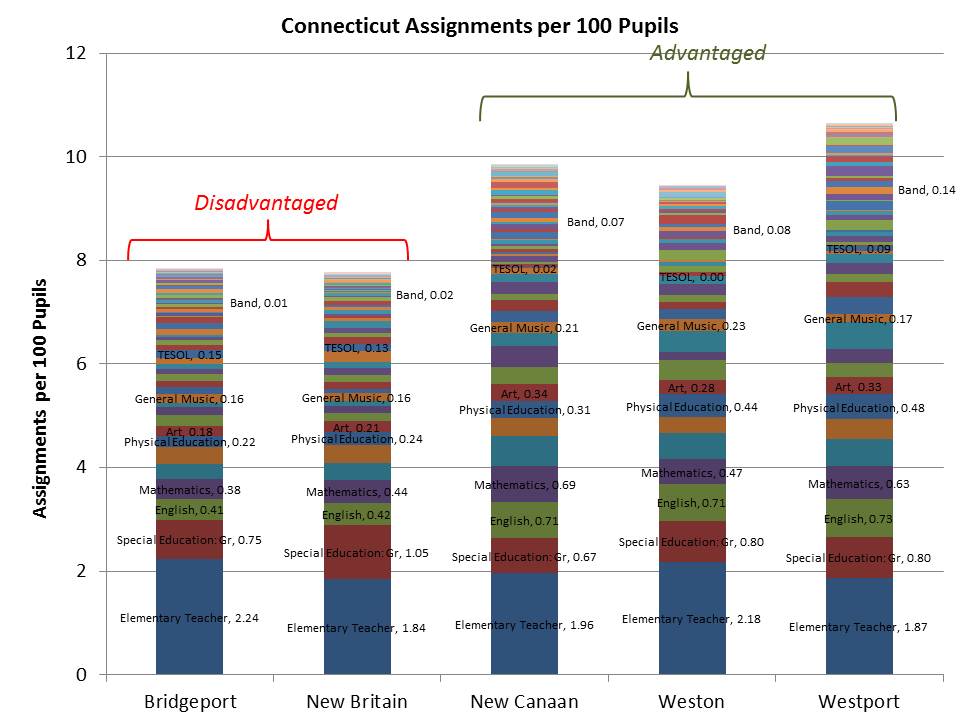
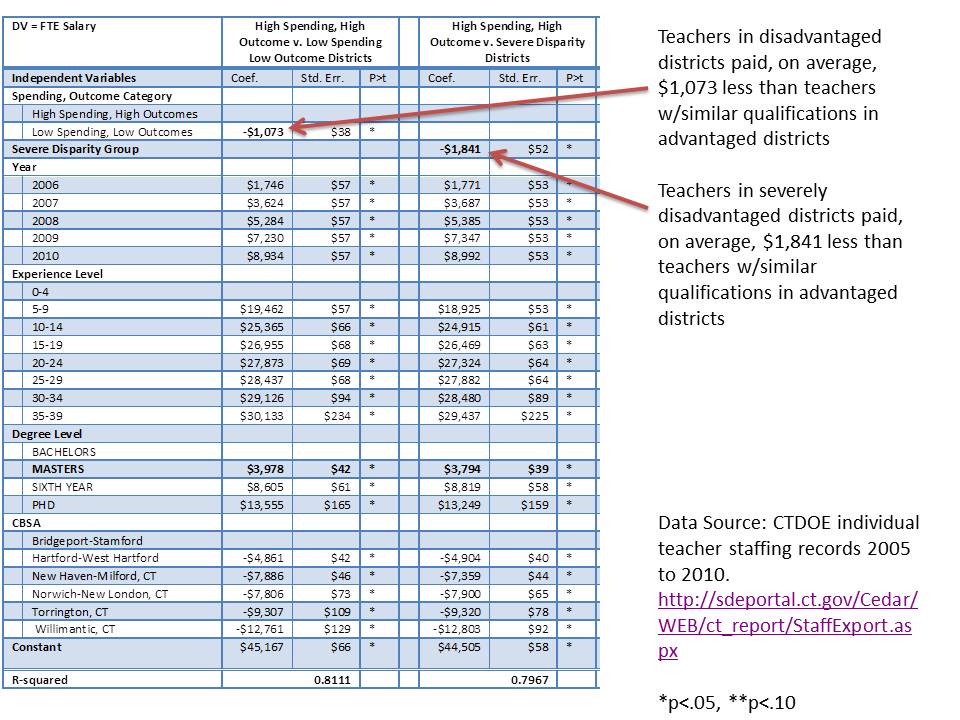
Put very simply, districts with higher student needs than surrounding districts in the same labor market don’t just require the same total revenue per pupil to get the job done. They require more. Higher need districts require more money simply to recruit and retain similar quantities (per pupil) of similar quality teachers. That is, they need to be able to pay a wage premium. In addition, higher need districts need to be able to both provide the additional program/service supports necessary for helping kids from disadvantaged backgrounds (including smaller classes in early grades) while still maintaining advanced and enriched course options.

The districts in these tables not only don’t have the “same” total state and local revenue per pupil than surrounding districts. They have less and in some cases they have a lot less! In many cases their child poverty rate is more than twice that of the surrounding districts that continue to have more resources.

Among the least well funded cities are Chicago, Philadelphia and Bridgeport, CT. All have much higher poverty than their surroundings.

Table 1. Least fairly funded large, midsize and small cities [Preliminary single year analysis]

District State State & Local Revenue Ratio  Poverty Ratio
West Fresno Elementary School District California 71%          1.97
Roosevelt Elementary District Arizona 74%          1.87
Alhambra Elementary District Arizona 75%          1.85
Reading School District Pennsylvania 78%          2.50
Allentown City School District Pennsylvania 78%          2.48
Franklin-McKinley Elementary School District California 79%          1.92
Chicago Public School District 299 Illinois 80%          1.67
Alum Rock Union Elementary School District California 82%          1.52
Isaac Elementary District Arizona 83%          1.91
Sunnyside Unified District Arizona 85%          1.70
Creighton Elementary District Arizona 87%          1.96
North Forest Independent School District Texas 87%          2.13
Manchester School District New Hampshire 87%          1.77
East Hartford School District Connecticut 87%          1.60
Murphy Elementary District Arizona 87%          2.88
Schenectady City School District New York 88%          2.53
Lansingburgh Central School District New York 89%          1.94
Pontiac City School District Michigan 90%          3.04
Kankakee School District 111 Illinois 91%          1.69
Utica City School District New York 91%          1.98
National Elementary School District California 91%          1.74
San Antonio Independent School District Texas 91%          1.66
Bloomington School District 87 Illinois 91%          1.73
Godfrey-Lee Public Schools Michigan 92%          1.81
Hueneme Elementary School District California 92%          1.72
Dallas Independent School District Texas 92%          1.83
Balsz Elementary District Arizona 92%          1.66
Adams-Arapahoe School District 28J Colorado 93%          1.77
Binghamton City School District New York 93%          1.91
Fort Worth Independent School District Texas 93%          1.70
Norfolk City Public Schools Virginia 93%          1.77
Magnolia Elementary School District California 93%          1.65
Parkrose School District 3 Oregon 93%          1.69
Godwin Heights Public Schools Michigan 94%          1.57
Philadelphia City School District Pennsylvania 94%          2.12
Alief Independent School District Texas 94%          1.69
David Douglas School District 40 Oregon 96%          2.00
South San Antonio Independent School District Texas 96%          1.61
Lansing Public School District Michigan 96%          2.00
Clarenceville School District Michigan 96%          1.65
Harrison School District 2 Colorado 96%          1.81
Holland City School District Michigan 96%          1.71
Lebanon School District Pennsylvania 96%          2.08
Bridgeport School District Connecticut 98%          2.63
Edgewood Independent School District Texas 98%          1.71
Turner Unified School District 202 Kansas 98%          1.62
Biddeford Maine 98%          1.84
Saginaw City School District Michigan 98%          1.73
North Little Rock School District Arkansas 98%          1.63
Burlington School District Vermont 98%          1.90
Milwaukee School District Wisconsin 98%          2.09
Omaha Public Schools Nebraska 98%          1.72
Santa Ana Unified School District California 99%          1.63
Birmingham City School District Alabama 99%          1.77
Erie City School District Pennsylvania 99%          1.70
Crooked Oak Public Schools Oklahoma 99%          1.73
Lancaster School District Pennsylvania 99%          2.11
Lima City School District Ohio 99%          2.24
Gainesville City School District Georgia 99%          1.78
Oakland Unified School District California 99%          1.84

Data Sources: Based on Census Fiscal Survey (f33) 2008-09 [http://www.census.gov/govs/school/] and Census Small Area Income and Poverty Estimates

Table 2. Least fairly funded fringe districts of large, midsize and small cities [Preliminary single year analysis]

District State State & Local Revenue Ratio  Poverty Ratio
Clearview Local School District Ohio 67%          1.57
Cicero School District 99 Illinois 67%          1.60
Waukegan Community Unit School District 60 Illinois 68%          1.97
Posen-Robbins Elementary School District 143-5 Illinois 69%          1.74
Lincoln Elementary School District 156 Illinois 71%          1.76
Maywood-Melrose Park-Broadview School District 89 Illinois 72%          1.52
Kannapolis City Schools North Carolina 72%          1.53
Round Lake Community Unit School District 116 Illinois 72%          1.72
Ravenswood City Elementary School District California 73%          1.82
Zion Elementary School District 6 Illinois 73%          1.99
Community Consolidated School District 168 Illinois 75%          1.79
Inkster City School District Michigan 75%          1.55
Woonsocket School District Rhode Island 76%          1.78
Dayton Independent School District Kentucky 76%          1.82
Port Huron Area School District Michigan 77%          1.93
Highland Park City Schools Michigan 78%          2.03
Harvey School District 152 Illinois 79%          1.76
Pawtucket School District Rhode Island 80%          1.56
Clintondale Community Schools Michigan 80%          1.68
Bessemer City School District Alabama 80%          1.86
New Miami Local School District Ohio 80%          1.78
Hamtramck Public Schools Michigan 80%          2.13
Chicago Heights School District 170 Illinois 80%          1.84
Kenosha School District Wisconsin 81%          1.63
Blackstone-Millville School District Massachusetts 81%          1.63
North Chicago School District 187 Illinois 82%          2.06
Waterbury School District Connecticut 82%          1.94
Ludlow Independent School District Kentucky 82%          1.52
Revere School District Massachusetts 83%          1.82
Chicago Ridge School District 127-5 Illinois 83%          1.67
Laurel Highlands School District Pennsylvania 83%          1.62
Brentwood Union Free School District New York 84%          2.17
Glendale Elementary District Arizona 84%          1.57
Pleasant Hill School District 69 Illinois 84%          2.08
Lennox Elementary School District California 85%          1.53
Rochester School District New Hampshire 86%          1.65
Spalding County School District Georgia 86%          1.64
Campbell City School District Ohio 86%          1.61
Castleberry Independent School District Texas 86%          1.55
Connellsville Area School District Pennsylvania 86%          1.65
Fredericksburg City Public Schools Virginia 87%          2.81
Alta Vista Elementary School District California 87%          1.58
Paulsboro Borough School District New Jersey 87%          2.58
Chelsea School District Massachusetts 87%          2.17
Uniontown Area School District Pennsylvania 87%          1.86
Pleasant Valley School District 62 Illinois 88%          2.07
Everett School District Massachusetts 88%          2.52
Carbon Cliff-Barstow School District 36 Illinois 89%          2.14
Madison Public Schools Michigan 89%          2.02
Freehold Borough School District New Jersey 90%          2.44
Caldwell School District 132 Idaho 90%          1.85
Twin Lakes No. 4 School District Wisconsin 90%          1.67
Edinburgh Community School Corporation Indiana 90%          1.70
Riverview Gardens School District Missouri 90%          1.79
Independence Public Schools Missouri 91%          1.61
Hazel Park City School District Michigan 91%          1.88
Winooski Incorporated School District Vermont 91%          2.19
Carteret Borough School District New Jersey 91%          1.79
Penns Grove-Carneys Point Regional School District New Jersey 92%          1.51
Speedway School Town Indiana 92%          1.54
Hopewell City Public Schools Virginia 92%          2.00
Bound Brook Borough School District New Jersey 92%          1.73
New Britain School District Connecticut 92%          2.46
Somersworth School District New Hampshire 92%          1.62
Watervliet City School District New York 92%          1.57
Centennial School District 28J Oregon 92%          1.59
William Floyd Union Free School District New York 93%          1.92
Fountain School District 8 Colorado 93%          1.65
Lowell School District Massachusetts 93%          2.55
Lorain City School District Ohio 93%          1.95
St. Bernard Parish School District Louisiana 93%          1.64
Cahokia Community Unit School District 187 Illinois 93%          2.79
Northridge Local School District Ohio 93%          2.20
Hudson Falls Central School District New York 94%          1.62
Reynolds School District 7 Oregon 94%          1.84
Woodbury City School District New Jersey 94%          2.00
Aldine Independent School District Texas 94%          1.63
Bartonville School District 66 Illinois 94%          1.65
Westwood Heights Schools Michigan 95%          1.81
Hazel Crest School District 152-5 Illinois 95%          1.81
New Kensington-Arnold School District Pennsylvania 95%          1.59
Cascade Union Elementary School District California 95%          1.63
Malden School District Massachusetts 95%          2.29
Seabrook School District New Hampshire 96%          1.64
Lynn School District Massachusetts 96%          1.87
Newport Independent School District Kentucky 96%          1.91
River Forest Community School Corporation Indiana 96%          1.60
Willow Run Community Schools Michigan 96%          2.19
Big Beaver Falls Area School District Pennsylvania 96%          1.70
Norwood City School District Ohio 97%          1.69
Beecher Community School District Michigan 97%          2.31
Jennings School District Missouri 97%          2.06
Hammond School City Indiana 97%          1.55
Freeport Union Free School District New York 97%          2.17
Monessen City School District Pennsylvania 97%          1.83
Copiague Union Free School District New York 97%          1.87
McKeesport Area School District Pennsylvania 98%          2.07
Lawrence School District Massachusetts 98%          2.41
Covington Independent School District Kentucky 98%          2.37
Clinton School District Massachusetts 98%          2.26
Adams County School District 14 Colorado 98%          1.82
Beloit School District Wisconsin 99%          1.71
Brooklawn Borough School District New Jersey 99%          1.51
Oak Park City School District Michigan 99%          2.21
Lindenwold Borough School District New Jersey 99%          2.08
Bay Shore Union Free School District New York 99%          1.88

Data Sources: Based on Census Fiscal Survey (f33) 2008-09 [http://www.census.gov/govs/school/] and Census Small Area Income and Poverty Estimates

Now, it’s one thing for reformy pundits to be making the absurd arguments I laid out in the introduction above. They simply don’t know crap about any of this stuff. I’m convinced of that. They simply don’t know what districts spend, how it compares to other districts – or even that school finance is primarily a state by state issue. Invariably, when speaking on issues of school funding, they make statements that are patently false – and most often passed down through the reformy bad graph archive.

What concerns me more is when local representatives of children attending these districts, including the superintendents of many of these school districts simply don’t stand up for their own constituents. Somehow, the solution for Philadelphia public schools is to close more of them? To shift more control to additional private managers? But to ignore entirely that Pennsylvania continues to maintain one of the least equitable state school finance systems in the country? The same applies to Chicago? Do we hear the City of Chicago’s leaders condemning the fact that Illinois also maintains one of the nation’s least fair funding systems? One of the nation’s most racially disparate state school finance systems?

I also don’t expect to see Governors of these states continue to point the finger of shame at these districts – and state departments of education continue to set up ill-conceived and unfair accountability systems and unfunded intervention strategies through new powers awarded to them under NCLB waivers.  When they do – if, for example, NY’s Governor Cuomo chooses to point the finger of shame at Utica (purely hypothetical), I sure as hell hope that Utica points right back! And I hope others including Schenectedy and Binghamton stand by their side. Likewise for Reading and Allentown, PA! These districts have been persistently slammed by their state school funding system. We are talking about districts that a) have 2.5 times the poverty rate of their surroundings and b) less than 80% of the state and local revenue.

And likewise for Bridgeport, CT along with New Britain and Waterbury! And what about Waukegan, IL… which by these measures has only about 68% of the average state and local revenue of their surroundings and nearly double the poverty rate!

Leaders in these cities should be outraged by their treatment under state school finance systems. We should be hearing it, and hearing it loudly. We shouldn’t just be hearing about how their incompetent and greedy teachers and administrators are to blame and how we need to simply shut down more of their schools and turn them over to someone else. Fairness in funding is a critical first step. It is a prerequisite condition. And without it, we can expect continued difficulties in these districts – difficulties that will certainly not be remedied by current slash/burn & blame policies.

Note: The analysis presented here is a preliminary run using a single year of national school finance data (but built on a 3-year panel). In several of these cases however, especially those that I call out individually, I have conducted numerous additional analyses which are consistent with those above. I can say with confidence that the Illinois, Pennsylvania, Connecticut and New York State disparities represented above are entirely consistent with analyses of multiple years of state data and federal data. Cities like Utica, NY, Bridgeport, Waterbury and New Britain CT, Allentown and Reading, PA are consistently among the worst funded districts relative to their state as a whole and their specific labor market surroundings. Riverview Gardens and other poor inner urban fringe St. Louis districts are also among the most disadvantaged, similar to low income, high-minority concentration Chicago suburbs. Texas and Colorado findings are also consistent. Others may be as well, but I’ve not yet had the chance to reconcile the findings for each city/state with state data systems.

Two Persistent Reformy Misrepresentations regarding VAM Estimates

I have written much on this blog about problems with the use of Value-added Estimates of teacher effect (used loosely) on student test score gains on this blog. I have addressed problems with both the reliability and validity of VAM estimates, and I have pointed out how SGP based estimates of student growth are invalid on their face for determining teacher effectiveness.

But, I keep hearing two common refrains from the uber-reformy (those completely oblivious to the statistics and research of VAM while also lacking any depth of understanding of the complexities of the social systems [schools] into which they propose to implement VAM as a de-selection tool) crowd. Sadly, these are the people who seem to be drafting policies these days.

Here are the persistent misrepresentations:

Misrepresentation #1: That this reliability and error stuff only makes it hard for us to distinguish among all those teachers clustered in the middle of the distribution. BUT… we can certainly be confident about those at the extremes of the distribution.  We know who the really good and really bad teachers are based on their VAM estimates.

WRONG!

This would possibly be a reasonable assertion if reliability and error rates were the only problem. But this statement ignores entirely the issue of omitted variables bias (other stuff that affects teacher effect estimates that may have been missed in the model), and just how much those observations in the tails jump around when we tweak the VAM by adding or removing variables, or rescaling measures.

A recent paper by Dale Ballou & colleagues illustrates this problem:

“In this paper, we consider the impact of omitted variables on teachers’ value-added estimates, and whether commonly used single-equation or two-stage estimates are preferable when possibly important covariates are not available for inclusion in the value-added model. The findings indicate that these modeling choices can significantly influence outcomes for individual teachers, particularly those in the tails of the performance distribution who are most likely to be targeted by high-stakes policies.” (Ballou et al., 2012) [emphasis added]

The problem is that we can never know when we’ve got that model specification just right. Further, while we might be able to run checks as to whether the model estimates display bias with respect to measurable external factors, we can’t know if there is bias with respect to stuff we can’t measure, nor can we always tell if there are clusters of teachers in our model whose effectiveness estimates are biased in one direction and other clusters in another direction (also in relation to stuff unmeasured).  That is, we can only test this omitted variables bias stuff when we can add in and take out measures that we have. We simply don’t know how much bias remains due to all sorts of other unmeasured stuff, nor do we know just how much that bias may affect many of those distributions in the tails!

Misrepresentation #2: We may be having difficulty in these early stages of estimating and using VAM models to determine teacher effectiveness, but these are just early development problems that will be cleared up with better models, better data and better tests.

WRONG AGAIN!

Quite possibly, what we are seeing now is as good as it gets.  Keep in mind that many of the often cited papers applying the value-added methodology date back to the mid-1990s. Yeah…. we’ve been at this for a while and we’ve got what we’ve got!

Consider the sources of the problems with the reliability and validity of VAM estimates, or in other words:

The sources of random error and/or noise in VAM estimates

Random error in testing data can be a function of undetected and uncorrected poorly designed test items, such as items with no correct response or more than one correct response, testing conditions/disruptions, and kids being kids – making goofy errors such as filling in the wrong bubble (or toggling the wrong box in computerized testing) or simply having a brain fart on stuff they probably otherwise knew quite well. We’re talking about large groups of 8 and 9 year old kids in some cases, in physically uncomfortable settings, under stress, with numerous potential distractions.

Do we really think all of these sources of noise are going to go away? Substantively improve over time? Testing technology gains only have a small chance at marginally improving some of these. I hope to see those improvements. But it’s a drop in the bucket when it comes to the usefulness, reliability and validity of VAM estimates.

The factors other than the teacher which may influence the average test score gain of students linked to that teacher

First and foremost, kids simply aren’t randomly sorted across teachers and the various ways in which kids aren’t randomly sorted (by socioeconomic status, by disability status, by parental and/or child motivation level) substantively influence VAM estimates. As mentioned above, we can never know how much the unmeasured stuff influences the VAM estimates.  Why? It’s unmeasured!

Second, teachers aren’t randomly sorted among teaching peers and VAM studies have shown what appear to be spillover effects – where teachers seem to get higher VAM estimates when other teachers serving the same students get higher VAM estimates.  Teacher aides, class sizes, lighting/heating/cooling aren’t randomly distributed and all of this stuff may matter.

And you know what?  This stuff isn’t going to change in the near future.  In fact, the more time we waste obsessing on the future of VAM-based de-selection policies instead of equitably and adequately financing our school systems, the more that equity of schooling conditions is going to erode across children, teachers, schools and districts – in ways that are very much non-random [uh… that means certain kids will get more screwed than others].  So perhaps our time would be much better spent trying to improve the equity of those conditions across children. Provide more parity in teacher compensation and working conditions, and better integrating/distributing student populations.

Look – if we were trying to set up an experiment or a program evaluation in which we wanted our VAM estimates to be most useful – least likely to be biased by unmeasured stuff – we would take whatever steps we could to achieve the “all else equal” requirement.  Translated to the non-experimental setting – applied in the real world – this all else equal requirement means that we actually have to concern ourselves with equality of teaching conditions – equality of the distribution of students by race, SES and other factors.  Yeah… that actually means equitable access to financial resources – equitable access to all sorts of stuff (including peer group).

In other words, we’d be required to exercise more care in establishing equality of conditions or explaining why we couldn’t if we were simply comparing program effectiveness for academic publication than the current reformy crowd is willing to exercise when deciding which teachers to fire. [then again, the problem is that they don’t seem to know the difference. Heck, some of them are still hanging their hopes on measures that aren’t even designed for the purpose !]

But this conversation is completely out-of-sight, out-of-mind for the uber-reformy crowd. That’s perhaps the most ludicrous part of all of this reformy VAM-pocrisy !  Ignoring the substantive changes to the education system that could actually improve the validity of VAM estimates by asserting that VAM estimates alone will do the job, which they couldn’t possibly do if we continue to ignore all this stuff!

Finally, one more reason why VAM estimates are unlikely to become more valid or more useful over time? Once we start using these models with high stakes attached, the tendency for the data to become more corrupted and less valid escalates exponentially!

By the way, VAM estimates don’t seem to be very useful for evaluating a) the effectiveness of teacher preparation programs [due to the non-random geographic distributions of graduates] or b) principals either! More on this at another point.

Note on VAM-based de-selection: Yeah… the uber-reformy types will argue that no-one is saying that VAM should be used 100% for teacher de-selection, and further that no-one is really even arguing for de-selection.  WRONG! AGAIN! As I discussed in a previous post, the standard reformy legislation template includes three basic features which essentially amount to using VAM (or even worse SGPs) as the primary basis for teacher de-selection – yes, de-selection. First, use of VAM estimates in a parallel weighting system with other components requires that VAM be considered even in the presence of a likely false positive. NY legislation prohibits a teacher from being rated highly if their test-based effectiveness estimate is low. Further, where VAM estimates vary more than other components, they will quite often be the tipping point – nearly 100% of the decision even if only 20% of the weight – and even where most of that variation is NOISE or BIAS… not even “real” effect (effect on test score growth). Second, the reformy template often requires (as does the TEACHNJ bill in NJ) that teachers be de-selected (or at least have their tenure revoked) after any two years in a row of falling on the wrong side of an arbitrary cut point rammed through these noisy data.

Finally, don’t give me the anything is better than the status quo crap!

Video Thoughts on Test Scores, VAM, SGP & Teacher Evaluation

Recent Bank Street College of Education Symposium on teacher evaluation

Additional video clips from legislative forum at the New Jersey Principals and Supervisors Association

General Issues in Teacher Evaluation: Where to Start in New Jersey

http://www.youtube.com/watch?v=5B7gAkB5-QU&feature=player_detailpage#t=1208s

Pilots versus Expedited Legislated Evaluation Models (Rigidity of Legislation)

http://www.youtube.com/watch?v=5B7gAkB5-QU&feature=player_detailpage#t=1878s

Complete Forum Video:

No Excuses! Really? Another look at our NEPC Charter Spending Figures

UPDATED MAY 11, 2012

Not surprisingly, KIPPs first response to our recent NEPC study was to declare it outright flawed. KIPP then proceeded to make up every possible explanation they could – every possible “excuse” – conjure every possible out of context – or different context estimate or “fact” to make their case that they in fact spend equal or less than schools in New York City and Houston.

I guess what continues to perplex me most is the stance that KIPP takes whenever anyone writes anything about them, in a report not sponsored by them or by one of their major funders (some of which are quite good).  Whether a descriptive analysis of attrition rates or our analysis of spending per pupil, KIPPs standard response is to deny, deny, deny.

We have not said anywhere in our report that there’s anything wrong with spending more to do a good job – run a good school. It would be preposterous for us to make such an assertion. We have simply tried to lay out a reasonable comparison of what schools are spending, compared to otherwise similar schools. These comparisons are appropriate, and are necessary for making judgments about any marginal benefits that might be achieved by students attending different schools.

We show that part of the KIPP puzzle in Houston is explained by their attempts to provide more competitive front end teacher wages. Nothin’ wrong with that! It’s certainly a logical recruitment/retention strategy. Notably, it would become difficult to maintain these margins as school staff matures. These are issues worth monitoring over time – to see if CMOs entering their second and third decades of operation can continue to hold expenses down by holding staff experience down, while still recruiting and retaining energetic, high quality teachers. I will likely be conducting more extensive analyses of these salary structures across KIPP and other schools in NYC and Texas in the future, and hope to have a more productive discussion on the topic when that time comes.

KIPP argues that we counted all of their centralized expenses against them, and counted NONE against the NYC public schools. This is not true. We actually didn’t count KIPP regional and national expenses that exist beyond what the locals pay in management fees accounted for on their budgets.

Second, as I will show below, even if we count all of the system-wide expenses (& other obligations) of NYC BOE schools, KIPP schools continue to substantially outspend them.

Further, KIPP complains that we include expenses on their KIPP to College program. It’s a program. It’s a support service. It’s an expenditure. Further, even the KIPP schools budgets that don’t include KIPP to college exceed NYC BOE spending. And KIPP plays the usual card, in reference to Houston, not NYC, that they must incur the full costs (from their operating expenses) of facilities, implying that public districts have absolutely no costs of facilities.

Clearly, such comparisons are complicated and we acknowledge as much throughout our paper. Further, we provide substantial detail as to the types of data being compared and potential issues with the comparisons.

New York City

Let’s look first at our New York City comparisons. The data in NYC are pretty good, but because the charter financial reports are not part of the same system as the district school site budgeting data, they are not necessarily designed to be directly comparable. We had removed system-wide costs from the NYC BOE schools, in addition to removing costs for facilities (because BOE also pays for charter facilities), food and transportation, and we removed payments to charters. KIPPs assertion is that clearly if we add back in all system-wide costs NYC BOE schools would be spending at least the same if not more than KIPP schools.  This is especially the case if, as KIPP asserts, that pension costs alone should add $2,200 per pupil to the BOE schools (this is a perfect example of a wrong context number extracted from a different comparison [a good one by IBO]).

Of course, this assertion doesn’t pass a basic smell test even given the information that already existed prior to our report. In the Independent Budget Office report which we cite, the IBO evaluated the comparability of the public subsidy rate of co-located (as with KIPP) charters and BOE schools, finding that the co-located charters had the equivalent subsidy of slightly higher than BOE schools on average district-wide. Note that subsidy rates aren’t expenditures. It’s a different comparison. But subsidy rates provide a starting point for what could be spent. And KIPP was ahead at the starting line, albeit only slightly.

Add to that, the fact that KIPP schools do not serve average special education populations, the major driver of differences in spending across BOE schools (as we validate). Thus, compared to these schools rather than average district-wide, KIPP moves further ahead. Then, I think we all understand by this point that KIPP raises and spends at least some private funding.  Fair enough? We’ve got two reports out on this:

  1. Baker, B.D. & Ferris, R. (2011). Adding Up the Spending: Fiscal Disparities and Philanthropy among New York City Charter Schools. Boulder, CO: National Education Policy Center. Retrieved [date] from http://nepc.colorado.edu/publication/NYC-charter-disparities.
  2. Baker, B.D., Libby, K., & Wiley, K. (2012). Spending by the Major Charter Management Organizations: Comparing charter school and local public district financial resources in New York, Ohio, and Texas. Boulder, CO: National Education Policy Center. Retrieved [date] from http://nepc.colorado.edu/publication/spending-major-charter.

Add their private spending to the already growing margin, and you’ve got a bigger margin of difference in per pupil spending between KIPP schools and otherwise similar NYC BOE schools. On its face, it’s highly suspect for KIPP to argue that they do not spend more than NYC BOE schools.

But, just for fun, let’s rerun the regressions from our report with all system-wide costs added back to BOE schools and see if that puts them ahead of KIPP spending.

Here’s the overall comparison:

Even after adding system-wide costs back into BOE schools, KIPP schools spend more than $3,000 per pupil more than BOE schools.

Now here are the breakout scatterplots, starting with our original:

And then with all system-wide costs added back in to BOE school:

Hmmm… seems that KIPP schools are still significantly outspending otherwise similar BOE schools – about 25% more.

Another really important point here is that none of these adjustments alter KIPP charter spending relative to the other charters. KIPP continues to outspend the other charters by as much as they did in our original analyses.

What we don’t include for KIPP

We don’t include regional (KIPP NY) or national expenditures above and beyond what is covered by the school management fees. We write extensively in Appendix C of our report about these additional expenditures and difficulty in parsing precisely how much was spent by KIPP regional and national organizations and what services were provided as in-kind services to schools. This is a potentially significant break that we give to KIPP, setting aside entirely their centralized costs of the organization (those above and beyond what is covered by management fees).

Texas

It was problematic enough for KIPP to assert that they spend similarly to NYC BOE schools, but it was surely a stretch to assert that they spend similarly to Houston ISD schools which have been significantly constrained under state school finance policies in recent years. KIPP first pulls the facilities cost card to make their case, as usual, implicitly assuming public district facilities to be free. We discuss this issue on Page 49 of our report (and in numerous other locations):

Charter advocates often argue that charters are most disadvantaged in financial comparisons because charters must often incur from their annual operating expenses, the expenses associated with leasing facilities space. Indeed it is true that charters are not afforded the ability to levy taxes to carry public debt to finance construction of facilities. But it is incorrect to assume when comparing expenditures that for traditional public schools, facilities are already paid for and have no associated costs, while charter schools must bear the burden of leasing at market rates – essentially and “all versus nothing” comparison. First, public districts do have ongoing maintenance and operations costs of facilities as well as payments on debt incurred for capital investment, including new construction and renovation. Second, charter schools finance their facilities by a variety of mechanisms, with many in New York City operating in space provided by the city, many charters nationwide operating in space fully financed with private philanthropy, and many holding lease agreements for privately or publicly owned facilities.

KIPP also argues that their per pupil spending figures are inflated due to spending for growth. Hey. That’s an expenditure. By the way, typically, per pupil expenditures rise with declining enrollment (as the denominator goes down). Yes, there might be scaling up expenditures, but they tend not to have dramatic effect on per pupil expenditures. If KIPP has chosen to pay for redundant administration, etc. in order to support scaling up, then so be it. That’s an expenditure. We would hope to see these expenses level off down the line with additional analyses. We’ll wait and see on that.

But, back to our actual comparisons in Houston. We used two different approaches in Texas. First of all, in Houston, KIPP spending per pupil was much closer than in other Texas cities, where KIPP spending totally blew away district schools spending. But back to Houston. Using current operating expenditures per pupil data for KIPP and Houston schools, we show that KIPP middle schools outspend not only otherwise similar schools in HISD, but the district-wide average operating expenditure per pupil.

Further, we show that KIPP total district (IRS 990) expenditures significantly exceed Houston ISD’s TOTAL REVENUE PER PUPIL, including revenue for retiring debt and maintenance of HISD’s large capital stock.

Here are additional figures not included in the report, comparable to the figure above for other cities in Texas where KIPP  operates. In each and every case, KIPP IRS 990 total expenditures per pupil EXCEED district TOTAL REVENUES PER PUPIL.

What we don’t include for KIPP

Again, we don’t attempt to figure out the additional expenses of KIPP national allocated to schools, above and beyond what is paid for from the local/regional KIPPs through management fees to the national organization.

Closing Thoughts

I encourage those interested in these topics to not only browse the abstract of our report, but to also dig deep into the appendices and end notes – which are as long as the report itself. Heck, follow the hyperlinks to the data sources and take your own stab at this stuff. That’s what we need out here – not more excuses and unfounded anecdotal arguments.

I actually hesitate to write about KIPP and perhaps that’s just what they want. Apparently no one should write about them that hasn’t been paid by them to write about the. Those who do should be forewarned that you’ll have to waste inordinate time responding to their complaints – excuses – about what you wrote. As of this post, I hope to be done with this topic.

Follow up on why Publicness/Privateness of Charter Schools Matters

My post the other day was intended to shed light on the various complexities of classifying charter schools as public or private. Some have argued that the distinctions I make are a distraction from the bigger policy issues. The point was not to address those issues, but rather to dispose of the misinformed rhetoric that charter schools are necessarily public in every way that traditional public schools are. They clearly are not. And the distinctions made in my previous post have important implications not only for teachers employment rights (or any school employee), but also for student rights. Further, it is really, really important that teachers considering their options and parents considering their options understand these distinctions and make fully informed choices.

Preston Green of Penn State University [co-author of Charter Schools and the Law] offered the following comments on my previous post:

Charter schools are always characterized as “public schools.” Many parents assume that they would receive the same constitutional rights in charter schools as other public schools. In fact, I use to think this.

My thinking changed when I spoke at a workshop for charter school attorneys. Several attorneys insisted that they were not beholden to federal constitutional and statutory provisions. They cited the Ninth Circuit’s Caviness decision, in which the Ninth Circuit held that a charter school was not a state actor with respect to employment issues. These attorneys insisted that the same logic applied to student issues as well.

This is especially concerning for black males. Researchers have consistently found that black male students are disproportionately subjected to school discipline, such as suspensions and expulsions. In public schools, the Due Process Clause protects them from arbitrary suspensions and expulsions. For example, in Pennslyvania,schools must provide students with an informal hearing for out-of-school suspensions from 4-10 days (22 Pennsylvania Code § 12.8, 2012). The school must provide parents with written notification of the time and the place of the hearing. The student has the write to speak and produce witnesses at the hearing as well as the right to question witnesses present at the hearing.

Pennsylvania regulations also require formal hearings for school exclusions of more than 10 days (22 Pennsylvania Code § 12.8, 2012). Formal hearings require the school to provide parents with a copy of the expulsion policy, notice that the student may obtain counsel, and the procedures for the expulsion hearing. The student has the power to cross-examine, testify, and present witnesses. Further, the school must maintain an audio recording of the hearing.

If charter schools are not public actors, then constitutional law would not apply. I have argued that courts might apply contract law, as is generally the case for private schools. If a private school “has clearly stated the rule, preferably in writing, and a parent chooses to have his or her child attend the school, a court will generally uphold the rule” (Shaughnessy, 2003, p. 527). For example, in Flint v. Augustine High School (1975), a Louisiana private school expelled two students for violating its no smoking policy. The school’s handbook called for a fine of $5 for the first offense, and a penalty of either a $10 fine or an expulsion for the second offense. The state court of appeals upheld the suspension of the students. In reaching this decision, the court declared that private institutions “have a near absolute right and power to control their own internal disciplinary procedure which, by its very nature, includes the right and power to dismiss students” (p. 234). Although the court allowed that due process protections could not “be cavalierly ignored or disregarded,” it held that “if there is color of due process – that is enough” (p. 235).

In Hernandez v. Bosco Preparatory High (1999), a New Jersey court for the first time addressed the question of the procedural rights of expelled private high school students. It found that constitutional law did not apply to private high schools. Interestingly, the court found that high school students would receive less protection than private university students.

I raise these points because parents may be unwittingly giving up their constitutional protections to attend charter schools. One has to wonder whether parents would enroll their children if they were aware of this possibility.

The distinction is important. And it’s a distinction that may occur at many levels of the system, as I explained in the previous post. Again, this is not to say that publicness/privateness necessarily speaks to substantive differences in school quality for children, or workplace quality for employees.  As I’ve mentioned numerous times on my blog, my best teaching job was at an elite private (no doubt, no ambiguity, private) school. My worst was at a different private school, with two public districts in between – one much better than the other. The issues of publicness/privateness proved inconsequential to me personally during my time as a teacher (mainly because I left the worst private school before I decided to engage in any [more] battles). But to others they may not, and it is important to understand the distinction. At least a few teachers in privately governed charter schools have already been blindsided by misinformed assumptions that they possess public employee protections.  Given the comments of Preston Green above, I suspect student rights cases are not far behind.

Charter Schools Are… [Public? Private? Neither? Both?]

…Directly Publicly Subsidized, Limited Public Access, Publicly or Privately Authorized, Publicly or Privately Governed, Managed and Operated Schools

Let’s break it down:

Directly publicly subsidized

Charter schools are directly subsidized by a combination of (primarily) state and local tax dollars (state dependent) transferred to charter schools on the basis of their enrollments.

This funding is analogous to a directly subsidized voucher program that would transfer tax dollars to private schools on the basis of students signing up for the voucher program.

This funding is also analogous to the state aid that is delivered on a pupil enrollment basis to local public school districts, but the funding is different from local tax dollars that are raised based on the values of taxable properties and are not dependent on pupil enrollments.

Note that traditional public schools or charter schools may receive a variety of non-government (non-taxpayer supported) revenues including private gifts, private foundation grants, fees/event receipts, facilities rental, etc.

The direct subsidy for charters is distinctly different from indirect subsidies like tuition tax credits, which provide the opportunity for individuals or other entities to receive a full tax credit for donating funds to an independently operated/managed entity which then distributes those funds as vouchers or scholarships.

An important legal distinction is that the U.S. Supreme Court has recently decided that when tuition tax credit funds are used to support religious education, taxpayers have no standing to challenge that distribution as a distribution of their tax dollars, due to the indirect nature of the subsidy. See: ARIZONA CHRISTIAN SCHOOL TUITION ORGANIZATION v. WINN

Limited Public Access

Charter schools are limited public access in the sense that:

  1. They can define the number of enrollment slots they wish to make available
  2. They can admit students only on an annual basis and do not have to take students mid-year
  3. They can set academic, behavior and cultural standards that promote exclusion of students via attrition.

[may vary and/or be restricted under state policies]

A traditional public school or “district school” or “government school” must accept students at any point during the year and but for specific disciplinary circumstances that may permit long term suspensions and expulsions. Traditional public schools cannot shed students who do not meet academic standards, comply with more general behavioral codes or social standards, such as parental obligations.

Imagine a community park, for example, that is paid for with tax dollars collected by all taxpayers in the community, and managed by a private board of directors. That board has determined that the park may reasonably serve only 100 of the community’s 1,000 residents. The amount of tax levied is adjusted for the park’s capacity. To determine who gets to use the park annually, interested residents subscribe to a lottery, where 100 are chosen each year. Others continue to pay the tax whether chosen for park access or not. The park has a big fence around it, and only those granted access through the lottery may gain entrance. Imagine also that each of the 100 lottery winners must sign a code of conduct to be unilaterally enforced by the private manager of the park. That management firm can establish its own procedures (or essentially have none) for determining who has or has not abided by the code of conduct and revoke access privileges unilaterally. This is clearly not a PUBLIC park in the way that scholars such as Paul Samuelson describe public goods.

Note that while public districts may limit slots to individual schools, especially magnets (which are clearly also limited public access), districts must accommodate all comers (a charter school operated by a district would be part of a system that is not limited in enrollment). That is, they cannot limit total slots in the district, regardless of physical plant constraints. Districts may also limit slots at schools through assignment policies and choice-based enrollment plans. But again, districts cannot limit total slots or mid-year access. This is an important difference between districts and charters. State laws may require that under-subscribed charters must admit students mid-year. But this requirement would not apply to those charters that are fully subscribed and/or have waiting lists.

Another note: Unlike a pure public good, both traditional public schools and a public park would be subject to diminishing value to each participant as they become overcrowded. That is, at some point, as additional individuals access the park or the school, it begins to diminish the value that each individual receives. So  even the more “public” park or school isn’t really a pure public good. My point here is that there are still substantive differences between traditional public schools and charter schools.

Put very simply, the ability to decide precisely how many students a school will serve, and wait list/deny others, makes charter schools significantly more limited than public school districts in their public access.

Save for another day the topic of restrictive real estate development and local public school districts.

Publicly or Privately Authorized [contingent on state policy]

States have varied policies regarding the entities that may grant charters for charter schools to commence (and continue) operations and draw on public tax dollars to serve children who subscribe. In some states, only government agencies themselves can authorize charter schools and therefore may also un-authorize them. In other states, statutes grant authority to private entities to grant and revoke charters. These private entities tend to be non-profit entities, including universities which may be quasi-public, governed by boards of directors that are private citizens, not elected government officials.

That boards of directors or governing bodies of authorizers are not public or elected officials is an important delineation. Indeed statutes may declare that they must comply with all statutes and regulations pertaining to public officials, but such requirements are not implicit.

The non-public, non-government status of governing boards of charter authorizers has significant legal implications regarding such issues as a) whether meetings are subject to open meetings laws, b) whether records are subject to open public records laws. Further, recourse for individuals – employees or students – against these private entities differs than it would if these entities were public.

Publicly or Privately Locally Governed [contingent on state policy]

States have varied policies regarding the local governance of charter schools, but many states require that the local governance of independently operated charters take the form of a board of directors which consists of self-appointed private citizens, not elected or appointed public officials. States also permit local public school districts to operate their own charter schools which remain under the authority of their local board of education which is either directly elected or consists of appointed government officials (usually mayoral appointments).

Again, the distinctions are important, having significant legal implications for taxpayers, students and employees.

As with authorizers, private boards of directors might invoke the claim that they are not subject to open meetings laws or open public records requirements. Unless explicitly stated in state charter laws, this argument might be accepted, since private boards of directors are not implicitly subject to these requirements.

Publicly or Privately Managed and Operated [contingent on state policy]

Finally, whether governed by the public officials of the local public school district, or by a board of directors of private citizens, those governing boards might choose to contract a private entity to manage and operate the school.

That entity might be the entity with which the employees of the school hold their contracts. This has significant implications for employee rights, as we have seen in the 9th circuit ruling in Caviness v. Horizon Community Learning Center. (teachers do not have certain legal recourse against private employers under Section 1983 of the U.S. Code which applies only to “state actors.”)

It also has implications for public access to information on teacher contractual agreements. Private managers of charter schools may invoke their private status, along with their private governing boards, to claim that teacher contracts are not subject to open public records requests, even though those teachers’ salaries are paid for with public tax dollars.

They may similarly invoke claims of their private status in limiting access to meetings. Again, unless explicitly stated to the contrary in state law, charter managers and their governing boards may succeed in avoiding disclosure.

Private managers of charter schools, and private boards governing charter schools may also choose to require student disciplinary codes and parental participation regulations and may invoke provisions in those codes which allow them to unilaterally dismiss parents or families (to the extent permissible under state charter laws). Because the managers and governing boards are not state actors, student and family recourse may be limited.

Scholars Preston C. Green, III, Erica Frankenberg et al. (Penn State University) have a forthcoming article discussing the implications of the Caviness decision regarding student rights in privately governed and managed charter schools. They note:

Although charter schools are frequently portrayed as “public schools,” a recent United States Court of Appeals decision, Caviness v. Horizon Learning Center (2010) suggests that charter schools may not have to provide constitutional protections for their students.  Therefore, contract law may apply to conflicts between charter schools and their students, as is the case in private schools.  Private schools have a great deal more latitude over disciplinary issues than public schools (Shaughnessy, 2003).

A few final thoughts…

These are important distinctions. They are not trivial.

Teachers choosing to sign contracts with private governing boards and/or managers of charter schools should understand that they likely do not have the rights of public employees, unless explicitly stated.

So too should parents of children attending privately governed and managed charter schools.

Further, so too should taxpayers and/or citizen/voters understand that depending on how the courts see it, and depending on whether charter laws are sufficiently detailed in their requirements, privately governed and privately managed charter schools may not be required to fully disclose financial documents pertaining to the expenditure of public funds, or to permit access to their meetings.

The fact that many state charter laws and federal regulatory references to charter schools refer to them as “public” is a hollow proclamation that has little legal or practical bearing on the more nuanced distinctions I address here.

Those who casually (belligerently & ignorantly) toss around the rhetoric that “charters are public schools” need to stop. This rhetoric misinforms parents, teachers and taxpayers regarding their rights, assumptions and expectations.

I’m under the impression that many teachers considering working for, or currently working for privately operated charters do not necessarily understand how their rights may differ from those of traditional public school teachers and I suspect the same is true for parents and students. That’s certainly not to say that all privately managed charter schools would take advantage of their increased latitude in negative ways. There are some good private management companies and perhaps some bad ones, just like there are good private schools and bad ones (I had the pleasure of working at one of each!).

Those who characterize charter schools as purely private also don’t fully capture the nuances laid out above, though some charters – by virtue of the many layers of organization laid out above and by virtue of emerging case law – may be moving in that direction.

Note that these legal debates over whether charter schools are state actors or private entities only come about because, when an issue is raised regarding open records or meetings, or employee or student rights, it is the lawyers for the charter school that invoke the claim that they are private entities. Like here! or here!   I surely hope those invoking their private status when legally convenient are not among those proclaiming their public status when politically convenient. You just can’t have it both ways.

If it’s not valid, reliability doesn’t matter so much! More on VAM-ing & SGP-ing Teacher Dismissal

This post includes a few more preliminary musings regarding the use of value-added measures and student growth percentiles for teacher evaluation, specifically for making high-stakes decisions, and especially in those cases where new statutes and regulations mandate rigid use/heavy emphasis on these measures, as I discussed in the previous post.

========

The recent release of New York City teacher value-added estimates to several media outlets stimulated much discussion about standard errors and statistical noise found in estimates of teacher effectiveness derived from the city’s value-added model.  But lost in that discussion was any emphasis on whether the predicted value-added measures were valid estimates of teacher effects to begin with.  That is, did they actually represent what they were intended to represent – the teacher’s influence on a true measure of student achievement, or learning growth while under that teacher’s tutelage.  As framed in teacher evaluation legislation, that measure is typically characterized as “student achievement growth,” and it is assumed that one can measure the influence of the teacher on “student achievement growth” in a particular content domain.

A brief note on the semantics versus the statistics and measurement in evaluation and accountability is in order.

At issue are policies involving teacher “evaluation” and more specifically evaluation of teacher effectiveness, where in cases of dismissal the evaluation objective is to identify particularly ineffective teachers.

In order to “evaluate” (assess, appraise, estimate) a teacher’s effectiveness with respect to student growth, one must be able to “infer” (deduce, conjecture, surmise…) that the teacher affected or could have affected that student growth. That is, for example, given one year’s bad rating, the teacher had sufficient information to understand how to improve her rating in the following year. Further, one must choose measures that provide some basis for such inference.

Inference and attribution (ascription, credit, designation) are not separable when evaluating teacher effectiveness. To make an inference about teacher effectiveness based on student achievement growth, one must attribute responsibility for that growth to the teacher.

In some cases, proponents of student growth percentiles alter their wording [in a truly annoying & dreadfully superficial way] for general public appeal to argue that:

  1. SGPs are a measure of student achievement growth.
  2. Student achievement growth is a primary objective of schooling.
  3. Therefore, teachers and schools should obviously be held accountable for student achievement growth.

Where accountable is a synonym for responsible, to the extent that SGPs were designed to separate the measurement of student growth from attribution of responsibility for it, then SGPs are also invalid on their face for holding teachers accountable.  For a teacher to be accountable for that growth it must be attributable to them and one must be using a method which permits such inference.

Allow me to reiterate this quote from the authors of SGP:

“The development of the Student Growth Percentile methodology was guided by Rubin et al’s (2004) admonition that VAM quantities are, at best, descriptive measures.” (Betebenner, Wenning & Briggs, 2011)

I will save for another day a discussion of the nuanced differences between statistical causation and inference and causation and inference as might be evaluated more broadly in the context of litigation over determination of teacher effectiveness.  The big problem in the current context, as I have explained in my previous post, is created by legislative attempts to attach strict timelines, absolute weights and precise classifications to data that simply cannot be applied in this way.

Major Validity Concerns

We identify[at least ]  3 categories of significant compromises to inference and attribution and therefore accountability for student achievement growth:

  1. The value-added estimate (or SGP) was influenced by something other than the teacher alone
  2. The value-added (or SGP) estimate given one assessment of the teacher’s content domain produces a different rating than the value-added estimate given a different assessment tool
  3. The value-added estimate (or SGP) is compromised by missing data and/or student mobility, disrupting the link between teacher and students. [the actual data link required for attribution]

The first major issue compromising attribution of responsibility for or inference regarding teacher effectiveness based on student growth is that some other factor or set of factors actually caused the student achievement growth or lack thereof. A particularly bothersome feature of many value-added models is that they rely on annual testing data. That is, student achievement growth is measured from April or May in one year to April or May in the next, where the school year runs from September to mid or late June.  As such, for example, the 4th grade teacher is assigned a rating based on children who attended her class from September to April (testing time), or about 7 months, where 2.5 months were spent doing any variety of other things, and another 2.5 months were spent with their prior grade teacher. Let alone the different access to resources each child has during their after school and weekend hours during the 7 months over which they have contact with their teacher of record.

Students with different access to summer and out-of-school time resources may not be randomly assigned across teachers within a given school or across schools within a district. And students who had prior year teachers who may have checked out versus the teacher who delved into the subsequent year’s curriculum during the post-testing month of the prior year may also not be randomly distributed. All of these factors go unobserved and unmeasured in the calculation of a teacher’s effectiveness, potentially severely compromising the validity of a teacher’s effectiveness estimate.  Summer learning varies widely across students by economic backgrounds (Alexander, Entwisle & Olsen, 2001) Further, in the recent Gates MET Studies (2010), the authors found: “The norm sample results imply that students improve their reading comprehension scores just as much (or more) between April and October as between October and April in the following grade. Scores may be rising as kids mature and get more practice outside of school.” (p. )

Numerous authors have conducted analyses revealing the problems of omitted variables bias and the non-random sorting of students across classrooms (Rothstein, 2011, 2010, 2009, Briggs & Domingue, 2011, Ballou et al., 2012). In short, some value-added models are better than others, in that by including additional explanatory measures, the models seem to correct for at least some biases. Omitted variables bias is where any given teacher’s predicted value is influenced partly by factors other than the teacher herself. That is, the estimate is higher or lower than it should be, because some other factor has influenced the estimate. Unfortunately, one can never really know if there are still additional factors that might be used to correct for that bias. Many such factors are simply unobservable. Others may be measurable and observable but are simply unavailable, or poorly measured in the data. While there are some methods which can substantially reduce the influence of unobservables on teacher effect estimates, those methods can typically only be applied to a very small subset of teachers within very large data sets.[2] In a recent conference paper, Ballou and colleagues evaluated the role of omitted variables bias in value-added models and the potential effects on personnel decisions. They concluded:

            “In this paper, we consider the impact of omitted variables on teachers’ value-added estimates, and whether commonly used single-equation or two-stage estimates are preferable when possibly important covariates are not available for inclusion in the value-added model. The findings indicate that these modeling choices can significantly influence outcomes for individual teachers, particularly those in the tails of the performance distribution who are most likely to be targeted by high-stakes policies.” (Ballou et al., 2012)

A related problem is the extent to which such biases may appear to be a wash, on the whole, across large data sets, but where specific circumstances or omitted variables may have rather severe effects on predicted values for specific teachers. To reiterate, these are not merely issues of instability or error. These are issues of whether the models are estimating the teacher’s effect on student outcomes, or the effect of something else on student outcomes. Teachers should not be dismissed for factors beyond their control. Further, statutes and regulations should not require that principals dismiss teachers or revoke their tenure in those cases where the principal understands intuitively that the teacher’s rating was compromised by some other cause. [as would be the case under the TEACHNJ Act]

Other factors which severely compromise inference and attribution, and thus validity, include the fact that the measured value-added gains of a teacher’s peers – or team members working with the same students – may be correlated, either because of unmeasured attributes of the students or because of spillover effects of working alongside more effective colleagues (one may never know) (Koedel, 2009, Jackson & Bruegmann, 2009). Further, there may simply be differences across classrooms or school settings that remain correlated with effectiveness ratings that simply were not fully captured by the statistical models.

Significant evidence of bias plagued the value-added model estimated for the Los Angeles Times in 2010, including significant patterns of racial disparities in teacher ratings both by the race of the student served and by the race of the teachers (see Green, Baker and Oluwole, 2012). These model biases raise the possibility that Title VII disparate impact claims might also be filed by teachers dismissed on the basis of their value-added estimates.  Additional analyses of the data, including richer models using additional variables mitigated substantial portions of the bias in the LA Times models (Briggs & Domingue, 2010).

A handful of studies have also found that teacher ratings vary significantly, even for the same subject area, if different assessments of that subject are used. If a teacher is broadly responsible for effectively teaching in their subject area, and not the specific content of any one test, different results from different tests raise additional validity concerns. Which test better represents the teacher’s responsibilities? [must we specify which test counts/matters/represents those responsibilities in teacher contracts?]  If more than one, in what proportions? If results from different tests completely counterbalance, how is one to determine the teacher’s true effectiveness in their subject area? Using data on two different assessments used in Houston Independent School District, Corcoran and Jennings (2010) find:

[A]mong those who ranked in the top category (5) on the TAKS reading test, more than 17 percent ranked among the lowest two categories on the Stanford test. Similarly, more than 15 percent of the lowest value-added teachers on the TAKS were in the highest two categories on the Stanford.

The Gates Foundation Measures of Effective Teaching Project also evaluated consistency of teacher ratings produced on different assessments of mathematics achievement. In a review of the Gates findings, Rothstein (2010) explained:

 The data suggest that more than 20% of teachers in the bottom quarter of the state test math distribution (and more than 30% of those in the bottom quarter for ELA) are in the top half of the alternative assessment distribution.(p. 5)

And:

In other words, teacher evaluations based on observed state test outcomes are only slightly better than coin tosses at identifying teachers whose students perform unusually well or badly on assessments of conceptual understanding.(p. 5)

Finally, student mobility, missing data, and algorithms for accounting for that missing data can severely compromise inferences regarding teacher effectiveness.  Corcoran (2010) explains that the extent of missing data can be quite large and can vary by student type:

Because of high rates of student mobility in this [Houston] population (in addition to test exemption and absenteeism), the percentage of students who have both a current and prior year test score – a prerequisite for value-added – is even lower (see Figure 6). Among all grade four to six students in HISD, only 66 percent had both of these scores, a fraction that falls to 62 percent for Black students, 47 percent for ESL students, and 41 percent for recent immigrants.” (Corcoran, 2010, p.20- 21)

Thus, many teacher effectiveness ratings would be based on significantly incomplete information, and further, the extent to which that information is incomplete would be highly dependent on the types of students served by the teacher.

One statistical resolution to this problem is imputation. In effect, imputation creates pre-test or post-test scores for those students who weren’t there. One approach is to use the average score for students who were there, or more precisely for otherwise similar students who were there. On its face imputation is problematic when it comes to attribution of responsibility for student outcomes to the teacher, if some of those outcomes are statistically generated for students who were not even there. But not using imputation may lead to estimates of effectiveness that are severely biased, especially when there is so much missing data. Howard Wainer (2011) esteemed statistician and measurement expert formerly with Educational Testing Service (ETS) explains somewhat mockingly how teachers might game imputation of missing data by sending all of their best students on a field trip during fall testing days, and then, in the name of fairness, sending the weakest students on a field trip during spring testing days.[3] Clearly, in such a case of gaming, the predicted value-added assigned to the teacher as a function of the average scores of low performing students at the beginning of the year (while their high performing classmates were on their trip), and high performing ones at the end of the year (while their low performing classmates were on their trip), would not be correctly attributed to the teacher’s actual teaching effectiveness, though it might be attributable to the teacher’s ability to game the system.

In short, validity concerns are at least as great as reliability concerns, if not greater. If a measure is simply not valid, it really doesn’t matter whether it is reliable or not.

If a measure cannot be used to validly infer teacher effectiveness, cannot be used to attribute responsibility for student achievement growth to the teacher, then that measure is highly suspect as a basis for high stakes decisions making when evaluating teacher (or teaching) effectiveness or for teacher and school accountability systems more generally.

References & Additional Readings

Alexander, K.L, Entwisle, D.R., Olsen, L.S. (2001) Schools, Achievement and Inequality: A Seasonal Perspective. Educational Evaluation and Policy Analysis 23 (2) 171-191

Ballou, D., Mokher, C.G., Cavaluzzo, L. (2012) Using Value-Added Assessment for Personnel Decisions: How Omitted Variables and Model Specification Influence Teachers’ Outcomes. Annual Meeting of the Association for Education Finance and Policy. Boston, MA.  http://aefpweb.org/sites/default/files/webform/AEFP-Using%20VAM%20for%20personnel%20decisions_02-29-12.docx

Ballou, D. (2012). Review of “The Long-Term Impacts of Teachers: Teacher Value-Added and Student Outcomes in Adulthood.” Boulder, CO: National Education Policy Center. Retrieved [date] from http://nepc.colorado.edu/thinktank/review-long-term-impacts

Baker, E.L., Barton, P.E., Darling-Hammong, L., Haertel, E., Ladd, H.F., Linn, R.L., Ravitch, D., Rothstein, R., Shavelson, R.J., Shepard, L.A. (2010) Problems with the Use of Student Test Scores to Evaluate Teachers. Washington, DC: Economic Policy Institute.  http://epi.3cdn.net/724cd9a1eb91c40ff0_hwm6iij90.pdf

Betebenner, D., Wenning, R.J., Briggs, D.C. (2011) Student Growth Percentiles and Shoe Leather. http://www.ednewscolorado.org/2011/09/13/24400-student-growth-percentiles-and-shoe-leather

Boyd, D.J., Lankford, H., Loeb, S., & Wyckoff, J.H. (July, 2010). Teacher layoffs: An empirical illustration of seniority vs. measures of effectiveness. Brief 12. National Center for Evaluation of Longitudinal Data in Education Research. Washington, DC: The Urban Institute.

Briggs, D., Betebenner, D., (2009) Is student achievement scale dependent? Paper  presented at the invited symposium Measuring and Evaluating Changes in Student Achievement: A Conversation about Technical and Conceptual Issues at the annual meeting of the National Council for Measurement in Education, San Diego, CA, April 14, 2009. http://dirwww.colorado.edu/education/faculty/derekbriggs/Docs/Briggs_Weeks_Is%20Growth%20in%20Student%20Achievement%20Scale%20Dependent.pdf

Briggs, D. & Domingue, B. (2011). Due Diligence and the Evaluation of Teachers: A review of the value-added analysis underlying the effectiveness rankings of Los Angeles Unified School District teachers by the Los Angeles Times. Boulder, CO: National Education Policy Center. Retrieved [date] from http://nepc.colorado.edu/publication/due-diligence.

Budden, R. (2010) How Effective Are Los Angeles Elementary Teachers and Schools?, Aug. 2010, available at http://www.latimes.com/media/acrobat/2010-08/55538493.pdf.

Braun, H, Chudowsky, N, & Koenig, J (eds). (2010) Getting value out of value-added. Report of a Workshop. Washington, DC: National Research Council, National Academies Press.

Braun, H. I. (2005). Using student progress to evaluate teachers: A primer on value-added models. Princeton, NJ: Educational Testing Service. Retrieved February, 27, 2008.

Chetty, R., Friedman, J., Rockoff, J. (2011) The Long Term Impacts of Teachers: Teacher Value Added and Student outcomes in Adulthood. NBER Working Paper # 17699 http://www.nber.org/papers/w17699

Clotfelter, C., Ladd, H.F., Vigdor, J. (2005)  Who Teaches Whom? Race and the distribution of Novice Teachers. Economics of Education Review 24 (4) 377-392

Clotfelter, C., Glennie, E. Ladd, H., & Vigdor, J. (2008). Would higher salaries keep teachers in high-poverty schools? Evidence from a policy intervention in North Carolina. Journal of Public Economics 92, 1352-70.

Corcoran, S.P. (2010) Can Teachers Be Evaluated by their Students’ Test Scores? Should they Be? The Use of Value Added Measures of Teacher Effectiveness in Policy and Practice. Annenberg Institute for School Reform. http://annenberginstitute.org/pdf/valueaddedreport.pdf

Corcoran, S.P. (2011) Presentation at the Institute for Research on Poverty Summer Workshop: Teacher Effectiveness on High- and Low-Stakes Tests (Apr. 10, 2011), available at https://files.nyu.edu/sc129/public/papers/corcoran_jennings_beveridge_2011_wkg_teacher_effects.pdf.

Corcoran, Sean P., Jennifer L. Jennings, and Andrew A. Beveridge. 2010. “Teacher Effectiveness on High- and Low-Stakes Tests.” Paper presented at the Institute for Research on Poverty summer workshop, Madison, WI.

D.C. Pub. Sch., IMPACT Guidebooks (2011), available at http://dcps.dc.gov/portal/site/DCPS/menuitem.06de50edb2b17a932c69621014f62010/?vgnextoid=b00b64505ddc3210VgnVCM1000007e6f0201RCRD.

Education Trust (2011) Fact Sheet- Teacher Quality. Washington, DC. http://www.edtrust.org/sites/edtrust.org/files/Ed%20Trust%20Facts%20on%20Teacher%20Equity_0.pdf

Hanushek, E.A., Rivkin, S.G., (2010) Presentation for the American Economic Association: Generalizations about Using Value-Added Measures of Teacher Quality 8 (Jan. 3-5, 2010), available at http://www.utdallas.edu/research/tsp-erc/pdf/jrnl_hanushek_rivkin_2010_teacher_quality.pdf

Working with Teachers to Develop Fair and Reliable Measures of Effective Teaching. MET Project White Paper. Seattle, Washington: Bill & Melinda Gates Foundation, 1. Retrieved December 16, 2010, from http://www.metproject.org/downloads/met-framing-paper.pdf.

Learning about Teaching: Initial Findings from the Measures of Effective Teaching Project. MET Project Research Paper. Seattle, Washington: Bill & Melinda Gates Foundation. Retrieved December 16, 2010, from http://www.metproject.org/downloads/Preliminary_Findings-Research_Paper.pdf.

Jackson, C.K., Bruegmann, E. (2009) Teaching Students and Teaching Each Other: The Importance of Peer Learning for Teachers. American Economic Journal: Applied Economics 1(4): 85–108

Kane, T., Staiger, D., (2008) Estimating Teacher Impacts on Student Achievement: An Experimental Evaluation. NBER Working Paper #16407 http://www.nber.org/papers/w14607

Koedel, C. (2009) An Empirical Analysis of Teacher Spillover Effects in Secondary School. 28 (6 ) 682-692

Koedel, C., & Betts, J. R. (2009). Does student sorting invalidate value-added models of teacher effectiveness? An extended analysis of the Rothstein critique. Working Paper.

Jacob, B. & Lefgren, L. (2008). Can principals identify effective teachers? Evidence on subjective performance evaluation in education. Journal of Labor Economics. 26(1), 101-36.

Sass, T.R., (2008) The Stability of Value-Added Measures of Teacher Quality and Implications for Teacher Compensation Policy. National Center for Analysis of Longitudinal Data in Educational Research. Policy Brief #4. http://eric.ed.gov/PDFS/ED508273.pdf

McCaffrey, D. F., Lockwood, J. R, Koretz, & Hamilton, L. (2003). Evaluating value-added models for teacher accountability. RAND Research Report prepared for the Carnegie Corporation.

McCaffrey, D. F., Lockwood, J. R., Koretz, D., Louis, T. A., & Hamilton, L. (2004). Models for value-added modeling of teacher effects. Journal of Educational and Behavioral Statistics, 29(1), 67.

Rothstein, J. (2011). Review of “Learning About Teaching: Initial Findings from the Measures of Effective Teaching Project.” Boulder, CO: National Education Policy Center. Retrieved [date] from http://nepc.colorado.edu/thinktank/review-learning-about-teaching.

Rothstein, J. (2009). Student sorting and bias in value-added estimation: Selection on observables and unobservables. Education Finance and Policy, 4(4), 537–571.

Rothstein, J. (2010). Teacher Quality in Educational Production: Tracking, Decay, and Student Achievement. Quarterly Journal of Economics, 125(1), 175–214.

Sanders, W. L., Saxton, A. M., & Horn, S. P. (1997). The Tennessee Value-Added Assessment System: A quantitative outcomes-based approach to educational assessment. In J. Millman (Ed.), Grading teachers, grading schools: Is student achievement a valid measure? (pp. 137-162). Thousand Oaks, CA: Corwin Press.

Sanders, William L., Rivers, June C., 1996. Cumulative and residual effects of teachers on future student academic  achievement. Knoxville: University of Tennessee Value- Added Research and Assessment Center.

Sass, T.R. (2008) The Stability of Value-Added Measures of Teacher Quality and Implications for Teacher Compensation Policy. Urban Institute http://www.urban.org/UploadedPDF/1001266_stabilityofvalue.pdf

McCaffrey, D.F., Sass, T.R., Lockwood, J.R., Mihaly, K. (2009) The Intertemporal Variability of Teacher Effect Estimates. Education Finance and Policy 4 (4) 572-606

McCaffrey, D.F., Lockwood, J.R. (2011) Missing Data in Value Added Modeling of Teacher Effects. Annals of Applied Statistics 5 (2A) 773-797

Reardon, S. F. & Raudenbush, S. W. (2009). Assumptions of value-added models for estimating school effects. Education Finance and Policy, 4(4), 492–519.

Rubin, D. B., Stuart, E. A., and Zanutto, E. L. (2004). A potential outcomes view of value-added assessment in education. Journal of Educational and Behavioral Statistics, 29(1):103–116.

Schochet, P.Z., Chiang, H.S. (2010) Error Rates in Measuring Teacher and School Performance Based on Student Test Score Gains. Institute for Education Sciences, U.S. Department of Education. http://ies.ed.gov/ncee/pubs/20104004/pdf/20104004.pdf.


The Toxic Trifecta, Bad Measurement & Evolving Teacher Evaluation Policies

This post contains my preliminary thoughts in development for a forthcoming article dealing with the intersection between statistical and measurement issues in teacher evaluation and teachers’ constitutional rights where those measures are used for making high stakes decisions.

The Toxic Trifecta in Current Legislative Models for Teacher Evaluation

A relatively consistent legislative framework for teacher evaluation has evolved across states in the past few years.  Many of the legal concerns that arise do so because of inflexible, arbitrary and often ill-conceived yet standard components of this legislative template. There exist three basic features of the standard model, each of which is problematic on its own regard, and those problems become multiplied when used in combination.

First, the standard evaluation model proposed in legislation requires that objective measures of student achievement growth necessarily be considered in a weighting system of parallel components. Student achievement growth measures are assigned, for example, a 40 or 50% weight alongside observation and other evaluation measures. Placing the measures alongside one another in a weighting scheme assumes all measures in the scheme to be of equal validity and reliability but of varied importance (utility) – varied weight. Each measure must be included, and must be assigned the prescribed weight – with no opportunity to question the validity of any measure. [1] Such a system also assumes that the various measures included in the system are each scaled such that they can vary to similar degrees. That is, that the observational evaluations will be scaled to produce similar variation to the student growth measures, and that the variance in both measures is equally valid – not compromised by random error or bias. In fact, however, it remains highly likely that some components of the teacher evaluation model will vary far more than others if by no other reasons than that some measures contain more random noise than others or that some of the variation is attributable to factors beyond the teachers’ control. Regardless of the assigned weights and regardless of the cause of the variation (true or false measure) the measure that varies more will carry more weight in the final classification of the teacher as effective or not. In a system that places differential weight, but assumes equal validity across measures, even if the student achievement growth component is only a minority share of the weight, it may easily become the primary tipping point in most high stakes personnel decisions.

Second, the standard evaluation model proposed in legislation requires that teachers be placed into effectiveness categories by assigning arbitrary numerical cutoffs to the aggregated weighted evaluation components. That is, a teacher in the 25%ile or lower when combining all evaluation components might be assigned a rating of “ineffective,” whereas the teacher at the 26%ile might be labeled effective.  Further, the teacher’s placement into these groupings may largely if not entirely hinge on their rating in the student achievement growth component of their evaluation. Teachers on either side of the arbitrary cutoff are undoubtedly statistically no different from one another. In many cases as with the recently released teacher effectiveness estimates on New York City teachers, the error ranges for the teacher percentile ranks have been on the order of 35%ile points (on average, up to 50% with one year of data). Assuming that there is any real difference between the teacher at the 25%ile and 26%ile (as their point estimate) is a huge unwarranted stretch. Placing an arbitrary, rigid, cut-off score into such noisy measures makes distinctions that simply cannot be justified especially when making high stakes employment decisions.

Third, the standard evaluation model proposed in legislation places exact timelines on the conditions for removal of tenure. Typical legislation dictates that teacher tenure either can or must be revoked and the teacher dismissed after 2 consecutive years of being rated ineffective (where tenure can only be achieved after 3 consecutive years of being rate effective).[2] As such, whether a teacher rightly or wrongly falls just below or just above the arbitrary cut-offs that define performance categories may have relatively inflexible consequences.

The Forced Choice between “Bad” Measures and “Wrong” Ones

Two separate camps have recently emerged in state policy regarding development and application of measures of student achievement growth to be used in newly adopted teacher evaluation systems. The first general category of methods is known as value-added models and the second as student growth percentiles. Among researchers it is well understood that these are substantively different measures by their design, one being a possible component of the other. But these measures and their potential uses have been conflated by policymakers wishing to expedite implementation of new teacher evaluation policies and pilot programs.

Arguably, one reason for the increasing popularity of the student growth percentile (SGP) approach across states is the extent of highly publicized scrutiny and large and growing body of empirical research over problems with using value-added measures for determining teacher effectiveness (See Green, Baker and Oluwole, 2012). Yet, there has been little such research on the usefulness of student growth percentiles for determining teacher effectiveness. The reason for this vacuum is not that student growth percentiles are simply not susceptible to the problems of value-added models, but that researchers have chosen not to evaluate their validity for this purpose – estimating teacher effectiveness – because they are not designed to infer teacher effectiveness.

A value added estimate uses assessment data in the context of a statistical model (regression analysis), where the objective is to estimate the extent to which a student having a specific teacher or attending a specific school influences that student’s difference in score from the beginning of the year to the end of the year – or period of treatment (in school or with teacher). The most thorough of VAMs attempt to account for several prior year test scores (to account for the extent that having a certain teacher alters a child’s trajectory), classroom level mix of students, individual student background characteristics, and possibly school characteristics. The goal is to identify most accurately the share of the student’s or group of students’ value-added that should be attributed to the teacher as opposed to other factors outside of the teachers’ control.

By contrast, a student growth percentile is a descriptive measure of the relative change of a student’s performance compared to that of all students and based on a given underlying test or set of tests. That is, the individual scores obtained on these underlying tests are used to construct an index of student growth, where the median student, for example, may serve as a baseline for comparison. Some students have achievement growth on the underlying tests that is greater than the median student, while others have growth from one test to the next that is less. That is, the approach estimates not how much the underlying scores changed, but how much the student moved within the mix of other students taking the same assessments, using a method called quantile regression to estimate the rarity that a child falls in her current position in the distribution, given her past position in the distribution.[3]  Student growth percentile measures may be used to characterize each individual student’s growth, or may be aggregated to the classroom level or school level, and/or across children who started at similar points in the distribution to attempt to characterize collective growth of groups of students.

Many, if not most value-added models also involve normative rescaling of student achievement data, measuring in relative terms how much individual students or groups of students have moved within the large mix of students. The key difference is that the value-added models include other factors in an attempt to identify the extent to which having a specific teacher contributed to that growth, whereas student growth percentiles are simply a descriptive measure of the growth itself. A student growth percentile measure could be used in a value-added model.

As described by the authors of the Colorado Growth Model:

A primary purpose in the development of the Colorado Growth Model (Student Growth Percentiles/SGPs) was to distinguish the measure from the use: To separate the description of student progress (the SGP) from the attribution of responsibility for that progress.” (Betebenner, Wenning & Briggs, 2011)

Unlike value-added teacher effect estimates, student growth percentiles are not intended for attribution of responsibility for student progress to either the teacher or the school.  But if that is so clearly the case (as recently stated as Fall, 2011) is it plausible that states or local school districts will actually choose to use the measures to make inferences? Below is a brief explanation from a Q&A section of the New Jersey Department of Education web site regarding implementation of pilot teacher evaluation programs:

Standardized test scores are not available for every subject or grade. For those that exist (Math and English Language Arts teachers of grades 4-8), Student Growth Percentages (SGPs), which require pre- and post-assessments, will be used. The SGPs should account for 35%-45% of evaluations.  The NJDOE will work with pilot districts to determine how student achievement will be measured in non-tested subjects and grades.[4]

This explanation clearly indicates that student growth percentile data are to be used for “evaluation” of teacher effectiveness. In fact, the SGPs alone, as they stand, as descriptive measures “should be used to account for 35% to 45% of evaluations.” Other states including Colorado have already adopted (pioneered) the use of Student Growth Percentiles as a statewide accountability measure and have concurrently passed high stakes teacher evaluation legislation. But it remains to be seen how the SGP data will be used in district specific contexts in guiding high stakes decisions.

While value-added models are intended estimate teacher effects on student achievement growth, they fail to do so in any accurate or precise way (see Green, Oluwole & Baker, 2012). By contrast, student growth percentiles make no such attempt.[5]  Specifically, value-added measures tend to be highly unstable from year to year, and have very wide error ranges when applied to individual teachers, making confident distinctions between “good” and “bad” teachers difficult if not impossible. Further, while value-added models attempt to isolate that portion of student achievement growth that is caused by having a specific teacher they often fail to do so and it is difficult if not impossible to discern a) how much they have failed and b) in which direction for which teachers. That is, the individual teacher estimates may be biased by factors not fully addressed in the models, and we may not know how much. We also know that when different tests are used for the same content, teacher receive widely varied ratings raising additional questions about the validity of the measures.

While we do not have similar information from existing research on student growth percentiles, it stands to reason that since they are based on the same types of testing data, they will be similarly susceptible to error and noise. But more problematically, since student growth percentiles make no attempt (by design) to consider other factors that contribute to student achievement growth, the measures have significant potential for omitted variables bias.  SGPs leave the interpreter of the data to naively infer (by omission) that all growth among students in the classroom of a given teacher must be associated with that teacher. Even subtle changes to explanatory variables in value-added models change substantively the ratings of individual teachers (Ballou et al., 2012, Briggs & Domingue, 2010). Excluding all potential explanatory variables, as do SGPs, takes this problem to the extreme. As a result, it may turn out that SGP measures at the teacher level appear more stable from year to year than value-added estimates, but that stability may be entirely a function of teachers serving similar populations of students from year to year. That is, the measures may contain stable omitted variables bias, and thus may be stable in their invalidity.

In defense of Student Growth Percentiles as accountability measures but with no mention of their use for teacher evaluation, Betebenner, Wenning and Briggs (2011) explain that one school of thought is that value-added estimates are also most reasonably interpreted as descriptive measures, and should not be used to infer teacher or school effectiveness:

“The development of the Student Growth Percentile methodology was guided by Rubin et al’s (2004) admonition that VAM quantities are, at best, descriptive measures.” (Betebenner, Wenning & Briggs, 2011)

Rubin et al explain:

“Value-added assessment is a complex issue, and we appreciate the efforts of Ballou et al. (2004), McCaffrey et al. (2004) and Tekwe et al. (2004). However, we do not think that their analyses are estimating causal quantities, except under extreme and unrealistic assumptions. We argue that models such as these should not be seen as estimating causal effects of teachers or schools, but rather as providing descriptive measures.” (Rubin et al., 2004)

Arguably, these explanations do less to validate the usefulness of Student Growth Percentiles as accountability measures (inferring attribution and/or responsibility to schools and teachers) and far more to invalidate the usefulness of both Student Growth Percentiles and Value-Added Models for these purposes.

New Jersey’s TEACHNJ: At The Intersection of the Toxic Trifecta and “Wrong” Measures

A short while back, John Mooney over at NJ Spotlight provided an overview of a pending bill in the New Jersey legislature which just so happens to contain explicitly at least two out of three of the elements of the Toxic Trifecta and contains the third implicitly by granting deference to the NJ Department of Education to approve the quantitative measures used in evaluation systems.

Text of the Bill: http://www.njleg.state.nj.us/2012/Bills/S0500/407_I1.PDF

First, the bill throughout refers to the creation of performance categories as discussed above, implicitly if not explicitly declaring those categories to be absolute, clearly defined and fully differentiable from one another.

Second, while the bill is not explicit in its requirement of specific quantified performance metrics the bill grants latitude on this matter to the NJ Department of Education (to approve local plans) which a) is developing a student growth percentile model to be used for these purposes, and b) under its pilot plan is suggesting (if not requiring) that districts use the student growth percentile data for 35 to 45% of evaluations, as noted above.

Third, the bill places an absolute and inflexible timeline on dismissal:

Notwithstanding any provision of law to the contrary, the principal, in consultation with the panel, shall revoke the tenure granted to an employee in the position of teacher, assistant principal, or vice-principal if the employee is evaluated as ineffective in two consecutive annual evaluations. (p. 10)

The key word here is “shall” which indicates a statutory obligation to revoke tenure. It does not say “may,” or “at the principal’s discretion.” It says shall.

The principal shall revoke tenure if a teacher is unlucky enough to land below an arbitrary cut-point, using a measure not designed for such purposes, for two years in a row. (even if the teacher was lucky enough to achieve an “awesome” rating every other year of her career!)

The kicker is that the bill goes one step further to attempt to eliminate any due process right a teacher might have to challenge the basis for the dismissal:

The revocation of the tenure status of a teacher, assistant principal, or vice-principal shall not be subject to grievance or appeal except where the ground for the grievance or appeal is that the principal failed to adhere substantially to the evaluation process. (p. 10)

In other words, the bill attempts to establish that teachers shall have no basis (no procedural due process claim) for grievance as long as the principal has followed their evaluation plan, ignoring the possibility – the fact – that these evaluation plans themselves, approved or not, will create scenarios and cause personnel decisions which violate due process rights. Further, the attempt at restricting due process rights laid out in the bill itself is a threat to due process and would likely be challenged.

Declaring any old process to constitute due process does not make it so! Especially where the process is built on not only “bad” but “wrong” measures used in a framework that forces dismissal decisions on at least 3 completely arbitrary and capricious bases (2 consecutive years in isolation, fixed weight on wrong measure, arbitrary cut-points for performance categories).

So this raises the big question of what’s behind all of this. Clearly, one thing that’s behind all of this is an astonishing ignorance of statistics and measurement among state legislators favoring the toxic trifecta – either that or a willful neglect of their legislative duty to respect constitutional protections including due process (or both!).


[1] A more reasonable alternative being to use the statistical information as a preliminary screening tool for identifying potential problem areas, and then using more intensive observations and additional evaluation tools as follow-up.  This approach acknowledges that the signals provided by the statistical information may in fact be false either as a function of reliability problems or lacking validity (other conditions contributed to the rating), and therefore in some if not many cases, should be discarded.   The parallel consideration more commonly used requires that the student growth metric be considered and weighted as prescribed, reliable, valid or not.

[2] For example, at the time of writing this draft, the bill introduced in New Jersey read: “Notwithstanding any provision of law to the contrary, the principal shall revoke the tenure granted to an employee in the position of teacher, assistant principal, or vice-principal, regardless of when the employee acquired tenure, if the employee is evaluated as ineffective or partially effective in one year’s annual summative evaluation and in the next year’s annual summative evaluation the employee does not show improvement by being evaluated in a higher rating category. The only evaluations which may be used by the principal for tenure revocation are those evaluations conducted in the 2013-2014 school year and thereafter which use the rubric adopted by the board and approved by the commissioner. The school improvement panel may make recommendations to the principal on a teacher’s tenure revocation.” http://www.njspotlight.com/assets/12/0203/0158

[5] Briggs and Betebenner (2009) explain: “However, there is an important philosophical difference between the two modeling approaches in that Betebenner (2008) has focused upon the use of SGPs as a descriptive tool to characterize growth at the student-level, while the LM (layered model) is typically the engine behind the teacher or school effects that get produced for inferential purposes in the EVAAS.” (Briggs & Betebenner, 2009, p. )

References

Alexander, K.L, Entwisle, D.R., Olsen, L.S. (2001) Schools, Achievement and Inequality: A Seasonal Perspective. Educational Evaluation and Policy Analysis 23 (2) 171-191

Ballou, D., Mokher, C.G., Cavaluzzo, L. (2012) Using Value-Added Assessment for Personnel Decisions: How Omitted Variables and Model Specification Influence Teachers’ Outcomes. Annual Meeting of the Association for Education Finance and Policy. Boston, MA.  http://aefpweb.org/sites/default/files/webform/AEFP-Using%20VAM%20for%20personnel%20decisions_02-29-12.docx

Ballou, D. (2012). Review of “The Long-Term Impacts of Teachers: Teacher Value-Added and Student Outcomes in Adulthood.” Boulder, CO: National Education Policy Center. Retrieved [date] from http://nepc.colorado.edu/thinktank/review-long-term-impacts

Baker, E.L., Barton, P.E., Darling-Hammong, L., Haertel, E., Ladd, H.F., Linn, R.L., Ravitch, D., Rothstein, R., Shavelson, R.J., Shepard, L.A. (2010) Problems with the Use of Student Test Scores to Evaluate Teachers. Washington, DC: Economic Policy Institute.  http://epi.3cdn.net/724cd9a1eb91c40ff0_hwm6iij90.pdf

Betebenner, D., Wenning, R.J., Briggs, D.C. (2011) Student Growth Percentiles and Shoe Leather. http://www.ednewscolorado.org/2011/09/13/24400-student-growth-percentiles-and-shoe-leather

Boyd, D.J., Lankford, H., Loeb, S., & Wyckoff, J.H. (July, 2010). Teacher layoffs: An empirical illustration of seniority vs. measures of effectiveness. Brief 12. National Center for Evaluation of Longitudinal Data in Education Research. Washington, DC: The Urban Institute.

Briggs, D., Betebenner, D., (2009) Is student achievement scale dependent? Paper  presented at the invited symposium Measuring and Evaluating Changes in Student Achievement: A Conversation about Technical and Conceptual Issues at the annual meeting of the National Council for Measurement in Education, San Diego, CA, April 14, 2009. http://dirwww.colorado.edu/education/faculty/derekbriggs/Docs/Briggs_Weeks_Is%20Growth%20in%20Student%20Achievement%20Scale%20Dependent.pdf

Briggs, D. & Domingue, B. (2011). Due Diligence and the Evaluation of Teachers: A review of the value-added analysis underlying the effectiveness rankings of Los Angeles Unified School District teachers by the Los Angeles Times. Boulder, CO: National Education Policy Center. Retrieved [date] from http://nepc.colorado.edu/publication/due-diligence.

Budden, R. (2010) How Effective Are Los Angeles Elementary Teachers and Schools?, Aug. 2010, available at http://www.latimes.com/media/acrobat/2010-08/55538493.pdf.

Braun, H, Chudowsky, N, & Koenig, J (eds). (2010) Getting value out of value-added. Report of a Workshop. Washington, DC: National Research Council, National Academies Press.

Braun, H. I. (2005). Using student progress to evaluate teachers: A primer on value-added models. Princeton, NJ: Educational Testing Service. Retrieved February, 27, 2008.

Chetty, R., Friedman, J., Rockoff, J. (2011) The Long Term Impacts of Teachers: Teacher Value Added and Student outcomes in Adulthood. NBER Working Paper # 17699 http://www.nber.org/papers/w17699

Clotfelter, C., Ladd, H.F., Vigdor, J. (2005)  Who Teaches Whom? Race and the distribution of Novice Teachers. Economics of Education Review 24 (4) 377-392

Clotfelter, C., Glennie, E. Ladd, H., & Vigdor, J. (2008). Would higher salaries keep teachers in high-poverty schools? Evidence from a policy intervention in North Carolina. Journal of Public Economics 92, 1352-70.

Corcoran, S.P. (2010) Can Teachers Be Evaluated by their Students’ Test Scores? Should they Be? The Use of Value Added Measures of Teacher Effectiveness in Policy and Practice. Annenberg Institute for School Reform. http://annenberginstitute.org/pdf/valueaddedreport.pdf

Corcoran, S.P. (2011) Presentation at the Institute for Research on Poverty Summer Workshop: Teacher Effectiveness on High- and Low-Stakes Tests (Apr. 10, 2011), available at https://files.nyu.edu/sc129/public/papers/corcoran_jennings_beveridge_2011_wkg_teacher_effects.pdf.

Corcoran, Sean P., Jennifer L. Jennings, and Andrew A. Beveridge. 2010. “Teacher Effectiveness on High- and Low-Stakes Tests.” Paper presented at the Institute for Research on Poverty summer workshop, Madison, WI.

D.C. Pub. Sch., IMPACT Guidebooks (2011), available at http://dcps.dc.gov/portal/site/DCPS/menuitem.06de50edb2b17a932c69621014f62010/?vgnextoid=b00b64505ddc3210VgnVCM1000007e6f0201RCRD.

Education Trust (2011) Fact Sheet- Teacher Quality. Washington, DC. http://www.edtrust.org/sites/edtrust.org/files/Ed%20Trust%20Facts%20on%20Teacher%20Equity_0.pdf

Hanushek, E.A., Rivkin, S.G., (2010) Presentation for the American Economic Association: Generalizations about Using Value-Added Measures of Teacher Quality 8 (Jan. 3-5, 2010), available at http://www.utdallas.edu/research/tsp-erc/pdf/jrnl_hanushek_rivkin_2010_teacher_quality.pdf

Working with Teachers to Develop Fair and Reliable Measures of Effective Teaching. MET Project White Paper. Seattle, Washington: Bill & Melinda Gates Foundation, 1. Retrieved December 16, 2010, from http://www.metproject.org/downloads/met-framing-paper.pdf.

Learning about Teaching: Initial Findings from the Measures of Effective Teaching Project. MET Project Research Paper. Seattle, Washington: Bill & Melinda Gates Foundation. Retrieved December 16, 2010, from http://www.metproject.org/downloads/Preliminary_Findings-Research_Paper.pdf.

Jackson, C.K., Bruegmann, E. (2009) Teaching Students and Teaching Each Other: The Importance of Peer Learning for Teachers. American Economic Journal: Applied Economics 1(4): 85–108

Kane, T., Staiger, D., (2008) Estimating Teacher Impacts on Student Achievement: An Experimental Evaluation. NBER Working Paper #16407 http://www.nber.org/papers/w14607

Koedel, C. (2009) An Empirical Analysis of Teacher Spillover Effects in Secondary School. 28 (6 ) 682-692

Koedel, C., & Betts, J. R. (2009). Does student sorting invalidate value-added models of teacher effectiveness? An extended analysis of the Rothstein critique. Working Paper.

Jacob, B. & Lefgren, L. (2008). Can principals identify effective teachers? Evidence on subjective performance evaluation in education. Journal of Labor Economics. 26(1), 101-36.

Sass, T.R., (2008) The Stability of Value-Added Measures of Teacher Quality and Implications for Teacher Compensation Policy. National Center for Analysis of Longitudinal Data in Educational Research. Policy Brief #4. http://eric.ed.gov/PDFS/ED508273.pdf

McCaffrey, D. F., Lockwood, J. R, Koretz, & Hamilton, L. (2003). Evaluating value-added models for teacher accountability. RAND Research Report prepared for the Carnegie Corporation.

McCaffrey, D. F., Lockwood, J. R., Koretz, D., Louis, T. A., & Hamilton, L. (2004). Models for value-added modeling of teacher effects. Journal of Educational and Behavioral Statistics, 29(1), 67.

Rothstein, J. (2011). Review of “Learning About Teaching: Initial Findings from the Measures of Effective Teaching Project.” Boulder, CO: National Education Policy Center. Retrieved [date] from http://nepc.colorado.edu/thinktank/review-learning-about-teaching.

Rothstein, J. (2009). Student sorting and bias in value-added estimation: Selection on observables and unobservables. Education Finance and Policy, 4(4), 537–571.

Rothstein, J. (2010). Teacher Quality in Educational Production: Tracking, Decay, and Student Achievement. Quarterly Journal of Economics, 125(1), 175–214.

Sanders, W. L., Saxton, A. M., & Horn, S. P. (1997). The Tennessee Value-Added Assessment System: A quantitative outcomes-based approach to educational assessment. In J. Millman (Ed.), Grading teachers, grading schools: Is student achievement a valid measure? (pp. 137-162). Thousand Oaks, CA: Corwin Press.

Sanders, William L., Rivers, June C., 1996. Cumulative and residual effects of teachers on future student academic  achievement. Knoxville: University of Tennessee Value- Added Research and Assessment Center.

McCaffrey, D.F., Sass, T.R., Lockwood, J.R., Mihaly, K. (2009) The Intertemporal Variability of Teacher Effect Estimates. Education Finance and Policy 4 (4) 572-606

McCaffrey, D.F., Lockwood, J.R. (2011) Missing Data in Value Added Modeling of Teacher Effects. Annals of Applied Statistics 5 (2A) 773-797

Reardon, S. F. & Raudenbush, S. W. (2009). Assumptions of value-added models for estimating school effects. Education Finance and Policy, 4(4), 492–519.

Rubin, D. B., Stuart, E. A., and Zanutto, E. L. (2004). A potential outcomes view of value-added assessment in education. Journal of Educational and Behavioral Statistics, 29(1):103–116.

Schochet, P.Z., Chiang, H.S. (2010) Error Rates in Measuring Teacher and School Performance Based on Student Test Score Gains. Institute for Education Sciences, U.S. Department of Education. http://ies.ed.gov/ncee/pubs/20104004/pdf/20104004.pdf.

Real Reform versus Fake Reformy Distractions: More Implications from NJ & MA for CT!

Recently, I responded to an absurd and downright disturbing Op-Ed by a Connecticut education reform organization that claimed that Connecticut needed to move quickly to adopt teacher evaluation/tenure reforms and expand charter schooling because a) Connecticut has a larger achievement gap and lower outcomes for low income students than Massachusetts or New Jersey and b) New Jersey and Massachusetts were somehow outpacing Connecticut in adopting new reformy policies regarding teacher evaluation. Now, the latter assertion is questionable enough to begin with, but the most questionable assertion was that any recent policy changes that may have occurred in New Jersey or Massachusetts explain why low income children in those states do better, and have done better at a faster rate than low income kids in Connecticut. Put simply, bills presently on the table, or legislation and regulations adopted and not yet phased in do not explain the gains in student outcomes of the past 20 years.

Note that I stick to comparisons among these states because income related achievement gaps are most comparable among them (that is, the characteristics of the populations that fall above and below the income thresholds for free/reduced lunch are relatively comparable among these states, but not so much to states in other regions of the country).

I’m not really providing much new information in this post, but I am elaborating on my previous point about the potential relevance of funding equity – school finance – reforms – and providing additional illustrations.

First, let’s take a look at the relationship between state and local revenues per pupil and median household income over time in Mass, CT, RI and NJ. These data are drawn from an article I published in 2010 in which I estimated a model for all states of the relationship between median household income and state and local revenue per pupil over time. In that recent article, I plotted the relationship over time for several states. Here, I have re-plotted that relationship for New Jersey, Massachusetts, Connecticut and Rhode Island.

This graph shows the slope of the statistical relationship between state and local revenues per pupil and median household income, controlling for differences in regional labor costs and economies of scale of districts. All 4 states managed to reduce or eliminate what had been positive relationships between household income and district revenues. That is, in 1990, in each state higher income districts had more revenue. By the late 1990s, Mass and NJ had reversed that pattern, and in fact had redistributed revenue such that districts with lower median household income actually had more revenue. The finance systems had become “progressive,” so-to-speak.

By contrast, the relationship between income and revenue remained more random – and on average flat – in RI and CT.  How Connecticut made so little consistent progress toward fiscal equity over time is another story for another day.

By 2009, things were pretty much the same, as the next figure shows. The next figure compares current operating expenditures per pupil and district poverty rates. Current operating expenditures include expenditure of federal funds, including Title I funds. Those federal funds tend to add marginally to the progressiveness of the system. But, what’s also important is not just whether the trendline tilts upward, but whether the pattern is systematic or predictable. In New Jersey, among districts enrolling 2,000 or more students (scale efficient), census poverty rates alone explain 47% of the variation in current spending. It’s a predictable, upward slope whereby higher poverty districts actually have and spend more per pupil. In Massachusetts, poverty explains nearly 40% of the variation in spending per pupil.

But, by contrast, in Connecticut, poverty explains only about 15% of the variation in spending across districts. Notably, a handful of high poverty districts including Bridgeport, Waterbury and New Britain have been left well behind… well below  the curve.  Further, even though Hartford and New Have have more funding, much of that funding has been channeled through a magnet school aid program, so the seemingly high position of these two districts is somewhat deceptive, and not part of any systematic effort to improve equity.

I’m doing some picking on CT here in particular, because CT has hardly provided systematic targeted support to high need districts. That said, CT is hardly the worst offender among states. Several states do far worse than CT, including PA, NY and IL in particular.  But that’s a post for another day. Those states are not sufficiently comparable in other ways to include in these comparisons. Our report on School Funding Fairness provides a full breakdown across states (www.schoolfundingfairness.org).

In the best possible case, CT has selectively targeted funding to some high need districts and has left out others. Rhode Island funding is somewhat more predictable (though deceptive because of the small number of districts) than CT but clearly less systematic than NJ or Mass.

Now, here are the longitudinal trends in student outcomes in these states, cut a few different ways and focusing on disadvantaged children. First, because I’m not a fan of comparing “low income” kids to “low income” kids even across these relatively similar economies, I take a look at children of mothers who were high school dropouts, and 8th grade math performance:

From 2000 forward (where the scores are relatively comparable over time), children of maternal high school dropouts in Mass and NJ far outpace those in CT or RI.

Next, here are the trends for children who qualify for free lunch, also on 8th grade math:

Finally, here are the trends for 4th grade reading:

In each case, low income kids in the two states that have more aggressively pursued funding equity reforms outperform and have improved their performance faster than low income kids in states that have not.

While these trends are hardly conclusive evidence [more extensive analysis is underway] of a link between the funding shifts and outcome gains, these trends are consistent with a significant body of research on the effects of school finance reforms, which I summarize in these articles/papers:

  1. http://www.tcrecord.org/library/abstract.asp?ContentId=16106
  2. http://www.shankerinstitute.org/images/doesmoneymatter_final.pdf

These illustrations coupled with the larger body of related research present a more compelling case for improving funding equity and adequacy than the case that has been presented thus far for other reforms – reforms which lack both any significant research base OR other compelling evidence.

Simply arguing that teacher quality varies – good teachers matter – and that we have to “fix” teacher quality says nothing of how to actually improve teacher quality or the resources required to get the job done. “Teacher quality” is not a policy.

Notably, the CT Education reform group that posted the original absurd claims later softened their arguments regarding the causes of Connecticut’s failures and Mass and NJ’s successes. But somehow, they still found it in them to pitch the same policy solutions. Yes, solutions that had nothing to do with why Mass and NJ were outperforming CT. If the original argument doesn’t hold, then neither do the proposed solutions! That’s how dumb this debate has gotten!

Let’s be absolutely clear here – During the years over which Mass and NJ saw these substantial improvements in outcomes, both states had teacher tenure systems – in both successful and less successful schools! Both states had rather traditional teacher evaluation policies in place. Both states had relatively small overall shares of children attending charter schools. Massachusetts has received some accolades for its accountability system adopted concurrent with funding reforms.

Even if the path to improved productivity and efficiency did involve reforms with any resemblance to the teacher evaluation or charter school reforms on the table, equitable and adequate financing would be a prerequisite condition for doing any of it well. Real innovation requires real investment.

Notably, the types of innovations adopted by those few charter chains which show relatively consistent records of success are rather mundane strategies which involve providing more time and intensive supplemental tutoring, typically at a substantially greater per pupil cost – much of it reflected in higher teacher salaries to support the additional time and responsibilities.   Yes, even in Connecticut those higher flying charters, while serving far less needy student populations than other schools in their host districts, are also outspending them! (and pay teachers more!)

We also have pretty good evidence from research that salaries matter (see page 7-)– that the average level of teacher salaries affects the quality of entrants to the profession – and that the relative salary paid in one district versus another may affect teacher job choice – leading to sorting of teacher credentials across districts.

By contrast we have little evidence that mass deselection of teachers on the basis of noisy and potentially biased measures of student achievement growth – without counterbalancing the risk with substantial additional reward would have any benefit whatsoever [outside of self-fulfilling simulated correlations] – and it might, in fact, do significant harm! We also have a pretty solid track record of studies suggesting few or no benefits of attaching compensation to similar performance metrics (e.g. merit pay).[1] Yet the reformy rhetoric advancing these policies through copy-and-paste template legislation persists! Is anyone taking even a brief time out to think and evaluate these proposals?

Even if we didn’t have all of this evidence for how and why money matters, wouldn’t it make sense on its face to provide schools and districts a level playing field? What possible argument is there for deciding to completely overlook substantial financial inequities in favor of policy options which, to implement properly (if that’s even possible), require equitable financial resources. Yes, real reform costs money.  Good schools cost money!

If reformy advocates really don’t believe that money has anything to do with improving schooling quality, then why do charter advocates in Connecticut (and elsewhere) push so hard for substantial increases in funding ($2,600 per pupil in CT)? Yet the underfunded high need districts stand to gain far, far less under current proposals (only about $250 per pupil). Funding those districts appropriately comes with a higher price tag than increasing charter funding because they serve a lot more students and far more needy students than CT charters. The persistent inequities faced by these districts are glaring… right down to the delivery of basic curricular options, especially in the neediest, least well resourced districts. Larger class sizesAdvanced and enriched curricular optionsTeacher SalariesConcentration of novice teachers.

These are the real differences between well resourced, high performing and poorly resourced, low performing districts in Connecticut.  Both groups of districts pay teachers based on degrees and experience. Both sets of districts have tenure systems. I suspect that both sets of districts do little systematically different regarding teacher evaluation (which might be improved, but not by some ill-conceived state legislation).  So clearly none of that stuff has much of anything to do with which districts are succeeding and which are not ! The districts are substantively  different in terms of who they serve, and in terms of the resources (by the measures noted above) they have to serve them!

I’ve long argued that it seems rather hypocritical to hear staunch charter advocates argue that more money wouldn’t help traditional public schools, and then those same charter advocates set out to help their favored charters substantially outspend the nearby public schools (meanwhile, invariably serving less needy, less costly children to educate).

If money has nothing to do with improving schooling quality – or providing high quality schooling – then why is the average tuition of private independent day schools in Connecticut typically well above (around $25k elem, up to $35k HS) current spending levels of nearby public districts (where tuition covers only a portion of current spending).[2] Money – and what it buys – clearly means something to the consumers of what I might call luxury schooling.  Nationally, private independent schools spend on average 1.96 times average spending of public districts in their same labor market. [3] Meanwhile, these schools DO NOT generally fire teachers at will. They do typically pay based largely on seniority and degree level. What do they do? Well, for one thing, they provide small class sizes [whether that’s the most efficient allocation or not is a separate question, but that is what they choose to do… and what they often advertise]!

It is about the money. Even/especially those disingenuous arguments that it’s NOT about money? Those arguments perhaps, are the ones that most clearly indicate that it IS about money – and a complete unwillingness to acknowledge the importance of money to anyone else but one’s self. Strangely, we’ve reached a point in the discourse where it’s all about finding any rationale we can to NOT give money to the schools and districts that need it most while continuing to blame them, their teachers and the children they serve for the persistent cycle of poor performance – and where we define their performance as poor by comparison to their more advantaged and better resourced peers! Isn’t anyone else seeing the absurdity?[4] [starve them… shift money away from them… then blame them for doing even worse?]

Clearly the media isn’t catching it. I’m less frustrated by the absurdity of these arguments (I rather expect it in the political sphere) than the fact that the media is either complicit in advancing the silliness, or intellectually incapable of seeing through it.

Those who continue to ignore outright the role of money in schooling in favor of reformy window dressing – meanwhile leveraging every opportunity to access a greater share of the federal, state and local tax dollar, present a laughable case for their preferred reforms.  But for some reason, I’m finding it really hard to laugh.

=======

[1]Glazerman, S., Seifullah, A. (2010) An Evaluation of the Teacher Advancement Program in Chicago: Year Two Impact Report. Mathematica Policy Research Institute. 6319-520
Springer, M.G., Ballou, D., Hamilton, L., Le, V., Lockwood, J.R., McCaffrey, D., Pepper, M., and Stecher, B. (2010). Teacher Pay for Performance: Experimental Evidence from the Project on Incentives in Teaching. Nashville, TN: National Center on Performance Incentives at Vanderbilt University.
Marsh, J. A., Springer, M. G., McCaffrey, D. F., Yuan, K., Epstein, S., Koppich, J., Kalra, N., DiMartino, C., & Peng, A. (2011). A Big Apple for Educators: New York City’s Experiment with Schoolwide Performance Bonuses. Final Evaluation Report. RAND Corporation & Vanderbilt University.  http://www.americanprogress.org/issues/2011/04/pdf/class_size.pdf

[2] http://www.brunswickschool.org/admissions/fees-financial-aid/, http://www.chasecollegiate.org/page.cfm?p=208, http://www.fairfieldprep.org/page.cfm?p=24, http://www.greenwichacademy.org/podium/default.aspx?t=32259, http://www.klht.org/podium/default.aspx?t=2170, http://www.stanwichschool.org/admissions/tuition.asp, http://woosterschool.org/admissions/tuition-fees

[3] Baker, B. (2009). Private schooling in the U.S.: Expenditures, supply, and policy implications.
Boulder and Tempe: Education and the Public Interest Center & Education Policy Research
Unit. Retrieved [date] from http://epicpolicy.org/publication/private-schooling-US

[4] An argument taken to its extremes in a recent NJDOE report: https://schoolfinance101.wordpress.com/2012/02/24/how-not-to-fix-the-new-jersey-achievement-gap/

Follow up on Reformy Logic in Connecticut

A few days ago, I responded to an utterly silly CT Ed Reform op-ed which argued that poverty doesn’t really matter so much, nor does funding (by omission), and that Massachusetts and New Jersey do better than Connecticut on behalf low income kids because they’ve adopted accountability and teacher evaluation reforms in the past few years. Thus, the answer is for Connecticut to follow suit by adopting SB 24 in its original form. To be clear, NJ has absolutely not adopted anything like SB 24.  Here’s a key section of that op-ed:

We think folks would be hard-pressed to argue that low-income students right over the border in Massachusetts or New Jersey face very different circumstances at home than the low-income students in Connecticut.  So, what actions have our neighboring states taken to address their achievement gaps that Connecticut hasn’t?  Put bluntly, they have adopted education reform policies very similar to the ones proposed in Governor Malloy’s original education reform bill.  They have adopted or implemented policies that evaluate teachers on the basis of student performance, that rank schools and districts within a tiered intervention framework, and that provide the Commissioner with the authority to intervene in the lowest performing schools and districts.

In my previous post, I already pointed out a few simple realities… like the fact that both Massachusetts and New Jersey have systematically tackled school funding equity over time, where Connecticut has not. I also suggested that it might be rather foolish to argue that policies considered and/or adopted but not even really implemented yet were the cause of improvements to New Jersey and Massachusetts low income student progress.

So, here’s just one more graph to drive home that point:

http://nces.ed.gov/nationsreportcard/naepdata/dataset.aspx

Yes – Mass and NJ do better than CT, across all student groups, including lower income students. And yes, Mass and NJ have shown higher rates of growth in student outcomes, across all student groups. And you know what, much if not most of that growth has occurred prior to considering, piloting and partially implementing new policies.

So… to put it really simply… it’s pretty darn unlikely that Mass and NJ do better than CT because of recent policy developments.

Further, across all three states, poverty continues to matter.

Children who do not qualify for either free or reduced lunch outperform those who do.

Children who qualify for reduced lunch (185% poverty income level) outperform those who qualify for free lunch (130% poverty income level).

Notably, children qualifying for free lunch in Massachusetts have surpassed those qualified for reduced lunch in CT and those qualified for free lunch in NJ are catching up with those qualified for reduced lunch in CT.

In fact, gaps in the other two states remain relatively large as well because of the growth in outcomes of higher income students which has largely paralleled the growth among lower income students.