Blog

Featured

Toward a Unified Conception of Equity, Equal Opportunity, and Adequacy

Below is an excerpt from my 2018 book Educational Inequality and School Finance . In many ways, I think this one passage is among the most important in the entire book. Below, I’ve bolded a few sections I think are especially important. This passage builds on a chapter Preston Green and I wrote for the original Handbook of Education Finance and Policy (2008) in which we tried to develop a unified framework for understanding equal educational opportunity and educational adequacy. I’ve written in recent posts how it is absolutely necessary that conversations around reforming state school finance systems be guided by clear and consistent principles, which can be coherently linked to both legal frameworks and empirical analyses and models.

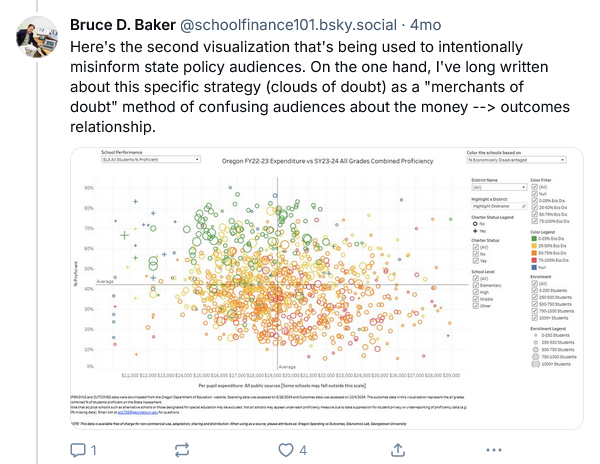
To put it bluntly, many of the methods being used and recommendations provided to state legislatures by “consultants” proclaiming their approaches to be built on evidence – to advance equity and adequacy – simply do not, nor can they ever meet the demands of this conceptual framework (and thus, certainly don’t stand up to judicial/constitutional scrutiny where equal educational opportunity and educational adequacy are demanded).

I’ll write more about these connections in future posts.

From Chapter 2

Because of the vast inequities that exist across our public school systems, legal scholars, advocates, and analysts have sought to develop conceptual frameworks and empirical measures to illustrate sources, causes, and consequences of such disparities in order to influence policy makers and guide courts in evaluating student and family rights.[i] In the post-Brown era it became increasingly apparent that dismantling of segregation would be a long and incomplete process. Further, even where greater integration was achieved, significant disparities persisted in the quality of schooling and available resources both across schools within states and across states. While racial integration remained a major national policy concern, resolving persistent, deep resource disparities across schools and communities gained momentum in the late 1960s and early 1970s.

In 1979 Robert Berne and Leanna Stiefel synthesized conceptual frameworks from public policy and finance and evidence drawn from early court cases challenging inequities in state school finance systems to propose a framework and series of measures for evaluating equity in state school finance systems.[ii] Their important work laid the foundation for subsequent conceptual and empirical developments regarding equity measurement applied to preK–12 settings. They used two framing questions: Equity of what? Equity for who? On the “what” side, they suggested that equity could be framed in terms of financial inputs to schooling, real resource inputs (such as teachers and their qualifications), and outcomes.

Their framework, however, predated both judicial application of outcome standards to evaluate school finance systems and the proliferation of state outcome standards, assessments, and accountability systems first in the 1990s and then in the 2000s under No Child Left Behind. The “who” side typically involved “students” and “taxpayers”: a state school finance system should be based on fair treatment of taxpayers and yield fair treatment of students. Drawing on literature from tax policy, Berne and Stiefel adopted a definition of fairness that provided for both “equal treatment of equals” (horizontal equity) and “unequal treatment of unequals” (vertical equity).[iii] That is, if two taxpayers are equally situated, their tax treatment should be similar; likewise, if two students have similar needs, their access to educational programs and services or financial inputs should be similar. But if two taxpayers are differently situated (homeowner versus industrial or commercial property owner), then differential taxation might be permissible; and, if two students have substantively different educational needs requiring different programs and services, then different financial inputs might be needed to achieve equity.

In recent decades, research has shown the shortcomings of horizontal and vertical equity delineations. First, horizontal equity itself does not preclude vertical equity; equal treatment of equals does not preclude the need for differentiated treatment for some (nonequals). Second, vertical equity requires value judgments that lead to categorical determinations of who is unequal and how unequal their treatment must be in order to be “equitable.” Differences in individual students and population needs don’t always fall into neat boxes; rather, they run along continua.

Nonetheless, laws—federal and state statutes and regulations—often try to put things into neat boxes, and conceptions of equity often intersect with legal claims that one group is not receiving equitable treatment when compared with another, thus requiring courts to consider how to remedy those inequities. Significant federal laws enacted in the 1970s operate under this model, applying categorical declarations as to who is eligible for different treatment and frequently requiring judicial intervention to determine how much differentiation is required for legal compliance.[iv] But most children do not fall into the categories set forth under federal (or state) laws, even though there exist vast differences in needs across those children.

An alternative, unifying approach is to suggest that the treatment is not the inputs the child receives but the outcomes that are expected of all children under state standards and accountability systems. In this sense, all children under the umbrella of these state policies are similarly situated and similarly expected to achieve the common outcome standards. Thus, the obligation of the state is to ensure that all children, regardless of their background and where they attend school, have equal opportunity to achieve those common outcome standards.

The provision of equal educational opportunity requires differentiation of programs and services, including additional supports—vertical equity. This input (and process) differentiation is toward a goal of equal treatment (treatment = outcome goals) rather than unequal treatment (treatment = inputs). Further, if differentiation of programs and services is required to provide equal opportunity to achieve common outcomes, there exists a more viable legal equity argument on behalf of the most disadvantaged children not separately classified under federal statutes. Whether children fit neatly into the protected boxes identified in federal statutes does not alone determine whether those children require additional resources. The conception of equal opportunity to achieve common outcome goals has thus largely replaced vertical equity in the vernacular of K–12 equity analysis.[v]

The late 1980s and early 1990s saw a shift in legal strategy regarding state school finance systems away from emphasizing achieving equal revenue across settings (neutral of property wealth) and toward identifying some benchmark for minimum educational adequacy. Some advocates for this approach saw it as politically infeasible for states to raise sufficient state aid to close the spending gap between the poorest and most affluent districts, meaning that achieving spending parity likely required leveling down affluent districts. Thus, a focus on a minimum adequacy bar for the poorest districts would alleviate this concern and potentially garner political support of affluent communities that no longer had anything to lose.[vi] Bill Koski and Rob Reich explain that this approach is problematic in part because minimum adequacy standards are difficult to define; also, when some are provided merely minimally adequate education but others provided education that far exceeds minimum adequacy, the former remain at a disadvantage. Further, the adequacy of the minimum bar is diminished by increasing that gap, because education is, to a large extent, a positional good,whereby individuals compete based on relative position for access to higher education and economic prosperity.[vii]

Others have adopted a more progressive “adequacy” view that focusing on state standards and accountability systems could hold legislators’ feet to the fire to provide sufficient resources for all children to meet those standards, and state constitution education articles could be used to enforce this mandate.[viii] Under this more progressive alternative, equal opportunity and adequacy goals are combined. The state must provide equal opportunity for all children to achieve “adequate” educational outcomes. Funding must be at a sufficient overall level and resources, programs, and services must be provided to ensure that children with varied needs and backgrounds have the supports they need to achieve the mandated outcomes.

It remains important, however, to be able to separate equal opportunity and adequacy objectives both for legal claims and for empirical analysis. The adequacy bar can be elusive.[ix] State courts are not always willing to declare that adopted accountability measures and outcome standards determine the state’s minimum constitutional obligation. The state’s ability to support a specific level of adequacy may be subject to economic fluctuations.[x] Importantly, at those times when revenue falls short of supporting high outcome standards, equal opportunity should still be preserved: equal opportunity can be achieved for a standard lower than, equal to, or higher than the single adequacy standard.[xi]

The practical implications of modern equity, equal opportunity, and adequacy conceptions are that state school finance systems must strive to achieve two simultaneous goals: account for differences in the costs of achieving equal educational opportunity (to achieve desired outcomes) across schools and districts and the children they serve; and account for differences in the ability of local public school districts to cover those costs. The first goal relates primarily to the sorting of students and populations by needs across local schools and districts, warranting substantial differentiation of funding to provide equal educational opportunity, as well as to geographic differences in the costs of labor and other school operations. The second goal stems from the continued reliance on local property taxation to support that system. Because local jurisdictions vary widely in the revenue they can raise when applying common tax rates or effort, states must distribute aid to offset these discrepancies, to achieve dollar parity. 


[i] This section draws on collaborative work with Preston Green of the University of Connecticut.

[ii] Robert Berne and Leanna Stiefel, “The Equity of School Finance Systems Over Time: The Value Judgments Inherent in Evaluation,” Educational Administration Quarterly 15, no. 2 (1979): 14-–34, doi:10.1177/0013161X7901500205; Robert Berne and Leanna Stiefel, The Measurement of Equity in School Finance: Conceptual, Methodological and Empirical Dimensions (Baltimore: Johns Hopkins University Press, 1984); Robert Berne and Leanna Stiefel, “Concepts of School Finance Equity: 1970 to the Present,” in Equity and Adequacy in Education Finance: Issues and Perspectives, ed. Helen Ladd, Rosemary Chalk, and Janet Hansen (Washington, DC: National Research Council, 1999), 7–33.

[iii] Berne and Stiefel, The Measurement of Equity in School Finance.

[iv] Regarding children with disabilities, see Endrew F. v. Douglas County School District Re-1, 137 S. Ct. 29 (U.S. 2016). Regarding children with limited English language proficiency, see Issa v. School District of Lancaster, no. 16-3528 (3d Cir. Jan. 30, 2017).

[v] Bruce D. Baker and Preston Green, “Conceptions of Equity and Adequacy in School Finance,” in Handbook of Research in Education Finance and Policy, ed. Helen Ladd and Edward Fiske (New York: Routledge, 2008), 203–21; Bruce D. Baker and Preston C. Green III, “Conceptions, Measurement, and Application of Educational Adequacy and Equal Educational Opportunity,” in The Handbook of Education Policy Research, ed. Gary Sykes, Barbara Schneider, and David Plank (New York: Routledge, 2009), 438–52.

[vi] William H. Clune, “The Shift from Equity to Adequacy in School Finance,” Educational Policy 8, no. 4 (1994): 376–94.

[vii] William S. Koski and Rob Reich, “When Adequate Isn’t: The Retreat from Equity in Educational Law and Policy and Why It Matters,” Emory Law Journal 56 (2006): 545.

[viii] For example, Kansas’s constitution requires that the legislature “shall make suitable provision for finance of the educational interests of the state.” Those educational interests are articulated in standards adopted by the state board of education, which holds independent constitutional authority for the “general supervision of public schools.” Kansas courts have repeatedly held that the legislature’s obligation is to provide financing that grants all children equal opportunity to achieve those standards. See Gannon v. State, 368 P.3d 1024, 303 Kan. 682 (2016); Gannon v. State, No. 113,267 (Kan. June 28, 2016); Montoy v. State, 279 Kan. 817, 112 P.3d 923 (2005); and USD NO. 229 v. State, 256 Kan. 232, 885 P.2d 1170 (1994).

[ix] Avidan Y. Cover, “Is Adequacy a More Political Question Than Equality? The Effect of Standards-Based Education on Judicial Standards for Education Finance,” Cornell Journal of Law & Public Policy 11 (2001): 403.

[x] Michael A. Rebell, “Safeguarding the Right to a Sound Basic Education in Times of Fiscal Constraint,” Albany Law Review 75 (2011): 1855.

[xi] Baker and Green, “Conceptions of Equity and Adequacy in School Finance”; Baker and Green, “Conceptions, Measurement, and Application.”


Florida School Finance Update: Here’s your manageable standard, now fund it!

I’ve had the pleasure of running some new models with updated data in the past few days. I recently produced a lengthy report on school funding in Florida.

I’ve pointed out on several occasions recently that Florida schools have continued their rapid decline in 8th grade outcomes in reading and math. Florida is one of the reasons why Mississippi’s overall rank improves on national assessments. Yay for Florida.

The thing about Florida is that the state, over the past decade and more, has uniformly crushed the public schooling system and the outcomes it produces. Here’s the distribution of district average performance on reading and math for all FL districts compared to national average outcomes (0- horizontal red line). The vast majority of Florida kids are now below – well below that line.

Not shockingly, relating back to my report linked above, there’s a connection between these performance declines and the inadequacy of funding provided to Florida public schools over the past decade. As I explained in my report – and in several other reports and peer reviewed articles – I have a model based on data for every school district in the U.S. which generates predictions of the spending needed in each school district to achieve different levels of student outcomes (standardized reading/math outcomes).

Here’s where Florida districts stand when comparing their current spending as a ratio to the estimated need for achieving a) national average and b) 1 standard deviation above national average outcomes in reading and math. I actually had to cut off the top part of these graphs to focus in on the bottom and show the spread of Florida districts which are now almost entirely packed into the bottom half.

Now, in my report, I explained how the Florida Supreme Court said there’s really no way to set a manageable standard for what’s adequate anyway, so the legislature should just do whatever it wants. Well, those red horizontal lines aren’t just manageable standards, they are reasonable empirical predictions that could be directly used in guiding the state school finance formula. But, silly me, with my data and models (courts in other states have relied heavily on such evidence for setting such standards).

Florida’s constitution (education article), ratified/revised by Florida’s citizens in 1998 and 2002, requires provision of a high quality system of public schools. We can quibble over whether national averages in reading and math are “high quality,” or merely average. I’d say the latter. What’s clear is that Florida’s school finance system, for MOST OF FLORIDA’S CHILDREN falls short of providing sufficient financing for even that goal – and as a result – most Florida children no longer meet even that modest goal?

This figure shows the distribution of a) current spending with respect to differences in child poverty rate and b) cost estimates for the low (national average) and high (+1 standard deviation) outcome goals. Florida specifically falls well short of providing sufficient funding for children in higher poverty communities to achieve even the modest outcome goal – national average.

Over time, the reality of Florida school funding – actual spending – has slid further and further below these targets – things weren’t actually so bad in 2009 (kinda “meh” but not like they are now).

Here’s another view of the problem. A self-inflicted – excuse me – legislatively inflicted problem. After all, the adequacy of school funding in every state is a responsibility of state elected officials. When it’s good, that’s their accomplishment. When it’s not so good? That’s on them too!

Here, we see the overall relationship, across the US, in 2023, between the relative adequacy of funding to achieve national average outcomes (current spending / spending needed), and, their actual outcomes! Shockingly, or perhaps not, districts (each dot is a district – beige are all districts nationally) with more adequate funding have higher outcomes in reading and math. Districts to the right of the vertical red line spend more than their cost estimate (to achieve national average outcomes). Districts to the left of the vertical red line spend less than their need estimate. Districts above the horizontal red line perform above national average outcomes and districts below the horizontal red line perform below national average outcomes. The worst place to be is in the lower left quadrant – not enough money and poor outcomes. And that’s exactly where most Florida school districts presently sit – with better funded districts performing better and worse funded districts performing, well, worse.

One upside for Florida districts is that they generally sit on or above the diagonal line which might be interpreted as representing average efficiency in producing outcomes. Florida school districts are efficiently producing the outcomes they produce – getting better than expected outcomes. By the way, that’s what actual efficiency analysis looks like – not the DOGEY BS we keep hearing about. It’s about rigorously evaluating the quality of output of a business or government entity, given the inputs, and NOT about creating faux outrage over some anecdotal line item on an expense sheet.

Florida school districts just don’t have the resources to do much better, and as a result, aren’t doing better. The solution one can derive from this image is to push Florida districts up that slide – that diagonal – from lower left to upper right! That is – to provide more adequate funding, and particularly to those furthest in the lower left – which tend to be districts serving higher poverty student populations.

But, rather than push districts from the lower left to the upper right, the state has instead, let districts slide from the middle/upper right to the lower left. This is a problem that can be fixed. And the solution is rather transparent – Adequate funding. And funding progressively distributed to schools and districts serving higher need student populations.

The solution is adequate funding. At least for Florida – here and now. And yes, Florida can afford that solution. Florida is near last in the country on the share of its economic capacity spent on K12 schooling. As a result, Florida school districts actually spend less, in adjusted dollars, per pupil than they did in 1993 and now spend less than Mississippi. Woohooo. Yay for Florida again. As I point out in my report linked above, even if Florida merely spent the same share of state GDP on public ed now as in the mid 2000s, the state would spend nearly 30% more than it does now. That would close a significant portion of the funding gap toward moving the state back to average outcomes. Still not high. But not falling off the cliff they have been for the past several years.

Time to start having the right conversation about school finance in Florida to ensure that all children in Florida have access to “a uniform, efficient, safe, secure, and high quality system of free public schools that allows students to obtain a high quality education…”

All that hiring while enrollments plummet? Unsustainable!?

Preserving another thread from X and BlueSky: Just the facts (Public Use Graphs)

Another quick picture book story time – About those unsustainable “huge” staffing increases while public schools bleed enrollments. First – those enrollments (overall)

[LEA summed and School Summed enrollments from NCES Common Core]

Now by Locale (aggregating urban centric locale codes):

[seems like around 2013, some areas that had been rural were consumed by sprawl and reclassified]

What about all of those huge staffing increases while enrollments plummet (even if they aren’t)? Here’s the aggregate for staff per 100 pupils – mostly teachers – not growing!!!!! Some reclassification shifts & drift in those tiny categories at bottom:

by locale:

Some follow up:

On Miracles in Mississippi

Here’s a quick summary of a thread I recently posted on both BlueSky and X.

Storytime – for those who want to push some “southern” miracle in public schooling – using Mississippi as their exemplar, and implying “red state” strategies are the policy solution:

First – Mississippi doesn’t catch Massachusetts or New Jersey. NOT EVEN CLOSE

But states like Arizona and Florida fall to and even blow Mississippi in some cases on 8th grade NAEP performance (a better indicator of the cumulative effects of a system on student learning than 4th grade assessments).

Notable in these graphs are the continued large declines in Arizona and Florida while others are stabilizing or rebounding from 2022 to 2024 (AZ stabilizes in math, but not FL).

Unlike Florida or Arizona, Mississippi does not have (or has not during this period) universal vouchers (but does have large private enrollment share).

Mississippi has a very small share of kids in charter schools, whereas charter enrollments (and voucher enrollments) have exploded in Florida and Arizona:

What has Mississippi done? Well, unlike Florida or Arizona, Mississippi has maintained effort to fund its schools and has actually surpassed Florida and Arizona on labor cost adjusted per pupil spending:

AMONG LOW SPENDING STATES (in labor cost adjusted 1999$)

Just some food for thought. And while not a rigorous causal analysis, certainly more rigorous than most of the conversations I’ve seen/heard on this topic.

Short term plan to Un-Florida Florida’s Public Schools

A Two-Year Plan for Reforming Florida Public Education Finance & Governance

In a recent report on public education in Florida, I made the following recommendations:[1]

  • Recommendation 1 –Financing a Uniform System of High Quality Public Schools
    • Phase 1: Engage in the work of setting a manageable standard of “high quality” public schooling for Florida’s children by engaging in analyses of the costs associated with providing each and every child in Florida with equal educational opportunity to achieve high education outcomes.
      • Establish a statewide commission on school funding.
      • Engage stakeholders in setting standards of excellence for Florida children.
      • Engage experts to estimate the costs associated with meeting those standards, applying appropriately rigorous methods.
    • Phase 2: Guided by those estimates, reform the school finance formula and increase state aid to schools so as to provide them with the necessary resources for all children to have equal educational opportunity to achieve high education outcomes. That is, meet the constitutional standard ratified by Florida voters in 1998 and 2002. This should include estimates of commensurate funding for charter schools, based on needs and costs.
      • Take eliminating or reducing property taxes off the table. The most effective form of property tax relief is increased state aid, as would occur under implementation of this recommendation.
  • Recommendation 2 – Charter School Reset
    • Part 1: Impose a moratorium on charter school expansion, including the Schools of Hope Program. The existing charter school sector in Florida is compromising equity, eroding efficiency and producing poor educational outcomes for those it serves.
    • Part 2: Establish new regulations for evaluating existing charter operators and vetting new charter operators to ensure improved equity in the distribution of students by their needs across schools. Adopt and enforce stricter regulations pertaining to student outcomes.
    • Part 3: Adopt updated charter school legislation to ensure that charter schools are sufficiently “public,” required to operate as if “state actors,” protecting children’s constitutional rights and abiding by all relevant federal statutes.
  • Recommendation 3 – Voucher Freeze & Reallocate
    • Freeze expansion of the voucher program to free up state resources to support a fully funded, overhauled public school finance formula, to provide a uniform system of free public schools.

The justification for each of these recommendations is thoroughly documented in the cited report. The next step is to lay out an action plan for policy advocacy for the next two years, and next two Florida legislative cycles.

Two year Plan

Following are my recommendations for that two -year action plan:

Year 1 (2026 Session, fy2027) – Pause, Reset & Evaluate

  • Repeal and rethink Schools of Hope (SoH)

    The Schools of Hope legislation and regulations which have been fast tracked over the past year are an ill-conceived patchwork with little potential to solve systemic problems in Florida public education. But, conversations around that program have revealed three key issues worthy of consideration.

    • First, the SoH plan acknowledges that Florida’s existing charter sector is not strong and that recruiting proven providers from other states might be necessary.
    • Second, the SoH plan includes substantial additional funding (nearly $5k) per pupil to ensure that designated schools could be successful.
    • Third, the SoH plan acknowledges the importance of and costs related to operations and maintenance of capital – land and buildings needed for providing quality education.

    Presumptively, a taxpayer financed school of choice shouldn’t exist to begin with unless it provides some element of “hope.” Hope for better student academic outcomes, while maintaining children’s and taxpayers’ rights. Empirical evidence in my report indicates that the charter sector on average in Florida, does not advance “hope” for better academic outcomes for Florida’s children. The purported need to create a special class of charter schools (ones that do offer “hope”), requiring access to free capital and substantial additional funding in order to be “successful” is indicative of the systemic problem state legislators have failed to address.

    My report explains that Florida public schools, inclusive of charter schools lack the funding needed to achieve high performance. Still, they perform quite efficiently with the funding they have. Florida public district AND charter schools would benefit from that same boost in funding (approximately 50% increase to annual operating expenditures). But the proposed SoH plan instead, taps into the operating expenses of district schools to offset costs for charter schools (for operations and maintenance of facilities), giving district officials little control over that allocation, while also boosting revenues for designated SoH charter operators. This plan is grossly inequitable, applying non-uniform treatment across schools and usurping constitutional authority of local boards of education to efficiently operate a system of high-quality schools. The plan as currently proposed must be repealed. 

    • Revisit charter schools and charter sector statutes and regulations

    The U.S. Supreme Court may soon rule that charter schools under most state charter school laws do not operate as “state actors” and thus are not compelled recognize children’s constitutional rights to free speech, free exercise of religion, due process in cases of disciplinary action, or equal protection. Thus, it will fall on states to rewrite their charter school legislation to ensure that the protections available to children in charter schools are equal to those attending public district schools.[2]

    A second issue that must be addressed is the evaluation of a) current charter operators and their reauthorization and b) the vetting of potential outside providers. The state must tighten statutory and regulatory requirements – and apply existing ones – to ensure that providers of schools of choice are a) not having detrimental economic or demographic segregative impact on local neighborhoods and schools and b) are provided quality education as measured by relevant outcomes compared against schools serving similar student populations and with equitable resources. Outside providers wishing to be authorized should validate that they have been successful serving a representative population with respect to the spaces in which they plan to operate locally.

    A third issue that must be addressed is the equitable distribution of and cost-sharing for capital space. The SoH plan essentially provides squatters rights to recognized charter operators and then pushes the costs onto local districts. My previous writings have asserted that it may be reasonable to provide access to publicly owned and maintained capital for charter operators, rather than have them use tax dollars to acquire land and buildings for private ownership.[3] Publicly owned and operated schools are governed under the constitutional authority (in Florida) of local boards of education. The state may develop guidance for local boards of education to collaborate with charter operators for access to under-used district capital. Local boards can/should submit plans for such collaboration. This approach is favorable over selling those assets to affiliates of charter operators via 3rd party transactions wherein tax dollars are used to buy – via revenue bond debt, a facility that the public owns – and after buying that facility a second time, the public no longer owns it.[4]

    A fourth issue is the equitable financing of district and charter schools according to reasonable estimates of the costs associated with differences in student populations served, and with separate consideration of equitable cost sharing for capital space. On the first, point, a study conducted for the State of Maryland provides insights on the complexities of “commensurate” funding (e.g. “uniform” in a Florida context) for district and charter schools. [5]

    A final issue that must be addressed is transparency and thoroughness of financial reporting including reporting on and regulation of related party transactions of contractual services and for capital acquisition.[6] The latter can be mitigated by public oversight of access to publicly owned capital. Recent reporting by CBS News exposed the complex web of financial relationships between charter management companies and contracted service providers, most of which under current law, remain permissible, however suspect and opaque.[7] These issues can be fixed.[8]

    • Equal Opportunity for High Quality Schooling Commission

    The tacit acknowledgment in the SoH proposal that schools in Florida need more money – a lot more money – if we expect them to succeed, at high levels, while serving the state’s most disadvantaged communities – is a good starting point. As I noted in my report, funding matters for the quality of student outcomes that can be achieved. [9] Funding matters more in higher poverty, previously lower spending settings. Further, well designed state school finance policies are guided by outcome goals, wherein funding levels are calibrated with respect to the costs to achieve the desired outcome goals. Those costs vary across children and settings, to achieve comparable outcome goals.[10]

    The legislature should establish commission and engage the public in setting those goals and then working with qualified experts in determining the costs to achieve those goals across children and educational settings in Florida. Those analyses may guide a comprehensive reform of school funding for Year 2 of this plan.

    The back of the napkin spending increases proposed for Schools of Hope may be a useful guidepost for year 1 increases for the state’s highest poverty schools and districts, where those increases are just under $5,000 per pupil. Figure 26 of my report shows that if the state were to recapture even 70% of the budgeted school voucher funds for the current year, per pupil funding could be increased by just under $5,000 per pupil for the highest poverty quintile of school districts and $2,000 per pupil in the second highest poverty quintile. Per the relevant research on return on investment of education spending, this would be a far more productive and efficient allocation of those same dollars. District and charter schools would equally/uniformly benefit.

    • Resist any and all reductions or limitations on major tax revenue sources

    On average, tax and expenditure limits have long run detrimental effects on public service quality including the quality of public schooling measured by students’ outcomes or by the quality of inputs to schooling including class sizes and teacher compensation.[11] Florida district and charter schools are already suffering a lack of sufficient funding to produce high outcomes. As illustrated in my report, Florida’s local public school districts are highly efficient at producing outcomes with the resources available.

    At the same time, Florida school districts have become more dependent on local property tax revenues to maintain current levels of service. While the share of revenue from property taxes has increased over the past 30 years, current spending per pupil has remained stagnant. Eliminating, cutting or capping property taxes either inclusive of school property taxes or not will place undue strain on local county and municipal budgets that will either directly or indirectly squeeze public and charter school resources for both operations and capital. The appropriate approach would be for the state to identify new tax revenue sources and use those sources to increase state aid to municipalities and school districts, taking pressure off local property taxes. State aid is the best form of property tax relief, permitting the services to be provided at the level of quality desired with less burden on local taxation to cover the costs of those services.[12]

    Year 2 (2027 Session, fy2028) – Overhaul School Funding Formula & related Governance

    • Overhaul (replace) the School Finance Formula

    Adopt a comprehensive school finance formula designed to cover all annual operating costs of schools, with the exception of transportation and capital. That school finance formula, unlike the present formula, should be calibrated to ensure that every district and school statewide has the resources necessary for all children to have equal opportunity to achieve the desired outcomes (as vetted through the public engagement process in year 1).

    • That formula must include appropriate adjustments for the costs of serving children from different backgrounds and attending school across different settings. This includes but may not be limited to a) children from economically disadvantaged backgrounds, b) English learners, c) children with disabilities. Geographic and location factors should include but may not be limited to a) very small schools in remote, sparsely populated locations, b) differences in labor costs (associated with recruiting/retaining teachers of comparable qualifications across locations).
    • That formula should be inclusive of uniform funding for charter schooling, with potential exclusions (or charges applied) for services provided to charter students through the host district.
    • Separate, equitable formulas must be developed for a) the financing and allocation of capital (educational spaces) for district and charter enrolled students, and b) the financing centralized planning of transportation services.
    • Phase down (and out) funding of any new cohorts of voucher students

    This should free up substantial resources to support the first recommendation above, but additional revenues will likely still be needed.

    • Reorganize/reconstitute charter operators that do not contribute positively to equity or efficiency

    Florida has far too many charter operators that underserve children with disabilities, English learners and children from economically disadvantaged backgrounds, and yield poor academic outcomes for those they do serve when compared to district regular and magnet schools serving similar student populations.

    Using policy tools (legislation and regulations) developed in year 1, the state should begin the process of reconstituting these schools. Decisions should be based both on whether a school (or operator of many schools) contributes to or erodes equity with respect to students served versus those served in surrounding schools and residing in surrounding neighborhoods, in addition to performance metrics based on the population served. Any changes to or closures of schools should consider the least disruptive option for those currently enrolled. 

    NOTES


    [1]Baker, B.D. (2025) Financing a High-Quality System of Free Public Schools for Florida’s Children https://schoolfinance101.com/wp-content/uploads/2025/11/florida_school_finance_12.02.25.pdf

    [2] Green III, P. C., & Eckes, S. E. (2024). All Aboard!: Making Charter School Boards All-Purpose State Actors under the Supreme Court’s Amtrak Case. Drake L. Rev., 71, 562.

    [3] Baker, B. D. (2016). Exploring the Consequences of Charter School Expansion in US Cities. Economic Policy Institute. https://files.eric.ed.gov/fulltext/ED588750.pdf

    Baker, B., & Miron, G. (2015). The Business of Charter Schooling: Understanding the Policies That Charter Operators Use for Financial Benefit. National Education Policy Center. https://files.eric.ed.gov/fulltext/ED574733.pdf

    [4] Baker, B.D. (2015) We bought it twice but we nolonger own it. School Finance 101. https://schoolfinance101.com/2015/07/21/we-bought-it-twice-but-we-no-longer-own-it-is-co-location-the-better-option/

    [5] Levin, J., Baker, B., Atchison, D., Brodziak, I., Boyle, A., Hall, A., & Becker, J. (2016). Study of funding provided to public schools and public charter schools in Maryland. American Institutes for Research. https://marylandpublicschools.org/stateboard/Documents/01242017/TabG-CharterPublicSchoolFundingStudy.pdf

    [6] Green III, P. C., Baker, B. D., & Oluwole, J. O. (2018). Are charter schools the second coming of Enron: An examination of the gatekeepers that protect against dangerous related-party transactions in the charter school sector. Ind. LJ, 93, 1121.

    [7] https://www.cbsnews.com/video/florida-charter-school-company-gop-figure-parents-frustrated/

    [8] https://theconversation.com/charter-schools-exploit-lucrative-loophole-that-would-be-easy-to-close-111792

    [9] Baker, B. D., & Knight, D. (2025). Does money matter in education? Albert Shanker Institute. https://files.eric.ed.gov/fulltext/ED671888.pdf

    [10]Atchison, D., Levin, S., Levin, J., Kolar, A., Blair, D., Srikanth, A., & Salvato, B. (2024). Equity and Adequacy of Colorado School Funding: A Cost-Modeling Approach. https://www.cde.state.co.us/cdedepcom/schoolfinancecostmodelingadequacystudyreport

    D. Atchison, B.D. Baker, J. Levin, S. Fatima, A. Trauth, A. Srikanth, C. Herberle, N. Gannon-Slater, L. Junk, K., Wallace, L., & Baker, B. (2023) Assessment of Delaware Public School Funding. https://education.delaware.gov/wp-content/uploads/2023/12/23-22933_1_Delaware_Full_Report-FMT-ed103023-Version-2.pdf

    Atchison, D., Baker, B.D., Levin, J., Kearns, C. (2020) New Hampshire Commission to Study School Funding, Final Report. https://carsey.unh.edu/sites/default/files/media/2020/09/20-12685_nh_final_report_v10.pdf

    Brooks, C., Levin, J., Baker, B., & Salvato, B. (2025). Understanding the Cost of Providing Adequate Educational Opportunity in Oregon. https://olis.oregonlegislature.gov/liz/2025R1/Downloads/CommitteeMeetingDocument/291280

    [11] Downes, T. A., & Figlio, D. N. (2012). Tax and expenditure limits, school finance and school quality. In Handbook of research in education finance and policy (pp. 395-410). Routledge.

    [12] Baker, B. D., Di Carlo, M., & Oberfield, Z. W. (2023). The Source Code: Revenue Composition and the Adequacy, Equity, and Stability of K-12 School Spending. Albert Shanker Institute.

    Financing a High-Quality System of Free Public Schools for Florida’s Children

    Press Release

    Full Report

    Slide Deck

    Executive Summary

    The report that follows draws on a) literature on how and why money matters for improving school quality and the quality of education systems as a whole, b) frameworks for understanding and evaluating state school finance systems, including systems for financing schools of choice, and c) data from national and state sources, on states across the nation, Florida school districts in the context of their national peers and Florida district and charter schools in their local contexts.  The data summarized herein illustrate the following.

    First, regarding long term trends in Florida school funding, adequacy and efficiency:

    • Florida schools have been squeezed by declining state aid since the early 2000s as the state has pursued a race to the bottom on taxpayer financing of public elementary and secondary schools, ranking near the bottom among all states in recent years.
    • That squeeze has resulted in declining competitiveness of teacher wages over time and even more so, declining staffing ratios in schools, increasing the workload on those that remain.
    • Adjusted for labor costs over time, school spending per pupil in Florida and in Miami-Dade specifically, is less than it was 30 years ago.
    • Florida school districts have responded by producing achievement levels beyond expectations given the resources they’ve been provided. Florida school districts are efficient when compared to school districts nationally, accounting for differences in costs.
    • But because of the long slow reduction in effort, spending, staffing ratios and competitive wages, student outcomes in Florida have continued to decline, dropping among states and dropping in recent, post-COVID years as other states and the nation, on average, have begun to rebound.
    • As the state has reduced its share of funding for public schooling, local districts have been forced to make up the difference with increased property taxes, to mitigate further damage to student outcomes by slowing the erosion of competitive wages for teachers.

    Second, regarding providing equal educational opportunity to all children in Florida:

    • The state school finance system provides no discernable support to schools serving students with greater educational needs, outside of additional support for children with disabilities.
    • The state’s charter school sector exacerbates inequality across student populations by operating within low-income neighborhoods, but serving far fewer children from low-income families, fewer children who are English learners and fewer children with disabilities.
    • The state’s charter school sector also yields poor educational outcomes on state assessments when compared to traditional district schools or district magnet schools serving similar populations within the same district.

    Finally, regarding spending for the greatest return on investment:

    • The state has currently budgeted $3.8 billion dollars to be spent on students attending private schools, approximately 70% of which will likely be spent on children from higher income families who had not previously attended public district schools. That 70% of $3.8 billion would likely yield far greater return on investment and greater public benefit, based on existing research, if invested in public district schools in high poverty settings.

    These findings lead to a clear set of policy recommendations. As shown in this report, the state has the economic capacity to pursue these recommendations. Even at the state’s own prior (2000s) education effort, funding for public schools would be 28% higher than it is presently. Add to that, more efficient allocation of funds currently being diverted to the school voucher program, and much of the state’s public education adequacy gap could be eliminated. As such, we propose the following recommendations:

    Recommendation #1 – Phase 1: Engage in the work of setting a manageable standard of “high quality” public schooling for Florida’s children by engaging in analyses of the costs associated with providing each and every child in Florida with equal educational opportunity to achieve high education outcomes.

    1. Establish a statewide commission on school funding.
    2. Engage stakeholders in setting standards of excellence for Florida children.
    3. Engage experts to estimate the costs associated with meeting those standards, applying appropriately rigorous methods.

    Recommendation #1 – Phase 2: Guided by those estimates, reform the school finance formula and increase state aid to schools so as to provide them with the necessary resources for all children to have equal educational opportunity to achieve high education outcomes. That is, meet the constitutional standard ratified by Florida voters in 1998 and 2002. This should include estimates of commensurate funding for charter schools, based on needs and costs.

    1. Take eliminating or reducing property taxes off the table. The most effective form of property tax relief is increased state aid, as would occur under implementation of this recommendation.

    Recommendation 2 – Part 1: Impose a moratorium on charter school expansion, including the Schools of Hope Program. The existing charter school sector in Florida is compromising equity, eroding efficiency and producing poor educational outcomes for those it serves. New York’s Success Academies have no proven track record of serving children like those they’d be called upon to serve in Miami-Dade, having served very few English learners and underserving Latino communities in New York. Like Miami-Dade’s current charter sector, they have also underserved low-income populations and children with disabilities. Introduction of Success Academies in Miami-Dade will likely exacerbate equity concerns that are already significant.

    Recommendation 2 – Part 2: Establish new regulations for evaluating existing charter operators and vetting new charter operators to ensure improved equity in the distribution of students by their needs across schools. Adopt and enforce stricter regulations pertaining to student outcomes.

    Recommendation 2 – Part 3: Adopt updated charter school legislation to ensure that charter schools are sufficiently “public,” required to operate as if “state actors,” protecting children’s constitutional rights and abiding by all relevant federal statutes.

    Recommendation 3: Freeze expansion of the voucher program to free up state resources to support a fully funded, overhauled public school finance formula, to provide a uniform system of free public schools.

    What’s up with New York State School Finance?

    Full Report

    Press Release

    Slide Deck

    Executive Summary

    In this brief, I draw the following conclusions regarding New York’s Foundation Aid formula:

    • Conclusion 1: The current iteration of the Foundation Aid formula does not rationally determine what districts need to spend, or what they actually spend, in order to achieve adequate outcomes;
    • Conclusion 2: The foundation formula has continued to drift further, over time, from funding even its own (inadequate) hypothetical sound basic funding level;
    • Conclusion 3: Standards, goals and context of the education system have changed, with both broader and higher expectations and greater needs and cost pressures across the state.

    These conclusions are supported by a series of calculations using publicly available data, showing that the foundation aid formula was built on measures and calculations that could never fully fund districts’ spending needs to meet desired outcome standards, even at the time of adoption. Failure to update the Foundation Aid base with respect to changes in instructional spending for successful, efficient school districts has led to increasing gaps between formula calculations and actual instructional spending needs.

    The Foundation Aid formula requires both short term fixes and a longer term overhaul, driven by cost analyses to determine the spending levels needed to achieve today’s outcome standards, for all children across all districts and settings.

    Short term fixes derived from the analyses herein include:

    1. Increasing base aid to better reflect general instructional expenditures of successful, efficient districts. The minimum increase justified herein would be 10.75% above next year’s inflation adjusted base. Were that to have been implemented for fy2026, the base would be $9,162 (10.75% above the adopted base of $8,273).
    2. Noting that adjustments for student needs were never based on any empirical analyses, and drawing on related work,[i] I would suggest adding and increasing adjustments for student needs, including adjustments for children from homeless, foster care and migrant families, and increasing weighting for English learners, with each weight being adopted or moved toward 1.0 additional funding. 

    In the longer term, over the next year and a half, with intent to reform Foundation Aid for fy2028, the state should conduct a rigorous analysis of the spending required to achieve current desired outcome goals for all children. That analysis must identify a comprehensive spending measure – not merely general instructional spending – with appropriate adjustments for student needs and regional cost variations. Both the base and each adjustment should be grounded in rigorous empirical analysis, which was never done previously. Only by conducting such analysis to inform the calibration of a modern school aid formula can the state be confident that the formula meets the needs of all students, here and now.

    Additional Resources

    Folder with All AIR Report Briefs


    [i] https://cee.tc.columbia.edu/media/centers-amp-labs/cee/publication-pdfs/AIR-Report-2–Student-Outcomes-and-Student-Need—Final-10-29-24-1-1.pdf

    ICYMI: Reforming New Jersey School Funding in 2026

    Mark Weber’s Summary Post at NJPP

    Full Report

    Summary

    Report Finds New Jersey Must Recalibrate School Funding Formula to Meet Modern Educational Needs

    Miami, FL — A comprehensive new study concludes that New Jersey’s two-decades-old school funding formula no longer reflects the costs of educating today’s students to the state’s higher standards—and requires a substantial recalibration to restore equity, adequacy, and effectiveness.

    The report, Estimating the Costs of an Adequate Education in New Jersey: Recalibrating the School Funding Reform Act for the Next Decade, authored by Bruce D. Baker, Professor at the University of Miami, provides the first fully data-driven statewide cost model built using school-level expenditure and outcome data from 2019–2024.

    Despite New Jersey’s longstanding reputation as a national leader in public education and school funding effort, the study finds that the School Funding Reform Act (SFRA)—enacted in 2008 using cost assumptions built from 2004 data—no longer aligns with current student needs, academic standards, or district demographics.

    Key Findings

    • Higher standards and changing student populations have outpaced the funding formula. The current SFRA weights do not reflect the actual costs of meeting today’s academic expectations, especially for students experiencing poverty, multilingual learners, and students with disabilities.
    • Funding progressiveness has eroded dramatically. After two decades of rising equity, New Jersey’s funding distribution is now flatter than in the 1990s, leaving high-poverty districts without the resources needed to match the outcomes of their peers.
    • Many districts operate below the funding levels required to achieve statewide average outcomes. Cost modeling shows substantial gaps between what districts spend today and what is needed to achieve adequate outcomes—particularly in high-poverty communities.
    • Current spending patterns do not match need. The report finds only weak alignment between present school-site spending and the needs of economically disadvantaged students, multilingual learners, and others requiring additional support.
    • A modern cost model identifies the factors that drive the true cost of equal educational opportunity. These include poverty concentration, neighborhood conditions, disability incidence, English learner status, district size, competitive wage variation, and the effects of charter and private school market share.

    Major Recommendations

    The report outlines several pathways for recalibrating SFRA:

    Short-Term (FY 2027)

    • Update and expand student need weights, particularly for economic disadvantage and multilingual learners.
    • Adjust base costs to reflect the actual spending required to achieve current outcome benchmarks.
    • Address underfunding in districts below adequacy.

    Mid-Term (FY 2028–29)

    • Overhaul the economic disadvantage measure using a new Economic Disadvantage Index that more accurately captures the relationship between poverty and outcomes.
    • Revisit special education cost structures using updated disability prevalence and placement patterns.
    • Incorporate geographic cost adjustments based on modern wage data.

    Longer-Term

    • Strengthen the Education Adequacy Report process to require rigorous, recurring cost analyses.
    • Ensure transparency and public access to data used in calculating formula adjustments.
    • Reassess the structural implications of school district size, population density, and charter expansion on efficiency and equity.

    A Call to Action

    “New Jersey’s students continue to be among the highest-performing in the nation,” said author Bruce Baker, “but the state’s commitment to equitable, adequate school funding has slipped. The data clearly show that to maintain excellence—and extend it to all children—New Jersey must realign its school finance system with the realities of today’s classrooms.”

    The report urges state leaders to use this modeling framework to guide the 2026 Education Adequacy Report and upcoming legislative deliberations on school finance reform.

    About the Author

    Bruce D. Baker is a national expert in school finance and a professor at the University of Miami. He has led school funding adequacy and cost modeling studies in Vermont, New Hampshire, Delaware, Colorado, Oregon, and Texas, and is co-author of multiple national reports on educational resource equity.

    Revisiting Deceitful Claims about School Funding and Outcomes (a thread)

    I’ve had enough. This has to stop. I’ve explained on at least a few occasions that there exists a cottage industry for whom their bread and butter is telling state legislatures and judges that money simply doesn’t matter for schools (Merchants of Doubt): That public schools all have more than enough to do what they need to do and they all just need to do better with what they have – especially those over-funded schools in high poverty settings.

    I’ve also explained that the two most disingenuous junk analyses oft used to “display” that money doesn’t matter are various forms of the “long term trend” graph (money went up, outcomes were stagnant or went down, so money can’t matter) and the “clouds of doubt” graphs (with money on the X and outcomes on the Y, there’s no apparent relationship). These bogus assertions and deceitful illustrations should have died a long time ago. Why? because they are bogus and deceitful and because those who now insist on continuing to use them have been informed, over and over again. So they are bogus and INTENTIONALLY deceitful. Period. Full Stop. (and not this author’s first offense by any means)

    So, here’s a BlueSky thread from a short while back:

    The link: https://www.educationnext.org/could-disappointing-2017-naep-scores-due-to-great-recession/

    Here are those graphs – for Oregon, because we had to spend a stupid amount of time explaining why the Edunomics analysis was garbage to policymakers in that state:

    Link to that report: https://www.shankerinstitute.org/resource/does-money-matter-in-education

    link to book: https://hep.gse.harvard.edu/9781682532423/educational-inequality-and-school-finance/ Full discrediting of “long term trend” AND “clouds of doubt”

    Link to paper on how to conduct rigorous analyses of funding and outcomes: https://edworkingpapers.com/ai25-1127

    Link to that report – which actually applies rigorous analyses: https://olis.oregonlegislature.gov/liz/2025R1/Downloads/CommitteeMeetingDocument/291280

    Even TikTokers an see through this flimsy stuff (and I don’t like much of what this guy posts):

    Link: https://www.tiktok.com/@nicholasjkurian/video/7476603053466979614

    Preserving an Educated Future for America (Short Term Plan)

    Draft excerpt from forthcoming work:

    The short-term plans presented here are focused primarily on mitigating damages inflicted by the current federal administration, focusing on states likely to fight back and pursue educational equity and excellence on their own. I have less short-term hope for other states that have been green-lighted and even incentivized to engage in additional erosion of public schooling. Mississippi is presently proposing elimination of its income tax, the primary source of funding for public education and Florida is discussing elimination of property taxes, the primary source of that state’s funding for public schools, meanwhile diverting substantial funds to voucher programs (Baker et al., 2025). Neither state’s high court has previously affirmed their own constitutional requirements to be enforceable, however strong or recent the constitutional language. Other low spending, generally low performing states are taking similar steps to erode their public education systems.[1] At the same time, federal aid is at risk and those same states are the most reliant on federal aid (Baker, 2025c). The short-term prospects for children in these states are bleak.

    It may be that the best we can do for the next few years, while facing a federal administration hostile to public education and seeking actively to undermine it, is to work with states that remain committed to providing quality public schooling, such that they may be beacons as we emerge from these times.  Southern states resisted federal policies a) during reconstruction and b) during the civil rights era, adopting state policies to undermine the provision of more equitable and adequate education to all. The Education States (not exclusively “blue” or northern) as I will call them here, might use similar strategies this time around to advance education equity and equal opportunity, including racial equality, in the face of a federal administration which seeks to ban these very things and even the words that describe them. We might be wise to focus on those states where state courts have been willing to uphold AND enforce education quality and access standards, those states where legislators and governors have done so, whether court ordered or not and those that have already refused compliance with anti-equity demands of the current administration.

    We are in an era where efforts to advance educational progress depend on states, state legislatures, governors and states’ own constitutional requirements (Corbin, 2025). Unfortunately, the current federal administration has not merely deferred to state’s own preferences but has chosen to weaponize federal aid to coerce states to oppose principles of equity and inclusiveness. As noted previously, the recent shift in federal policy has been a green-light for some states to go even further. Thus, the following short-term efforts might best focus on states: 1) that have maintained or reinstated effort to fund schools (or shown willingness to do so); 2) that have maintained or reinstated progressive funding (funding targeted to areas of greater need); and 3) where state high courts have enforced education rights in recent decades (and where legislatures have been responsive). Kansas, for example, despite being a “red” state, meets all three of these goals (Baker, 2022).

    Antiregulations for the Modern Era

    During the civil rights era in the 1960s, when the first significant direct federal aid to local public schools was introduced (under ESEA) and regulations adopted to enforce school integration, southern states adopted state aid adjustments, local tax policy changes and other resistance policies to support districts refusing desegregate (Bagley, 2018; Baker & Green, 2005; Milligan, 2018). These aid provisions were part of antiregulations acts, referring to opposition to federal regulations requiring desegregation.  Ironically, these are the states that are now most dependent on federal aid. By the time of this writing, several states and local district officials have responded to the current administration’s threats to withhold federal aid for any school or state promoting equity with a hard “NO.” These states should consider adopting into law, provisions that protect the revenues of their local public school districts by filling any temporary or permanent losses with additional state funds. The same strategy used during the civil rights era, to oppose civil rights, should now be used to protect them.

    Federally tax-exempt state education endowments

    Many if not most of the Education States are higher income and high GDP states which over the years have contributed more in federal taxes than they receive from the federal government in aid, programs and services. Taxpayers in northeastern states with strong public education systems, are subsidizing underfunded, increasingly oppressive, discriminatory (removing undocumented children), increasingly Christian nationalist (via voucher programs, religious charter schools and bibles in public district schools) school systems in states like Louisiana, Alabama, Mississippi and Oklahoma. These same taxpayers took an additional hit when the Federal tax code was revised to place caps on the deduction of state and local taxes (SALT deduction). Admittedly, these are equity-oriented tax provisions. These provisions lead to more progressive taxation and redistribution from wealthier to poorer states. That should be a good thing and would be necessary under my long-term plan (a later post, but also, earlier version here). But in the present times, these provisions are a) penalizing the Education States for having higher taxes and spending on schools and other state and local services and b) subsidizing the expansion of Christian Nationalist and other religious (and racially) exclusionary schooling in other states, through what has been proposed as a national voucher program .

    Under the circumstances, to preserve public education in the national interest, I propose that the Education States establish federally tax-exempt Endowments for the Future of Education in which to hoard (yes, hoard, sadly, hoard) significant war-chests of (1 to 2% of GSP for the next 5 years) to stabilize elementary and secondary education funding in future years. The goal is to convince as many individual and corporate taxpayers to contribute as much as possible to these funds (reducing their federal taxable income) in support of their state’s education and economic future. That is, I am encouraging the Education States to be Harvard in this moment. It’s a substantial uphill climb to build an endowment of such magnitude. But in these states where so much personal and corporate wealth have been accumulated over time, it is not infeasible to build endowments that can, in four to five years’ time, generate hundreds to thousands of dollars per pupil to be directed toward the highest need schools and districts, and buffer the state’s schools from future economic uncertainty.[2]  

    Significant public school endowment funds are not an unprecedented concept. For example: “The Texas Permanent School Fund (PSF) was created by Texas’ first Constitution in 1845 as a perpetual fund to support the state’s public schools and was seeded with $2 million in 1854. Since that time, the PSF has grown to comprise over $57 billion in assets and will distribute over $2.4 billion annually to Texas K-12 schools.”[3] Texas PSF is 57.3 billion in 2024 which is about 2.2% of GSP. It yields 2.4 billion per year to support the available school fund. Other states, including Alaska have similar funds.[4]

    Expanding & Improving State Data Capacity

    As continued collections of federal data erode, have gaps or are at risk of elimination, Education States should take steps to improve the quality of their own data and research capacity, including continuing and improving upon collections of statewide school level expenditure data and collections of a wider array of student outcomes, from assessments across additional content areas to more detailed measures of completion and dropout rates, chronic absence and more. Many states have already engaged with outside consultants to compile their data, construct comprehensive outcome measures, set goals and standards, and estimate statewide school level models of the costs of meeting those standards. The findings from these models have been increasingly consistent in recent years (Atchison et al., 2023; Atchison et al., 2025; Brooks et al., 2025).

    Interstate consortia for the improvement of education data and evaluation could lead to improved data collections on measures including school revenue and spending and greater consistency on student outcome collections across states. These efforts may lead to improved federal data collections in the future (as those data collections typically occur through states, presently, with federal guidance and vetting of data), including improved methods for harmonizing and cross-walking revenue and spending measures across states.

    Unblurring the Lines between Public and Private

    I close here with a bleak foreshadowing of our Supreme Court’s next possible move in further dismantling church/state separation in public schooling in the United States. Chief Justice Roberts in Espinoza v. Montana Dept. of Revenue explained that if and only if a state does provide funding for private, non-state-actors to provide education, then that state cannot exclude religious providers. But, that’s only if the state chooses to provide funds to private providers. In his dissent in Espinoza, Justice Breyer pointed asked “what about charter schools?” noting the ambiguity of their status under widely varied state charter statutes.

    The court is now considering this public/private status question in a case where an Oklahoma charter school wishes to operate openly as a religious school. If the court determines it to be private (non-state-actor), then a) it most certainly can, and b) other religious operators cannot be denied similar opportunity to apply for and run charter schools. As I’ve previously written, this opens the door to these same schools refusing (likely succeeding at the Supreme Court) to comply with any/all regulations they claim conflict with their religious views, including racial discrimination (Green, Eckes & Baker, 2024).

    We are at a point where there is only one way to shut this down in states that wish to preserve strong, accessible, public education systems. Voucher programs are rare or small in what I have referred to here as the Education States. That is no coincidence. But charter schools have a significant presence in the Education States, and these states must either substantially tighten state charter school laws, allowing only government authorization and oversight, defining governing boards and board members of charter schools to be public officials (subject to all laws pertaining to public officials) and making all employees of those institutions public employees, perhaps under the contract of the local host district. While these changes may seem restrictive and unappealing to existing charter operators in those states (like New Jersey, New York, Massachusetts and Connecticut), the alternative is to eliminate charter schooling altogether, to ensure that religious and discriminatory charter schools cannot make their way into the state.

    This also means that states like Vermont, Maine, New Hampshire and Connecticut which have long been home to “town academies,” many formed by private citizens and benefactors as centralized secondary schools in the early to mid-1800s to serve surrounding communities, will have to take steps to change the status of those schools. In Carson v. Makin, the court decided that these academies were enough of a crack in the door to require states to provide similar funding for religious alternatives. States that are home to these town academies will need to either eliminate funding for them or require academies to be sold to and/or absorbed by their local public school districts or the state. Unfortunately, the courts have left us with no alternative but to seal off that crack in the door as well.


    [1] https://www.cbpp.org/research/state-budget-and-tax/tracking-the-fallout-from-state-tax-cuts

    [2] We understand that it is likely that the current federal administration would seek to deny tax exempt status for these state created, privately governed endowment funds. That said, they are quite similar to pass through organizations used in state tuition tax credit and voucher programs. One strategy to counter this move is to declare these endowments to be religious organizations – Endowment for the Church of the Educated Public – wherein their mission is to support the provision of public schooling to all across their state. More details to be provided as needed in future writings. 

    [3] https://texaspsf.org/

    [4] https://pfd.alaska.gov/

    Defining Productivity, Cost, and Efficiency

    Recycled material here…

    The central problem with US public schools is often characterized as an efficiency problem. We spend a lot and don’t get much for it; and over time we’ve spent more and more but our outcomes have remained virtually flat. Yet rarely are these claims accompanied by thorough analysis or empirical evidence of cost-effectiveness or efficiency.[i]

    We must not get too caught up in the possibility of identifying the perfectly efficient school or district or the absolute minimum that might possibly be spent to achieve a given level of outcomes with x children under y conditions. Measuring such hypothetical extremes is impractical. That said, much can be learned by better understanding the average efficiency at which existing schools and districts produce certain outcome measures for their students and the deviations around those averages.

    Some basic definitions are in order:

    • productivity: The output of our system of schooling, measured in terms of quantity of output or quality of output, or both. Quantity measures often include total numbers of students served or graduated; quality measures are often reduced to measures derived from standardized tests, usually of reading and mathematics achievement between grades 3 and 8. Increasingly, the quality of outcomes produced is measured in terms of changes in assessment scores over time associated with students’ time of attendance in a particular school or district (value-added estimates). Outcomes may also include longer-term outcomes, such as income or civic participation.
    • spending: Expenses (current and deferred) associated with the provision of educational programs and services and related supports (food, transportation, overhead), regardless of outcomes
    • cost: The minimum amount that would need to be spent to achieve a specific level of student outcomes, given the backgrounds of the students served and other potential contextual constraints (variations in the competitive wages for qualified employees, remoteness and population sparsity, economies scale, etc.). Cost necessarily connects spending with outcomes.
    • efficiency: Given the previous two definitions it is possible to spend more than would be needed to achieve a given level of outcomes. That margin of difference is inefficiency.

    spending – inefficiency = cost

    or

    cost + inefficiency = spending

    The margin of spending above cost is labeled inefficiency; but when we discuss measurable inefficiency of schools, the term takes on broad meaning, including spending on programs and services that may be valued but not measured as primary goals/objectives. For example, institutional expenditures may include expenditures on community-based programs and events, athletics, and arts that may marginally, if at all, contribute to student test scores. This is not to suggest, however, that these expenditures are unnecessary or inappropriate. Rather, they are simply not captured by the outcomes being measured because they serve a different, but still valued, purpose.

    Often, when pundits talk about “cost-cutting” measures, they are really talking about spending reductions, whether they result in declining outcomes or whether outcomes remain constant. Actual cost cutting that holds outcomes constant—doing the same with less—would, theoretically, be efficiency improvement. By contrast, less spending leading to lower outcomes is a break-even on efficiency.


    [i] Bruce D. Baker and Kevin G. Welner, “Evidence and Rigor: Scrutinizing the Rhetorical Embrace of Evidence-Based Decision Making,” Educational Researcher 41, no. 3 (2012): 98–101; Bruce D. Baker and K. G. Welner, Productivity Research, the US Department of Education, and High-Quality Evidence (Boulder, CO: National Education Policy Center, 2011), http://nepc.colorado.edu/publication/productivity-research.