In a recent report, Gary Miron and I discuss some of the differences in resource allocation practices between Charter operators and district schools. Among other things, we discuss the apparently high administrative expenses of charter operators. But in that same report, we explain that some of these higher administrative expenses, and, as a result lower instructional expenses, result from bad policy structures that constrain resource allocation and/or induce seemingly illogical behaviors.
Some have pointed out to me that this assertion of higher administrative and lower instructional expense by charter operators runs counter claims made by Dale Russakoff in her book The Prize. My doc student Mark Weber has already thoroughly rebutted Russakoff’s anecdotal claims. Put bluntly. Those claims were supported only by anecdote and run in contrast with the larger body of data in New Jersey (see Mark’s post) and larger literature on the topic. The summary below addresses additional literature on this topic.
[to be clear… and this is a topic for another post, or perhaps Matt Barnum will do a piece on this… there is little if any evidence that administrative expense shares alone are an indicator if “inefficiency,” where inefficiency is defined as a reduction in outcomes produced for the same aggregate dollar input]
In a related recent post, I explain whether “chartering” can tell us much/anything about whether and how money (and resources that cost money) are associated with measured student outcomes.
Below is a section of a separate, forthcoming paper (coauthored with Mark Weber), in which we evaluate school site staffing expenditure differences between district, non-profit and for-profit charter operators.
Charter School Administrative/Instruction Expense
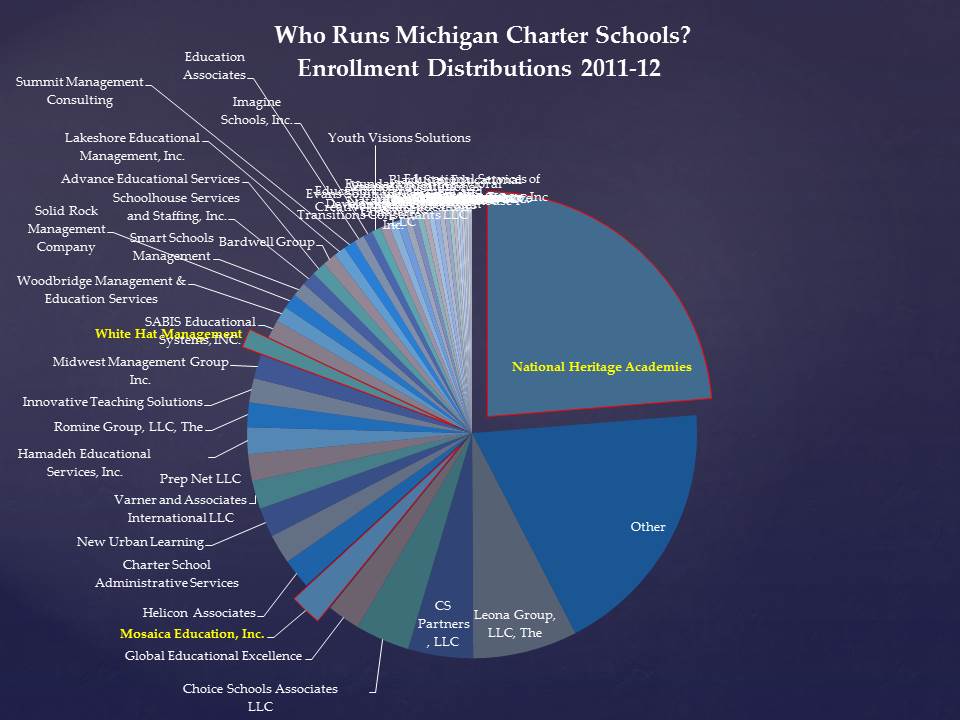
A handful of studies over time have addressed questions similar to those we address herein, asking more specifically about the differences in administrative overhead expenditures of charter schools. Two studies of Michigan charter schools, which operate fiscally independently of local public districts, have found them to have particularly high administrative expenses and low direct instructional expenses. Arsen and Ni (2012) found that “Controlling for factors that could affect resource allocation patterns between school types, we find that charter schools on average spend $774 more per pupil per year on administration and $1141 less on instruction than traditional public schools.” (p. 1) Further, they found “charter schools managed by EMOs spend significantly more on administration than self-managed charters (about $312 per pupil). This higher spending occurs in administrative functions traditionally performed at both the district central office and school building levels.” (p. 13)
Izraeli and Murphy (2012) found that district schools in Michigan tended to spend more on instruction per student than did charter schools, and the gap grew by about 5 percent to nearly 35% percent over the period studied (1995-96 to 2005-06) (p. 265). Further they found the spending gap for instructional spending to be greater than that for general spending. The overall funding gap between district and charter schools was approximately $230. The spending gap for basic programs was $562 and for total instruction $910. The authors note “much like a profit-maximizing firm, charter schools generate a surplus of revenue over expenditure.” (Izraeli & Murphy, 2012, p. 265)
Bifulco and Reback (2014) explore the complex relationship between fiscally dependent charter schools and their host districts in upstate New York cities. Particularly relevant to our investigation is Bifulco and Reback’s finding that having fiscally dependent charter schools separately affiliated with outside management companies and governance structures can create excess, redundant costs (p. 86).
Others have explored teacher compensation in relation to instructional expense in charter schools. In a recent comprehensive review of charter school research, Epple, Romano and Zimmer (2015) summarize that “On the whole, teachers in charter schools are less experienced, are less credentialed, are less white, and have fewer advanced degrees. They are paid less, their jobs are less secure, and they turnover with higher frequency.” (Epple, 2015) Similarly, in a report on spending behavior of Texas charter schools Taylor and colleagues (2011) explain that much of the difference between instructional and non-instructional expense across differing types of charter and district schools is tied to differences in teacher compensation. The authors explain that “open-enrollment charter schools paid lower salaries, on average, than did traditional public school districts. Average teacher pay was 12% lower for teachers in open-enrollment charter schools than for teachers in traditional public school districts of comparable size, and adjusted for differences in local wage levels, average teacher pay was 24% lower. Average teacher salaries were lower not only because open-enrollment charter schools hired less experienced teachers, on average, but also because open-enrollment charter schools paid a smaller premium for additional years of teacher experience.” (p. ix)
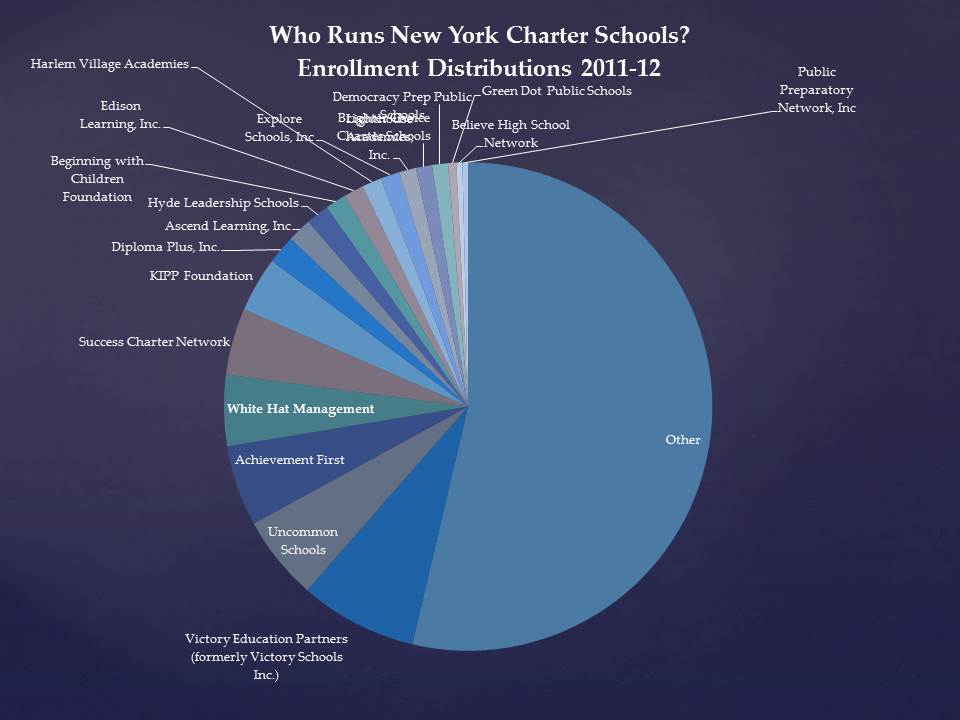
Research by Gronberg, Taylor and Jansen (2012) also points to the revenue enhancement activities of some charter management companies, most notably KIPP schools. The authors find that some KIPP schools in Texas had nearly doubled their per pupil public subsidy through private philanthropy. Baker and Ferris (2011) and Baker, Libby and Wiley (2012, 2015) find similarly that some Charter Management Organizations have significant potential for revenue enhancement. Baker, Libby and Wiley (2012) explain “We find that in New York City, KIPP, Achievement First and Uncommon Schools charter schools spend substantially more ($2,000 to $4,300 per pupil) than similar district schools. Given that the average spending per pupil was around $12,000 to $14,000 citywide, a nearly $4,000 difference in spending amounts to an increase of some 30%.” But, while some New York City based CMOs raised substantial private funding, others did not, and charter schools operating in other locations in Ohio and Texas had much less access to philanthropy.
Relative Efficiency & Underlying Differences
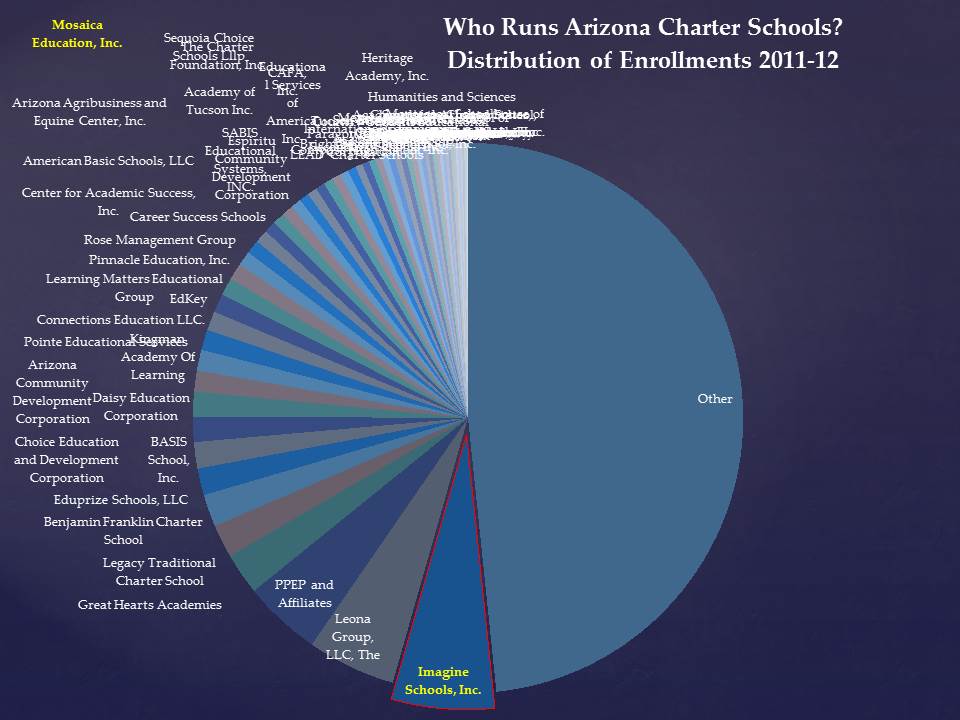
Of particular interest herein are studies of the relative effectiveness or efficiency of charter schools operated by for-profit management companies, including operators of online schools. Rigorous, peer reviewed literature on these schools remains limited, and much of it dated, evaluating charter expansion from the late 1990s through mid-2000s. King (2007) evaluated the effectiveness of Arizona charter schools, where there exist significant numbers of for profit firms. King (2007) found, based on data from 2003-2004 that “there is some evidence that for-profit charter schools are achieving higher test scores, however, given the insignificant findings for many of the for-profit specifications, a definite conclusion cannot be reached based on this one study alone. (King, 2007, p. 744) However, in a broader, more recent and more empirically rigorous analysis of Arizona charter schools as a whole Chingos and West (2014) found that “the performance of charter schools in Arizona in improving student achievement varies widely, and more so than that of traditional public schools. On average, charter schools at every grade level have been modestly less effective than traditional public schools in raising student achievement in some subjects.” (p. 120S)
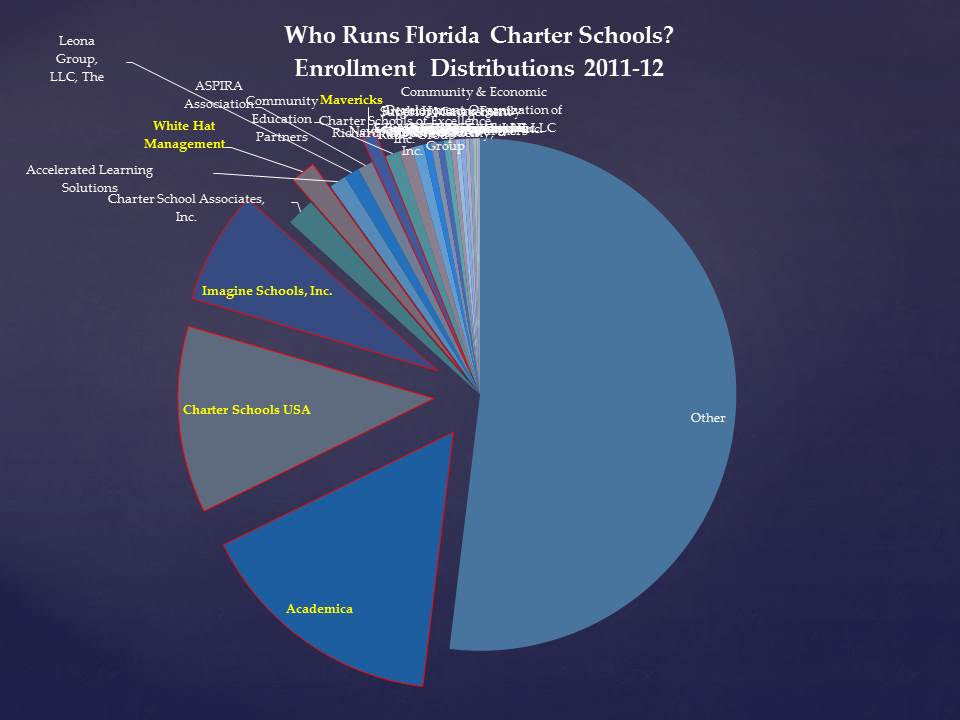
Studies on Michigan charter schools, another state we identify has having significant shares of children enrolled in for-profit schools, have also yielded mixed findings over time regarding effectiveness and relative efficiency. Bettinger (2005) found that during the early years of Michigan charter schools, “test scores of charter school students do not improve, and may actually decline, relative to those of public school students.” (p. 133) Hill and Welsch (2009) found “no evidence of a change in efficiency when a charter school is run by a for-profit company (versus a not-for-profit company). (p. 147) They explain further: “The results of this paper find no evidence that schools managed by for-profit companies deliver education services less efficiently than schools run by not-for-profit companies; this matches recent results found by Sass (2006).” (p. 164) That is, the shift from nonprofit to for-profit management status caused no systematic harm to measured student outcomes. Sass (2004) in an early study of Florida charter schools by their management status had also found no significant performance differences between schools managed by nonprofit and for-profit providers, but had found that for-profit providers serve substantively fewer children with disabilities. (p. 91)
Perhaps the strongest evidence of charter school efficiency advantages comes from the work of Gronberg, Taylor and Jansen (2012) on Texas charter schools. The authors find that, generally, Texas “charter schools are able to produce educational outcomes at lower cost than traditional public schools—probably because they face fewer regulations—but are not systematically more efficient relative to their frontier than are traditional public schools.”(p. 302) In other words, while the overall cost of charter schools is lower for comparable output, the variations in relative efficiency among Texas charter schools are substantial. Efficiency is neither uniformly nor consistently achieved. As explained above, evidence from related work by these authors reveals that the lower overall expenses are largely a function of lower salaries and inexperienced staff (Taylor et al., 2011). Thus, maintaining efficiency may require ongoing reliance on inexperienced staff.
Frequently cited studies touting the relative effectiveness of charter schools operated by major Charter Management Organizations, including Lake et al. (2010) and Dobbie and Fryer (2011) have typically measured poorly or not at all the resources available in these schools – schools which Baker, Libby and Wiley (2015, 2012) and Gronberg, Taylor and Jansen (2012) identify as often spending substantially more than nearby district schools. Baker, Libby and Wiley (2015) and others (Preston et al., 2012) explain that most charter schools, and large CMO charter schools in particular, operate under a similar human resource intensive model as traditional district schools. Specifically, well-endowed CMOs allocate their additional resources to competitive wages (higher than expected for relatively inexperienced teachers), small classes, longer days and years (Baker, Libby and Wiley, 2012).
Other charter school operators have attempted to reduce substantially direct instructional per pupil costs through online and hybrid learning. This approach provides perhaps the greatest opportunity to maximize profit margin as it presents the greatest opportunity to cut staffing costs. But as Epple, Romano and Zimmer (2015) explain, regarding student outcomes “online ‘cyber’ schools appear to be a failed innovation, delivering markedly poorer achievement outcomes than TPSs.” (p. 55)
Pulling it All Together
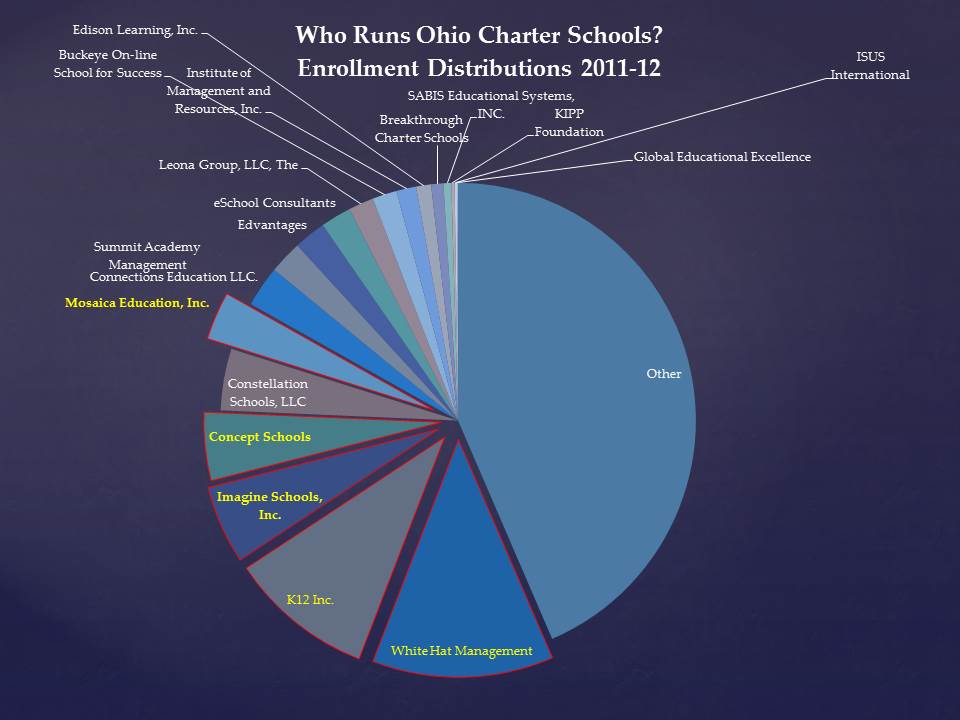
To summarize, based on limited analyses of resource allocation behaviors of charter schools, we have evidence that charter schools generally tend to divert more from the classroom to administration. Classroom expenditures are reduced in part, if not mainly by reduction of total teacher salary expenses by having relatively inexperienced teachers and high turnover rates. EMO operated charter schools tend to have even greater administrative expense and charter schools operating within districts may create redundant administrative expenses. That said, there is limited evidence that charter schools generally, or those operated by EMOs and CMOs are less efficient as a result of increased administrative expense, and some evidence of efficiency improvement for charters over district schools (in Texas) due to reduced staffing expenditure. Generally, we have little evidence of systematic differences between nonprofit and for-profit operated charter schools, but we do have some evidence that high profile nonprofit providers engage in substantial revenue enhancement. Finally, we have increasingly clear evidence that online and cyber charter schools lag in performance outcomes, as well as evidence that charter schools in states including Ohio and Arizona perform particularly poorly.
References
Andrews, M., Duncombe, W., & Yinger, J. (2002). Revisiting economies of size in American education: are we any closer to a consensus?. Economics of Education Review, 21(3), 245-262.
Arsen, D. D., & Ni, Y. (2012). Is administration leaner in charter schools? Resource allocation in charter and traditional public schools. education policy analysis archives, 20, 31.
Baker, B.D. & Bathon, J. (2012). Financing Online Education and Virtual Schooling: A Guide for Policymakers and Advocates. Boulder, CO: National Education Policy Center. Retrieved 7/14/15 from http://nepc.colorado.edu/publication/financing-online-education
Baker, B. D., & Elmer, D. R. (2009). The politics of off-the-shelf school finance reform. Educational Policy, 23(1), 66-105.
Baker, B. D., & Ferris, R. (2011). Adding up the Spending: Fiscal Disparities and Philanthropy among New York City Charter Schools. National Education Policy Center.
Baker, B.D., Libby, K., Wiley, K. (2015) Charter School Expansion & Within District Equity: Confluence or Conflict? Education Finance and Policy
Baker, B. D., Libby, K., & Wiley, K. (2012). Spending by the Major Charter Management Organizations: Comparing Charter School and Local Public District Financial Resources in New York, Ohio, and Texas. National Education Policy Center.
Bettinger, E. P. (2005). The effect of charter schools on charter students and public schools. Economics of Education Review, 24(2), 133-147.
Bifulco, R., & Reback, R. (2014). Fiscal Impacts of Charter Schools: Lessons from New York. Education Finance & Policy, 9(1), 86-107.
Bitterman, A., Gray, L., and Goldring, R. (2013). Characteristics of Public and Private Elementary and Secondary Schools in the United States: Results From the 2011–12 Schools and Staffing Survey (NCES 2013–312). U.S. Department of Education. Washington, DC: National Center for Education Statistics. Retrieved 7/14/15 from https://nces.ed.gov/pubs2013/2013312.pdf
Bulkley, K. E., & Burch, P. (2011). The changing nature of private engagement in public education: For-profit and nonprofit organizations and educational reform. Peabody Journal of Education, 86(3), 236-251.
Center for Research on Education Outcomes (CREDO) (2013, June). National Charter School Study. Palo Alto: CREDO, Stanford University. Retrieved July 10, 2013, from http://credo.stanford.edu/research-reports.html
Chingos, M. M., & West, M. R. (2015). The Uneven Performance of Arizona’s Charter Schools. Educational Evaluation and Policy Analysis, 37(1 suppl), 120S-134S.
Dobbie, W., & Fryer Jr, R. G. (2011). Getting beneath the veil of effective schools: Evidence from New York City (No. w17632). National Bureau of Economic Research.
Duncombe, W., & Yinger, J. (2008). Measurement of cost differentials. Handbook of research in education finance and policy, 238-256.
Education Trust-Midwest (2015) Accountability for All: The need for real charter school authorizer accountability in Michigan. http://www.crainsdetroit.com/assets/PDF/CD98381219.PDF
Epple, D., Romano, R., & Zimmer, R. (2015). Charter Schools: A Survey of Research on Their Characteristics and Effectiveness (No. w21256). National Bureau of Economic Research.
Gronberg, T. J., Jansen, D. W., & Taylor, L. L. (2012). The relative efficiency of charter schools: A cost frontier approach. Economics of Education Review, 31(2), 302-317.
Hill, C. D., & Welsch, D. M. (2009). For‐profit versus not‐for‐profit charter schools: an examination of Michigan student test scores. Education Economics, 17(2), 147-166.
Izraeli, O., & Murphy, K. (2012). An Analysis of Michigan Charter Schools: Enrollment, Revenues, and Expenditures. Journal of Education Finance, 37(3), 234-266.
Kena, G., Musu-Gillette, L., Robinson, J., Wang, X., Rathbun, A., Zhang, J., Wilkinson-Flicker, S., Barmer, A., and Dunlop Velez, E. (2015). The Condition of Education 2015 (NCES 2015-144); p.85. U.S. Department of Education, National Center for Education Statistics. Washington, DC. Retrieved 7/14/15 from http://nces.ed.gov/pubs2015/2015144.pdf
King, K. A. (2007). Charter Schools in Arizona: Does Being a For-Profit Institution Make a Difference?. Journal of Economic Issues, 729-746.
Lake, R., Dusseault, B., Bowen, M., Demeritt, A., & Hill, P. (2010). The National Study of Charter Management Organization (CMO) Effectiveness. Report on Interim Findings. Center on Reinventing Public Education.
Maul, A., & McClelland, A. (2013). REVIEW OF NATIONAL CHARTER SCHOOL STUDY 2013. Boulder, CO: National Education Policy Center. Retrieved September, 2, 2014.
Maul, A. (2013). Review of “Charter School Performance in Michigan.”. Boulder, CO: National Education Policy Center. Retrieved July, 10, 2013.
Miron, G., & Gulosino, C. (2013). Profiles of for-profit and nonprofit education management organizations: Fourteenth Edition—2011-2012. Boulder, CO: National Education Policy Center.
Molnar, A., Huerta, L., Rice, J. K., Shafer, S. R., Barbour, M. K., Miron, G., … & Horvitz, B. (2014). Virtual Schools in the US 2014: Politics, Performance, Policy, and Research Evidence.
Morley, J. (2006). For-profit and nonprofit charter schools: An agency costs approach. The Yale Law Journal, 1782-1821.
Preston, C., Goldring, E., Berends, M., & Cannata, M. (2012). School innovation in district context: Comparing traditional public schools and charter schools. Economics of Education Review, 31, 318–330.
Richards, C. E. (1996). Risky Business: Private Management of Public Schools. Economic Policy Institute, 1660 L Street, NW, Suite 1200, Washington, DC 20036.
Sass, T. R. (2006). Charter schools and student achievement in Florida. Education Finance and Policy, 1(1), 91-122.
Taylor, L.L., and Fowler, W.J., Jr. (2006). A Comparable Wage Approach to Geographic Cost Adjustment (NCES 2006-321). U.S. Department of Education. Washington, DC: National Center for Education Statistics.
Taylor, L.L. Alford, B.L., Rollins, K.G., Brown, D.B., Stillisano. J.R., Waxman, H.C. (2011) Evaluation of Texas Charter Schools 2009-2010 (Revised Draft). Texas Education Research Center. Texas A&M University, College Station.
Zimmer, R., Gill, B., Booker, K., Lavertu, S., & Witte, J. (2012). Examining charter student achievement effects across seven states. Economics of Education Review, 31(2), 213-224.