Who should qualify for Race to the Top?

I’ve been asked at least a few times this past week about what types of requirements should be included for states to qualify for Race to the Top federal stimulus funding. Interestingly, there seems thus far to be little focus on whether states are actually financing their schools equitably and adequately and putting up reasonable effort to finance their schools as a requirement for accessing stimulus funds. More disconcerting is the fact that there also seems little emphasis on even whether stimulus stabilization funds are being used to advance equity and adequacy of funding. In some cases, which I will elaborate at a later date, stabilization funds have actually been allocated in ways that erode equity and reduce state effort. That being water under the bridge, what might be some reasonable requirements for Race to the Top and second year stimulus funds, and which states might qualify and not qualify?

Category 1: Fiscal Effort

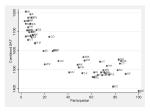
A state’s effort in school finance is often measured as the aggregate state and local pk-12 public education resources allocated as a percent of Gross State Product (now labeled Gross Domestic Product – State). Some have suggested that states which maintain current effort levels should qualify for stimulus funds. This seems a low bar for states that put up very little effort like Delaware and Louisiana. It seems to me that low effort states – states below the average state – should have to show that they’ve increased effort significantly. But, states that are above the average should perhaps be held to the maintenance standard. I discuss Louisiana’s effort here.

Category 2: Fiscal Adequacy

Effort and adequacy are somewhat linked, as one can see in my rant about Louisiana and Mississippi. Louisiana is low effort and low adequacy in funding whereas Mississippi is average effort and low adequacy. That is, Louisiana is perhaps more to blame for its own inadequacy than Mississippi, which simply lacks the economic base.

I would argue that any state which has (a) below average effort and (b) per pupil spending adjusted for regional variation in wages (using the NCES Comparable Wage Index)  should be low on the list for additional stimulus funds. States with below average regional adjusted spending and below average effort should be required to increase both in order to qualify.  Sadly, however, I suspect that states like Louisiana would gladly further deprive the less than 85% of children who actually attend their public schools of these additional resources (LA has the highest share in private schools). Indeed, these requirements are a double-edged sword.

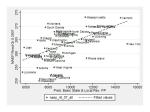
Category 3: Fiscal Equity

This one is a little more complicated, but the general idea is that states should have to be able to show that they’ve made effort toward targeting additional resources – state and local district revenues – to higher poverty school districts. In a forthcoming indexing system, we control for a variety of school district characteristics to evaluate whether, on average, a state school finance system results in systematically more state and local revenue per pupil in higher poverty school districts than lower poverty ones. Unfortunately the Education Trust approach of looking at the highest and lowest 25% of districts by poverty misses the boat – because it fails to capture whether the pattern is systematic across all districts. A good example is Connecticut, which shows a positive differential in state and local revenue between high and low poverty districts, but when measured statistically across all districts, the relationship is not statistically significant – or systematic. That’s because Connecticut district revenues are all over the map. The average spending for high poverty districts is skewed by only two (Hartford and New Haven) which are relatively higher state and local revenue districts. Meanwhile, districts like Bridgeport, Waterbury, New Britain and others are pretty much left out.

So, that in mind, what needs to be measured here?  Well, to qualify for Race to the Top funds, I believe that the first states in line should be those where there exists a systematic positive relationship between state and local revenues per pupil and either/or (a) US Census Poverty estimates (b) NCES Common Core Free/Reduced Lunch rates. This includes only a handful of states such as New Jersey and Minnesota (although also driven by Minneapolis and St. Paul, but better than CT). For states with either no relationship between state and local revenue and poverty, or a negative one, those states should have to show that they have improved significantly the relationship between state and local revenue per pupil and poverty.  For example, New York State, one of the nation’s most “regressively” funded states could reduce it’s negative relationship significantly by following through with planned increases to funding to New York City schools and to many other poor, small city districts around the state which remain, in the hole, so to speak.  Similarly, Pennsylvania which until recent reforms was the most regressively funded state in the nation, could really put a dent in its negative funding relationship by following through with the Governor’s plan to continue phase in of the new funding formula. This, in my mind would make PA an ideal candidate for Race to the Top funding.

Random thoughts on CT

I picked this article up on twitter: http://www.courant.com/news/education/hc-education-commissioner-0819.artaug19,0,3631152.story

From these figures below, it looks to me like Connecticut has some other issues to deal with. This is  a perfect example of just how illogical state aid distribution and state school finance formulas can be.

Variation in Nominal Expenditures

Variation in Need & Cost Adjusted Expenditures

Private School Spending

New out today (copy of press release):

Ground-breaking study has major implications for public school spending and voucher programs

Contact: Teri Battaglieri – (517) 203-2940; greatlakescenter@greatlakescenter.org
Bruce Baker – (732) 932-7496 ext. 8232; bruce.baker@gse.rutgers.edu

EAST LANSING, Mi., (August 18, 2009) – Private school spending varies far more widely than spending on public education, a new report finds. Further, the differences in spending among different parts of the private school sector reflect clear patterns with major implications for voucher policies and even for spending levels in the public sector.

Those are some of the findings in a first-ever, comprehensive examination of some 1,500 private schools nationally conducted by Rutgers University associate professor and school finance expert Bruce D. Baker.

The report, Private Schooling in the U.S.: Expenditures, Supply, and Policy Implications, is based on a review of financial and enrollment information contained in IRS tax returns combined with data from the National Center for Education Statistics. It was released today by the Great Lakes Center for Education Research and Practice.

Baker presents comparisons of expenditures among different types and affiliations of private schools, and compares those expenditures with public school expenditures for districts in the same state and labor market. Results indicate that (1) the less-regulated private school sector is more varied in many key features (teacher attributes, pay and school expenditures) than the more highly regulated public schooling sector, (2) these private school variations align and are largely explained by affiliation—primarily religious affiliation—alone, and (3) a ranking of school sectors by average spending correlates well with a ranking of those sectors by average standardized test scores.

“On average,” Baker explains, “the private schools studied spend more than public schools in the same metropolitan areas (and nationally), although some spend much less. Some private schools have lower pupil-to-teacher ratios than public schools, while others have comparable ratios. Some have comparable teacher salaries, and some pay their teachers much less. And, some have teachers with stronger academic qualifications than public school teachers, while others have teachers with weaker academic qualifications.”

What’s “most striking” about such patterns, Baker observes, is that they are largely explained by religious affiliation alone. Christian Association Schools have the lowest spending, the lowest salaries, teachers with the weakest academic records, and the highest pupil-to-teacher ratios. Moreover, earlier research concludes that these schools have the lowest student test scores. Catholic schools tend to approximate public schools in all these areas. Hebrew schools and independent day schools (generally not religiously affiliated) have higher spending – often substantially higher – and this is reflected in these resource categories.

Baker’s findings may provide some insights into why research on voucher programs has yielded mixed results regarding student achievement levels for participating low income students. The potentially high-performing parts of the private school sector are the ones that spend much more than available voucher subsidies. In fact, they spend much more than public schools. Private independent day schools—which have the academically strongest teachers and the smallest classes among private schools—will, Baker points out, “remain well out of reach of voucher recipients.” In many markets, such schools on average spend twice what public schools spend, which in turn is often twice the voucher levels allocated. Thus, even under a voucher scheme that paid what public schools receive per pupil, these private schools would have to subsidize half the total cost of teaching voucher students to match what they spend on their non-voucher students.

Baker recommends that policy makers who would look to private schools for lessons on how to improve public education begin with a clear awareness of the stark differences among subsets of private schools, avoiding policy recommendations based on averages or isolated instances. He also points to the importance of understanding the differences between private school spending and tuition, given that spending is often subsidized by outside resources (which themselves are often taxpayer subsidized). Regarding voucher policies, policy makers need to understand the tradeoff between attempts to craft policies with a limited impact on the public treasury and to craft policies that provide real choice to voucher recipients. Current policies appear to sacrifice choice for fiscal prudence, but this report demonstrates that the result is access to only a couple parts of the private sector, both of which have strong religious affiliations and neither of which appears to offer academic benefits over public schools.

Find Bruce Baker’s report, Private Schooling in the U.S.: Expenditures, Supply, and Policy Implications, on the web at: http://www.greatlakescenter.org.

Small Districts, Racial Isolation and New Jersey

Attached are some slides from a presentation I’ve done around the state on the question of how school district size affects education costs. I’ve added to this slide set a few additional slides on the effects of racial composition on education costs, which come from the same statistical model of NJ school district costs, at constant outcomes.

Race & Cost in NJ

The Administrative Blob in Schools: How much does it matter?

A common assertion among public education critics is that public schools simply spend too much on administration and too little “in the classroom.” For example, this was the basis of a reform promoted a few years back which was called the 65 cent solution (which turned out to be a divisive scam as exposed by reporters from the Austin American Statesman in Texas).  One reader of my blog recently commented that he/she thought that Bob Bowdon was in fact making a reasonable argument that the problem with public schools is the administrative bloat, or blob as it has been referred to by others. I do not know whether Bowdon explicitly makes this particular argument or not. But it again raises the question of whether it even makes sense to make this argument in light of what the best empirical research actually says on this topic.

Here’s an excerpt of  a literature review from one of my recent articles in Educational Policy (detailed citations available on request) –

=====

The core assumption of the 65% solution is that increasing the share of spending to areas labeled as “instruction” will improve student outcomes without increasing overall levels of education spending. Implicit in this argument, and highlighted by some anecdotal examples provided on the FCE web site, is the notion that schools are presently wasting too much money in areas such as administration. FCE argues the districts can reallocate that money to instruction. In the 1990s, while schools endured the aftermath of A Nation at Risk and the subsequent criticisms of rising education spending and stagnant outcomes, many policy analysts conducted studies on education spending. These studies made the forgone conclusion that central administrative expenses were necessarily inefficient and therefore harmful for students, and that higher percentages of dollars allocated “to the classroom” were efficient, and therefore beneficial to students. Programmers developed software for school districts to track dollars to the classroom  and studies reported instructional expenditures in New York City schools at only 21.9% in an attempt to validate the inefficiency of large urban school districts (Speakman et al., 1996). However, few methodologically strong studies were able to directly link student outcomes to the ratio of resources districts allocated to  administrative and other non-instructional expenses and classroom instructional expenses.
A significant point of confusion in the literature on instructional spending relates to the difference between instructional spending levels and instructional spending as a share of total spending. For example, proponents of the 65% Solution point to a policy brief prepared for Texas legislators (Patterson, 2005) citing the research of Wenglinsky (1997) as finding a positive relationship between instructional spending and student outcomes. Wenglinsky, however, does not evaluate tradeoffs between instructional and other spending an outcomes, but rather finds that either instructional or administrative spending increases, both of which appear related to increased overall staffing and class size reduction, lead to improved educational outcomes.
Like Wenglinsky (1997), Ferguson and Ladd (1996) find in Alabama that instructional spending has a positive effect on test scores. Using data from Oklahoma school districts, Jacques and Borsen (2002) evaluate the effects of spending levels on student outcomes across a variety of categories, finding “Test scores were positively related to expenditures on instruction and instructional support, and are negatively related to expenditures on student support, such as counseling and school administration.” (p. 997) The authors raise concerns however with deriving causal implications from their findings, noting: “It could be that schools with problems hire more administrators and counselors.” (p.997) Taken together, these findings suggest that when policy makers add new money to education systems, adding that money to instruction areas while holding other areas constant may improve outcomes. In each case, however, researchers evaluated the level of resources allocated to schools, but not tradeoffs or potential reallocation of existing levels of resources. A core tenet of both the 65 and 100% solutions is not that states raise the level of funding for schools, but rather that lawmakers’ require districts to reallocate existing funds.
Bedard and Brown (2000), in an unpublished working paper, attempt the leap from evaluating levels of spending across categories to evaluating relative proportions, and find that reallocation from administration specifically toward classroom instruction might lead to increased outcomes. “Either the reallocation of $100 from administrative to classroom spending, with no change in overall expenditures, or an $100 increase aimed directly at the classroom moves the average California high school approximately 5 percentage points higher in the state test score rankings.” (p. 1) But, Taylor, Grosskopf and Hayes (2007) also in an unpublished working paper, using data on Texas schools to test directly the 65% solution, find that “the analysis suggests that schools that spend a larger share of their budgets on instruction are significantly less efficient than other public schools.” (p. 1)
Two other published, peer reviewed studies specifically examine the relationship between administrative expenses and student outcomes also yielded conflicting findings.  In one, Brewer (1996) found little relationship between non-instructional expenses and student outcomes.  Marlow (2001), contrasting with Brewer’s findings to an extent, found that: “While numbers of teachers do not influence performance measures, numbers of administrators are shown to positively affect performance — results that suggest that too many teachers, but too few administrators, are employed.”
Finally, Huang and Yu (2002) combine NAEP data with NCES Common Core expenditure data to evaluate whether current expenditures per pupil and/or the difference between an individual district’s instructional spending rate and the state average instructional spending rate (called DDR in their study) relate to student outcomes in 1990, 1992 and 1996. The authors found overall positive effects of current spending on outcomes but “Net of relevant district factors, DDR was found unrelated to districts’ average 8th grade math performance.” This test is similar to testing whether districts over or under a 65% instructional spending threshold perform better or worse. The difference is that each district’s instructional share is benchmarked against its own state mean.

=====

So, as it turns out, the best empirical research on this topic (into which I would put Lori Taylor’s work) tends not to show negative effects of administrative expense, or positive effects of instructional expense on student outcomes when addressed as internal shares of total budgets.

But what about New Jersey – that high spending, heavy administrative blob state? And especially those Abbott districts? Well, as I have discussed in previous posts, it turns out that New Jersey administrative salaries are actually relatively non-competitive if compared with (a) private school heads within New Jersey or (b) superintendents in other states like Illinois or Texas. I have also shown that Abbott district administrative shares and administrative expenses per pupil are in line with other New Jersey districts. My forthcoming research also shows that private independent schools spend much larger shares on administration than public schools in the same state. (post on this is forthcoming)

I have not yet checked on total administrative shares in NJ versus other states… but you see… the literature would suggest that administrative shares of spending are not, in fact, a huge drag on student outcomes. Rather, one might counter based on the available information that higher administrative expense and specifically administrative salaries might be warranted in New Jersey in order to begin attracting a stronger leader pool – especially in the schools and districts where they are most needed.

Pennsylvania, Illinois and the Stimulus – What is Duncan thinking?

So… I read these two stories this past week as I get more deeply involved in understanding the impact of the stimulus funding for public schools, specifically, the general stabilization money  around which there seems to be increased controversy of late.

In the first story which appeared in many locations, here is one:

http://www.bloomberg.com/apps/news?pid=20601103&sid=aRx4YhYdDW3E

Duncan takes aim at Pennsylvania for not dipping into its rainy day fund to increase education spending – with stimulus included. Duncan sends a letter to the PA governor explaining that the state’s stabilization money might be jeopardized.

In this second story, Duncan appears to apologize to Illinois for previously being critical of their lack of movement on education funding and reform. For some reason, he now believes they’ve made progress.

Here’s my back story on these two states. I repeatedly run state-by-state analyses of the relative levels of spending and more importantly the progressiveness and regressiveness of state and local resources across school districts in states. Progressively funded systems are those that allocated systematically greater support to districts with greater measurable costs and student needs. Regressive states do the opposite.

Through 2006, Pennsylvania and Illinois have been the most regressively funded states in the country, with Philadelphia the least well funded (relative to low poverty surroundings) and Chicago second least well funded major city in the country. Okay… so PA was last and IL second to last. Arne’s critique makes sense? Well, no! Because PA actually adopted a new funding formula which will – if actually implemented over time – change the distribution of resources across PA districts quite significantly, and approporiately. The latest run I have of district by district state aid allotments for PA districts from the PDE web site indicates that the 2009-10 allotments move ever so slightly in the right direction over the 2008-09 allotments. These are March 2009 estimates (http://www.pdeinfo.state.pa.us/education_budget/lib/education_budget/BEF0910_Mar09_Web.xls)

Please… someone out there correct me if I’m wrong, but as far as I can tell, Illinois has done little or nothing to resolve the plight of Chicago Public Schools and perhaps even more importantly, the plight of many even poorer inner urban fringe districts around Chicago. Now that PA has taken some steps to move forward on school funding reform, IL is well positioned to be dead last on measures of “equal educational opportunity” as provided through funding. Is these really deserving of Duncan’s apologetic approach to his old stomping ground?

The article on Duncan’s apology to Illinois specifically goes further to say that Chicago should be able to pay differential wages to teachers in positions where the district is likely to be losing teachers to surrounding districts. Indeed this makes sense, but this problem is directly related to the fact that Chicago simply has less competitive overall resource levels than it’s more affluent neighbors which are also able to provide more desirable working conditions. Rhetoric about differential teacher pay – as a “progressive” strategy – distracts from the main point that Chicago Public Schools and surrounding poor inner urban fringe districts simply don’t have sufficient resources to compete with surrounding affluent suburbs.

Implying that Pennsylvania is a scofflaw for not using rainy day funds (while implementing significant reforms) and exonerating Illinois despite complete inaction on school funding reform – seems inconsistent at best.

I may be wrong… I’m shooting from the hip this morning without my hard drive of data archives.

WHAT MATTERS HERE IS THE ACTUAL TOTAL AMOUNT OF REVENUE PER PUPIL [FED, STATE, LOCAL] AVAILABLE IN EACH LOCAL SCHOOL DISTRICT AND SCHOOL… NOT WHERE THE MONEY COMES FROM AND NOT THE TOTAL – AGGREGATE – AMOUNT SPENT BY THE STATE.

I ASSURE YOU THAT THOSE IN THE TRENCHES AND THE CHILDREN THEY SERVE ARE MORE CONCERNED WITH THEIR LOCAL BUDGET AND THE EDUCATION IT CAN BUY, THAN WITH SOME 9 TO 10 FIGURE STATE BUDGET WHICH IS LARGELY A POLITICAL ABSTRACTION.

A STATE COULD MEET THIS REQUIREMENT OF INCREASING TOTAL FUNDING SIMPLY BY ALLOCATING LARGER SHARES TO AFFLUENT SUBURBS. A STATE COULD CREATE A LESS EQUAL, LESS FAIR SYSTEM, AND IT SEEMS THAT THAT WOULD BE OKAY? DRIVING THE STIMULUS MONEY THROUGH THE CURRENT GENERAL AID FORMULA IN MANY STATES DOES JUST THAT.

Update on PA here:

http://www.heraldstandard.com/site/news.cfm?newsid=20334428&BRD=2280&PAG=461&dept_id=480247&rfi=6

The Intellectually Vacuous Bob Bowdon’s “Cartel”

See updated post on this topic: https://schoolfinance101.wordpress.com/2010/04/16/cartel-recap/

===== Old post

Had a busy week, so I haven’t posted, but saw a new report yesterday which relates nicely back to the shallow logic of Bob Bowdon’s intellectually vacuous Cartel movie.

The Cartel movie is based on the premise that (a) public schools nationally are failing, (b) public schools in the US spend a ton of money to achieve little, (c) New Jersey is the perfect example of a state which spends a ton of money and fails. All of this, of course, occurs because of a self-interested, self-indulgent cartel of teachers unions and greedy bureaucrats (here’s how their salaries stack up to those “real world” “private sector” workers in NJ). I’ll avoid this latter piece for now, and take a closer look at the logic of points “a” through “c.”

Bowdon cherry picks some national average results from the PISA international assessment of 15 year old students to show that the US compared poorly on math in 2003 and worse in 2006. Of course, any national averages in the U.S. combine the performance of children in states that have largely thrown their public schooling system under the bus  – like Louisiana and Mississippi among others – with those that have done quite well like Massachusetts and New Jersey (indeed it is somewhat unfair to compare directly LA and MS to MA and NJ).

As I have shown in recent posts, there does exist at least some relationship between state aggregate spending (controlling for a variety of factors) and national assessment performance – albeit a relationship heavily entangled with socioeconomic conditions and adult population education levels in states.

Further, as I have also explained previously, an extensive body of research on the effects of school finance reforms including infusion of new resources into poor schools, shows significant positive effects.

A new study out this month from the American Institutes for Research seeks to make more appropriate statistical comparisons of student math performance on another international assessment – TIMSS (Trends in International Math and Science Study). The authors construct a statistical cross-walk between NAEP state assessment scores and TIMSS scores which can be used for international comparisons.  From this analysis, the authors are able to evaluate where individual states stack up against countries participating in TIMSS. This is important because of the variance in state level performance and differences in state policies, fiscal effort and students served.

For starters, on international comparisons, the US on average scored just below the mean for OECD (organization for economic cooperation and development) countries at the 4th and 8th grade level (we do lag from 4th to 8th, an issue of concern). At both 4th and 8th grade on math, the US average is well above the international mean for all TIMSS participants. Now, we may wish to do better – and should. AIR assigns grades to the score ranges for each country and points out that we don’t perform at the levels we should. But this is far from the absurd, apocalyptic (and simply irresponsibly misguided) view presented by Bowdon.

But wait, Bowdon’s premise is that states like New Jersey are the perfect example of inefficiency – spending so much yet producing these terrible national averages. Certainly, New Jersey can’t be blamed for the national average – which carries with it the baggage of states like Louisiana and Mississippi.

How does New Jersey compare to the OECD average? New Jersey ranks 3rd among states on 4th grade math with 25 states beating the OECD average performance. Not bad for Jersey, along with Massachusetts and Minnesota! Louisiana, Alabama, New Mexico, California and Mississippi carry up the bottom end of the rankings, falling below the OECD mean, but above the overall international mean. That is, even Mississippi and Louisiana beat the international mean.

New Jersey drops a little on 8th grade math (consistent with other NAEP based analyses of NJ), but still does well, coming in 6th among the 27 states which perform above the OECD mean. Again, even Louisiana and Mississippi exceed the international mean, but well below the OECD mean.

I am by no means arguing for complacency  – saying – hey – that’s good enough. Rather, my point here is to re-emphasize that the US has a wide variety of education systems in place across states – some which spend a great deal and in fact perform very well, even in international comparisons. New Jersey is among them. We also in this country have some states that have seriously neglected their education systems, spent little, and shifted large shares of (primarily upper class) children in private schooling (schools that spend more, not less than the public schools in those states) where their performance goes unmeasured in these international and even state by state comparisons (in fact, these may be the children who do well in those states, but we don’t know). WHAT THESE STATES HAVE DONE IS A NATIONAL CONCERN!

It is foolish stretch of logic to blame New Jersey’s high spending (and the Cartel that demanded it) for the poor national average performance on select international comparisons. Yes, New Jersey spends on education, and in fact, New Jersey does quite well with that spending compared to other states and on international comparisons.

Certainly, spending alone is not the solution. But little is added to the debate by producing bombastic, misguided, poorly conceived and irresponsible slick-production rhetoric posing as documentary.

NJ Teacher and Administrator Wages

I got curious this morning, and ended up spending more time than I wanted to on this quick and dirty analysis. You see… the whole premise of this Cartel movie is that the teacher unions in NJ are a mob cartel that has bullied the state into lining their (union members) pockets with high salaries, guaranteed annual increases, and all for no actual return in the quality of schooling. My slides in a previous post actually speak to the relative quality of NJ schooling in relation to NJ state and local revenues for schooling.

Anyway, this morning I ran a quick check on how elementary and secondary teacher and administrator wages stack up compared to other workers in NJ from 2000 to 2007. You’d think from all the rhetoric that they’ve run away from the pack. As in a much earlier post, I’ve taken data from the U.S. Census Integrated Public Use Micro Data System (Census 2000) and from the subsequent American Community Surveys. I’ve included only individuals with a BA or MA degree and between the ages of 23 and 65. I’ve computed relative “income from wages” from a regression model which controls for the Hours Worked per Week, Weeks Worked per Year, Age of Individual, whether they hold an MA or BA, race and gender (essentially comparing male wages to male wages, female to female, black to black, white to white… which, given gender wage gaps in many fields and the high percentage teachers who are female, potentially leads to overstating teacher relative wages).  Here’s what I got:

Slide33

Yep… teachers have fallen sligthly behind. Administrator estimates have jumped around average. The green line  is the average predicted income from wages for a worker of similar attributes (hours per week, weeks per year, age, sex, race, degree level) as the teacher or administrator. Personally, I’d expect a 40 year old school administrator to make more than “average” for any 40 year old worker with a masters degree working similar weeks and hours per year. But even that has not systematically been the case in NJ over the past several years. Nor have administrator wages grown systematically relative to other comparable workers. (note that by excluding professional degrees and doctorates, I’ve excluded doctors and lawyers, but have not excluded other managers, individuals with MBAs, or architects and engineers).

Idiot of the Week (year) Award… The Cartel… Check this out!

See updated post on this topic: https://schoolfinance101.wordpress.com/2010/04/16/cartel-recap/

====

Okay… so I’m curious about The Cartel movie that documents the failures of New Jersey’s public education system… and the high costs of those failures. One might construct a reasonable statistical case for some of the problems facing New Jersey schools… but not documentary filmmaker Bob Bowdon in “The Cartel.” I’ve not seen it yet…. but their page on Facts and Figures here, includes some of the dumbest assertions I think I’ve seen in a long time:

http://thecartelmovie.com/

Go to the bottom of the page where this complete moron attempts to argue that states which spend more on education have lower SAT scores… that spending more leads to lower SAT scores.

[BOWDON APPEARS TO HAVE REMOVED THE TWO CHARTS WHICH ATTEMPT TO MAKE THIS ARGUMENT. SEE COMMENT BELOW]

QUOTES/LABELS FROM THE CHARTS INCLUDED:

“THE MORE A STATE SPENDS ON SCHOOLS THE LOWER ITS KIDS’ SAT SCORES”

“EVERY EXTRA $100 IN EDUCATION SPENDING LOWERS SAT SCORES BY 1 1/3 POINTS”

He kept this statement “With spending as high as $483,000 per classroom (confirmed by NJ Education Department records), New Jersey students fare only slightly better than the national average in reading and math, and rank 37th in average SAT scores.” On his “The Deal” page…

In fact, there may be a connection… that is… states that spend more which happen to be in the northeast, happen to have higher SAT participation rates… because northeastern colleges and universities use the SAT. 82% of New Jersey students take the SAT.  This figure is 9% in Alabama and 4% in Mississippi, and students taking the SAT in those states tend to be the select few interested in attending competitive northeastern colleges.  So, we’re comparing the top 4% of Mississippi students to the 82% of NJ students. Anyway… that absurdity aside, here’s a better picture of how the relationship between state spending on schools relates to state average outcomes. The following four graphs show the relationship between predicted basic state and local revenue per pupil (controlling for sparsity, econ. of scale, state poverty rates, ELL children and regional wage variation) and National Assessment of Educational Progress 2007 scores. Actually, somewhat to my own surprise there is a reasonably positive relationship here. THAT SAID… I DO NOT ASSUME  THIS TO BE A SIMPLE DIRECT CAUSAL RELATIONSHIP. There are many potentially interesting underlying stories that might be told here about regional differences in income, adult population education levels, tax policy structures, etc.

Anyway… for me… this foolishness has reduced significantly any interest I may have had in actually seeing the movie.  Ignorant… juvenile… silly… I’m not even sure how to classify this attempt at a “brilliant revelation” from a scatterplot (FYI – I used to teach my 7th graders how to do this stuff… and draw appropriate inferences…not this kind of crap.)

I was initially pleased to see that the “facts and figures” page on the site actually had links to reasonable facts and figures and reports… rather than making them up off the cuff…(a topic I’ve written about with regard to teacher salaries, administrative salaries, Abbott spending and many other related topics – https://schoolfinance101.wordpress.com/2008/12/09/notes-from-a-school-finance-curmudgeon/).

Here’s the relationship between SAT participation rates and SAT combined scores.

Presentation1

By the way… this graph I previously posted compares teacher salaries other professions holding similar degree levels, at similar age, over time in NJ. And these are hourly wage comparisons. Interestingly, teachers have fallen further and further behind over time.

https://schoolfinance101.wordpress.com/2009/01/14/those-darn-overpaid-nj-teachers-sucking-the-life-out-of-the-lagging-economy/

========

And here’s where NJ actually stands on corrected spending measures and standardized outcomes:

Do School Finance Reforms Make Any Difference?

Well… here’s what a number of reasonably strong empirical studies have shown…

•   David Card & A. Abigail Payne, School Finance Reform, The Distribution of School Spending, and the Distribution of Student Test Scores, 83 J. Pub. Econ. 49 (2002)
–    Using micro samples of SAT scores from this same period, we then test whether changes in spending inequality affect the gap in achievement between different family background groups. We find evidence that equalization of spending leads to a narrowing of test score outcomes across family background groups. (p. 49)
•    John Deke, A Study of the Impact of Public School Spending on Postsecondary Educational Attainment Using Statewide School District Financing in Kansas, 22 Econ. Educ. Rev. 275 (2003)
–    In this paper, I use a policy change in Kansas involving statewide school district refinancing to measure the impact of per-pupil spending on the probability that a student will choose to acquire more education. Using panel models that, if biased, are likely biased downward, I have a conservative estimate of the impact of a 20% increase in spending on the probability of going on to postsecondary education. The regression results show that such a spending increase raises that probability by approximately 5%.
•   Thomas Downes (2004) School Finance Reform and School Quality: Lessons from Vermont. In Yinger, J. (ed) Helping Children Left Behind: State Aid and the Pursuit of Educational Equity. Cambridge, MA: MIT Press.
–    All of the evidence cited in this paper supports the conclusion that Act 60 has dramatically reduced dispersion in education spending and has done this by weakening the link between spending and property wealth. Further, the regressions presented in this paper offer some evidence that student performance has become more equal in the post–Act 60 period. And no results support the conclusion that Act 60 has contributed to increased dispersion in performance. (p. 312)
•    Tom Downes, Jeffrey Zabel, Dana Ansel (2009) Incomplete Grade: Massachusetts Education Reform at 15. Boston, MA. MassINC.
–    The achievement gap notwithstanding, thisresearch provides new evidence that the state’s investment has had a clear and significant impact. The achievement gap notwithstanding, this research provides new evidence that the state’s investment has had a clear and significant impact. how education reform has been successful in raising the achievement of students in the previously low-spending districts.4  Quite simply, this comprehensive analysis documents that without Ed Reform the achievement gap would be larger than it is today. (p. 5)
•    Jonathan Guryan (2003) Does Money Matter? Estimates from Education Finance Reform in Massachusetts. Working Paper No. 8269. Cambridge, MA: National Bureau of Economic Research.
–    Using state aid formulas as instruments, I find that increases in per-pupil spending led to significant increases in math, reading, science, and social studies test scores for 4th- and 8th-grade students. The magnitudes imply a $1,000 increase in per-pupil spending leads to about a third to a half of a standard-deviation increase in average test scores. It is noted that the state aid driving the estimates is targeted to under-funded school districts, which may have atypical returns to additional expenditures.
•    Margaret Goertz & Michael Weiss (2008) Assessing Success in School Finance Litigation: The Case of New Jersey
–    State Assessments: The gap between Abbott districts and all other districts was reduced to 12 points by 2005 or 0.40 standard deviation units. The gap between the Abbott districts and the high wealth districts closed from 25 points to 15 points in 2005 (Figure 7). Performance in the low, middle, and high wealth districts essentially remained parallel during this time. (p. 17)
–    NAEP: The NAEP results confirm the changes we saw using state assessment data. NAEP scores in 4th grade reading and mathematics in Central Cities rose 19 and 20 points, respectively between the mid-1990s and 2005, a rate that was faster than either the Urban Fringe or the state as a whole. P. 20)