Civics 101: School Finance Formulas & the Limits of Executive Authority

This post addresses a peculiar ongoing power grab in New Jersey involving the state school finance formula. The balance of power between state legislatures and the executive branch varies widely across states, but this New Jersey example may prove illustrative for others as well.  This post may make more sense if you take the time to browse these other two posts from the past few years.

  1. Student Enrollment Counts and State School Finance Formulas
  2. Twisted Truths and Dubious Policies: Comments on the Cerf School Funding Report

[yeah… I know… prerequisite readings don’t always go over well on a blog – but please check them out!]

In New Jersey, as in many other states the State School Finance Formula is a state statute. That is, an act of the legislature. State school finance formula statutes may vary in the degree of detail that they actually lay out in statutory language, including varying the precision of which specific numbers must be used in the calculations and in some cases specifically how the calculations are carried out. It is my impression that until recently, many state school finance statutes have been articulated in law with greater and greater precision – meaning also less latitude for the formula to be altered in its implementation (often through a state board of education).

The New Jersey school finance formula is articulated with relatively high precision in the language of the statute itself, like many other similar state school finance formulas. Again, it’s an act of the legislature – specifically, this act of the legislature of 20008:

AN ACT providing for the maintenance and support of a thorough and efficient system of free public schools and revising parts of the statutory law.

BE IT ENACTED by the Senate and General Assembly of the State of New Jersey:

(New section) This act shall be known and may be cited as the “School Funding Reform Act of 2008.”

Among other things, the statute spells out clearly the equations for calculating each district’s state aid, which involve first calculating the enrolled students to be funded through the formula.  In short, most modern school finance formulas apply the following basic approach:

  • STEP 1: Target Funding = [Base Funding x Enrollment + (Student Needs Weight x Base Funding x Student Needs Enrollment)] x Geographic Cost Adjustment
  • STEP 2: State Aid = Target Funding – Local Revenue Requirement

Using this general approach above, how students are counted necessarily has a substantive effect on how much aid is calculated, and ultimately delivered. And in most such formulas, how the basic  enrollments are counted has a multiplicative, ripple effect throughout the entire formula. So, it matters greatly how kids are counted for funding purposes. This is likely why state statutes often articulate quite clearly exactly how kids are to be counted for funding purposes.

The School Funding Reform Act of 2008 articulates precisely the definitions of fundable student enrollment counts. The following calculations and definitions are copied and pasted directly from the legislation.

Weighted Enrollment Definition

(New section) The weighted enrollment for each school district and county vocational school district shall be calculated as follows:

 WENR = (PW x PENR) + (EW x EENR) + (MW x MENR) + (HWx HENR)

Where:

PW is the applicable weight for kindergarten enrollment;

EW is the weight for elementary enrollment;

MW is the weight for middle school enrollment;

HW is the weight for high school enrollment;

PENR is the resident enrollment for kindergarten;

EENR is the resident enrollment for grades 1 – 5;

MENR is the resident enrollment for grades 6 – 8; and

HENR is the resident enrollment for grades 9 – 12.

http://www.njleg.state.nj.us/2006/Bills/A0500/500_I2.PDF

Legal Definition of Resident Enrollment

http://njlaw.rutgers.edu/collections/njstats/showsect.php?section=18A%3A7f-45&actn=getsect

“Resident enrollment” means the number of pupils other than preschool pupils, post-graduate pupils, and post-secondary vocational pupils who, on the last school day prior to October 16 of the current school year, are residents of the district and are enrolled in: (1) the public schools of the district, excluding evening schools, (2) another school district, other than a county vocational school district in the same county on a full-time basis, or a State college demonstration school or private school to which the district of residence pays tuition, or (3) a State facility in which they are placed by the district; or are residents of the district and are: (1) receiving home instruction, or (2) in a shared-time vocational program and are regularly attending a school in the district and a county vocational school district. In addition, resident enrollment shall include the number of pupils who, on the last school day prior to October 16 of the prebudget year, are residents of the district and in a State facility in which they were placed by the State. Pupils in a shared-time vocational program shall be counted on an equated full-time basis in accordance with procedures to be established by the commissioner. Resident enrollment shall include regardless of nonresidence, the enrolled children of teaching staff members of the school district or county vocational school district who are permitted, by contract or local district policy, to enroll their children in the educational program of the school district or county vocational school district without payment of tuition. Disabled children between three and five years of age and receiving programs and services pursuant to N.J.S.18A:46-6 shall be included in the resident enrollment of the district;

Not much there left to the imagination and certainly not a great deal of flexibility on implementation. It’s in the statute. It’s in the act adopted by the legislature. It is, quite literally, the law.

Executive Budget Language (2012-13 budget)

Civics 101 tells us that the executive branch of federal or state government doesn’t write the laws. Rather, it upholds them and its executive departments in some cases may be charged with implementing the laws, including adoption of implementing regulations – that is, adding the missing precision needed to actually implement the law. Of course, regulations on how a law is to be implemented can’t actually change the law itself.

Now, in some states like New Jersey, the Governor’s office has significant budgetary authority, including a line item veto option. Of course, that doesn’t however mean that the Governor’s office has the authority to actually rewrite the equations for school funding that were adopted by the legislature. It may mean that the Governor can underfund, or defund the formula as a whole, but that raises an entirely different set of constitutional questions, which I previously addressed here.

Specifically, what we have here are two separate bills/laws. First, there is the the statute enacting the formula, which sets forth substantive standards that must be applied from year to year, unless amended through usual Legislative process of proposing amendment in bill, committee review, and vote on the bill.  Then, there is the budget bill, which appropriates state school aid for each fiscal year and only is in effect for that year.  At their intersection, the appropriations in the budget bill are to be based on the ongoing formula requirements in the formula statute. Increasingly, it would appear that governors are attempting to affect changes to their state school funding formulas through their annual budget bills. Strategically, it can be hard for legislatures to successfully amend these budget bills and re-implement their formula as adopted, because the annual budget bills include everything under the sun (all components of the state budget) and not just school funding.

Last year, the Governor’s office, through the executive budget, did actually change the equation – which is the law. And, by first glance of this year’s district by district aid runs it would appear that they have again done the same. It would appear, though I’ve yet to receive the data to validate, that the governor’s office in producing its estimates of how much each district should receive, relied on the same method as for the current year – a method which proposes to reduced specific weighting factors in the formula, and perhaps most disturbingly, exerts executive authority to change the basic way in which kids are counted for funding purposes.

Here’s the language from last year’s executive budget book:

pg D-83 http://www.state.nj.us/treasury/omb/publications/13budget/pdf/FY13BudgetBook.pdf

Notwithstanding the provisions of any law or regulation to the contrary, the projected resident enrollment used to determine district allocations of the amounts hereinabove appropriated for Equalization Aid, Special Education Categorical Aid, and Security Aid shall include an attendance rate adjustment, which is defined as the amount the state attendance rate threshold exceeds the district’s three–year average attendance rate, as set forth in the February 23, 2012 State aid notice issued by the Commissioner of Education.

Did you catch that? It says that resident enrollment, throughout the formula will be adjusted in accordance with an attendance rate factor. A facto that is not, in fact, in the legislation itself. It is not part of the equation that is the law.

Here’s a mathematical expression of the change:

Legal Funding Formula

AB = (BC + AR Cost + LEP Cost + COMB Cost + SE Census) x GCA

BC = BPA x WENR

AR Cost = BPA x ARWENR x AR Weight

LEP Cost = BPA x LWENR x LEP Weight

COMB Cost = BPA x CWENR x (AR Weight + COMB Weight)

Executive Funding Formula

AB = (BC + AR Cost + LEP Cost + COMB Cost + SE Census) x GCA

BC = BPA x WENR x CRAP*

AR Cost = BPA x ARWENR x CRAP* x AR Weight

LEP Cost = BPA x LWENR x CRAP* x LEP Weight

COMB Cost = BPA x CWENR x CRAP* x (AR Weight + COMB Weight)

*Cerf Reduction for Attending Pupils [attributed to Cerf here because this adjustment was originally proposed in his report to the Governor on the school finance formula]

This change is unquestionably a change to the law itself. This is a substantive change with ripple effects throughout the formula. And as I understand Civics 101, such a change is well beyond the authority of the executive branch.

Permitting such authority to go unchecked is a dangerous precedent!

Then again, it’s a precedent already endorsed by the President and U.S. Secretary of ed in their choice to grant waivers to states and local districts to ignore No Child Left Behind, which was/is an act of Congress.  But who cares about that pesky old checks and balances stuff anyway? That’s so… old school… so… constitutional…

Why it Matters

What I find most offensive about this power play is that the change imposed through abuse of executive power is a change to enrollment count that is well understood to be the oldest trick in the book for reducing aid to high poverty, high minority concentration districts.

In New Jersey, as elsewhere, attendance rates are lower – for reasons well beyond school & district control – in districts serving larger shares of low income and minority children. Using attendance rates to adjust funding necessarily, systematically reduces funding from higher poverty districts. Here are the attendance rates by grade level and by district factor group (where A districts are low wealth/income districts and IJ are high wealth/income).

CRAP Adjustment

And here are a handful of related articles which address this issue, and related issues in other settings:

  • Baker, B. D., & Green III, P. C. (2005). Tricks of the Trade: State Legislative Actions in School Finance Policy That Perpetuate Racial Disparities in the Post‐Brown Era. American Journal of Education, 111(3), 372-413.
  • Baker, B. D., & Corcoran, S. P. (2012). The Stealth Inequities of School Funding: How State and Local School Finance Systems Perpetuate Inequitable Student Spending. Center for American Progress.
  • Green III, P. C., & Baker, B. D. (2006). Urban Legends, Desegregation and School Finance: Did Kansas City Really Prove That Money Doesn’t Matter. Mich. J. Race & L., 12, 57.

The Non-reformy Lessons of KIPP

We’ve all now had a few days to digest the findings of the most recent KIPP middle school mega-study. I actually do have some quibbles with the analyses themselves and the presentation of them, one of which I’ll address below, but others I’ll set aside for now.  It is the big picture lessons that are perhaps most interesting.

I begin this post with a general acceptance that this study, like previous KIPP studies, and like studies of charter effectiveness in markets generally characterized by modest charter market share and dominance of high flying charter chains, typically find that the kids attending these charters achieve marginal gains in math, and sometimes reading as well (as in the new KIPP study). These findings hold whether applying a student matching analysis or lottery based analysis (though neither accounts for differences in peer group).

In the past few years, we’ve heard lots of talk about no excusesness and its (supposed) costless (revenue neutral) effectiveness and potential to replace entire urban school systems as we know them (all the while reducing dramatically the public expense).  But the reality is that what underlies the KIPP model, and that of many other “high flying” no excuses charter organizations, are a mix of substantial resources, leveraged in higher salaries, additional time – lots of additional time (and time is money) and reasonable class sizes, coupled with a dose of old-fashioned sit-down-and-shut up classroom/behavior management and a truckload of standardized testing. Nothin’ too sexy there. Nothin’ that reformy. Nothin’ particularly creative.

The brilliant Matt Di     Carlo of Shanker Blog shared with me this quote in e-mail exchanges about the study yesterday:

In other words, the teacher-focused, market-based philosophy that dominates our public debate is not very well represented in the “no excuses” model, even though the latter is frequently held up as evidence supporting the former. Now, it’s certainly true that policies are most effective when you have good people implementing them, and that the impact of teachers and administrators permeates every facet of schools’ operation and culture. Nonetheless, most of the components that comprise the “no excuses” model in its actual policy manifestation are less focused on “doing things better” than on doing them more. They’re about more time in school, more instructional staff, more money and more testing. I’ve called this a “blunt force” approach to education, and that’s really what it is. It’s not particularly innovative, and it’s certainly not cheap.

Expanding on Matt’s final comment here, our report last summer on charter schools found specifically that the costs of scaling up the KIPP model, for example, across all New York City or Houston middle schools would be quite substantial:

Extrapolating our findings, to apply KIPP middle school marginal expenses across all New York City middle school students would require an additional $688 million ($4,300 per pupil x 160,000 pupils). In Houston, where the middle school margin is closer to $2,000 per pupil and where there are 36,000 middle schoolers, the additional expense would be $72 million. It makes sense, for example, that if one expects to find comparable quality teachers and other school staff to a) take on additional responsibilities and b) work additional hours (more school weeks per year), then higher wages might be required. We provide some evidence that this is the case in Houston in Appendix D. Further, even if we were able to recruit an energetic group of inexperienced teachers to pilot these strategies in one or a handful of schools, with only small compensating differentials, scaling up the model, recruiting and retaining sufficient numbers of high quality teachers might require more substantial and sustained salary increases.

But, it’s also quite possible that $688 million in New York or $72 million in Houston might prove equally or even more effective at improving middle school outcomes if used in other ways (for example, to reduce class size). Thus far, we simply don’t know.

Baker, B.D., Libby, K., & Wiley, K. (2012). Spending by the Major Charter Management Organizations: Comparing charter school and local public district financial resources in New York, Ohio, and Texas. Boulder, CO: National Education Policy Center. Retrieved [date] from http://nepc.colorado.edu/publication/spending-major-charter.

Here’s a link to my rebuttal to the rather disturbing KIPP response to our report.

In a recent paper, I continue my explorations of the resource (and demographic) differences of charter schools and their urban contexts. In particular, I’ve been trying to get beyond just looking at aggregate per pupil spending and instead, digging into differences in tangible classroom resources. Here are some related findings of my current paper co-authored with Ken Libby and Katy Wiley.

Baker.Libby.Wiley.Charters&WSF.FEB2013

Finances

Table 5 shows the regression results comparing the site based spending per pupil of charters by affiliation, with New York City district schools serving similar populations, the same grade levels and in the same borough. When comparing by % free or reduced lunch, where KIPP schools are more similar to their surroundings, KIPP schools spent about $4,800 more per pupil. When comparing by % free lunch alone, where KIPPs have lower rates than many surrounding schools, KIPP schools spent more than $5,000 more per pupil.

Slide10

Table 6 shows similar analysis for the Houston Texas area, including schools in surrounding districts which overlap Houston City limits. Splitting KIPPs by those that serve elementary grades (Iower) versus those serving middle (and some upper) grades, This table shows that KIPPs serving lower grades spent marginally less than district schools. KIPPs serving middle/upper grades spent over $3,000 per pupil more.

Slide11

Specific Resource Inputs

This figure shows the relative salaries of teachers, both on an annual basis and equated for months on contract in New York City. KIPP teachers at same degree and experience level were paid about $4,000 more than district teachers. Equating contract months KIPP teachers were paid about the same as district teachers. But the central point here is that KIPP teachers were paid more for the additional time. That said, it would appear that teachers in some other NYC charters were paid even more than KIPPs at same degree and experience level.

Figure 1. Relative Salaries in New York City

Slide12

Here’s a plot of teacher salaries by experience level in Houston Texas. KIPP teachers across the range of experience receive a substantial salary premium for their time and effort.

Slide13

Figure 2. Relative Salaries in Houston

As I’ve said before. This simply makes sense. This is not a critique. These graphs are constructed with publicly available data – the New York State Personnel Master File and the Texas equivalent. I would argue that what KIPP schools are doing here is simple and logical. They are providing more time to get kids further along and they are acknowledging through their compensation systems that if you want to get sufficient quality teachers to provide that additional time, you’re going to have to pay a decent wage.

Finally, here’s a plot of the relative class sizes in New York City, also constructed by regression analysis accounting for location and grade range.

Figure 3. Relative Class Sizes in New York City

Slide14

An “are you kidding me?” moment

There was one point in reading the KIPP report that my head almost exploded. This was where the authors of the report included a ridiculously shoddy analysis in order to brush off claims of cream-skimming. In figure ES.1 of the report, the authors make the argument that it is clear that KIPP schools are not cream-skimming more desirable students by comparing KIPP student characteristics to those of all students in the schools from whence the KIPP students came.  

Figure ES.1. The Non-Proof of Non-Creamskimming

Slide4

The authors are drawing this bold conclusion while relying on but a handful of extremely crude dichotomous characteristics of students.  They are assuming that any student who falls below the 185% income threshold for poverty is equally poor (whether in Arkansas or New York). But many of my prior analyses have shown that even if we take this dichotomous variable and make it, say, trichotomous, we may find that poorer kids (<130% income threshold) are less likely to sort into charter schools (more below).  It is equally if not even more problematic to use a single dummy variable for disability status – thus equating the charter enrolled child with speech impairment to the district enrolled child with traumatic brain injury. The same is likely true of gradients of language proficiency.

The problems of the crudeness of classification are exacerbated when you then average them across vastly disparate contexts.   IT WOULD BE ONE THING if the authors actually threw some caveats about data quality and available and moderated their conclusions on this basis. But the authors here choose to use this ridiculous graph as the basis for asserting boldly that the graph provides PROOF that cream-skimming is not an issue.

Look, we are all often stuck with these less than ideal measures and must make the best of them. This example does not, by any stretch make the best of these inadequate measures. In fact, it makes them even worse (largely through their aggregation across disparate contexts)!

An Alternative look at Houston and New York

I don’t have the data access that Mathematica had for conducting their study. But I have, over time, compiled a pretty rich data set on finances of charter schools in New York and Texas from 2008 to 2010 and additional information on teacher compensation and other school characteristics. Notably, I’ve not compiled data on all of the KIPP charters in California, or all of the KIPP charters in Arkansas, Oklahoma, Tennessee or elsewhere. I’ve focused my efforts on specific policy contexts.  I’ve done that, well, because… context matters. Further, I’ve taken the approaches I have in order to gain insights into basic resource differences across schools, within specific contexts.

The following two tables are intended to make a different comparison than the KIPP creamskimming analysis. They are intended to compare KIPP, and other charter schools in these city contexts with the other schools serving same grade level students. That is, they are intended to compare the resulting peer context, not the sending/receiving pattern. It’s a substantively different question, but one that is equally if not far more relevant. I use regression models to tease out differences by grade range and within New York City, by location.

Table 3 shows that KIPP schools have relatively similar combined free/reduced lunch shares to other same grade schools in New York City (in the same borough). But, Table 3 also shows that KIPP schools have substantively lower % free lunch share (13% lower on average, but with individual schools varying widely). Table 3 also shows that KIPP schools have substantively lower ELL (11% fewer) and special education (3% fewer) populations in New York City.

Slide8

Table 4 shows the results for the Houston area, and this is why context is important to consider. While I would argue that New York City KIPPs do show substantial evidence of income related cream-skimming as well as ELL and special education, I can’t say the same across the board in Houston. Then again, I don’t have the free/reduced breakout in Houston. In Houston, the KIPPs do have lower total special education (and I’m unable to parse by disability type – which is likely important). KIPP middle schools in Houston appear to have higher free/reduced lunch share than middle schools in/around Houston.

Slide9

Differences between Houston and New York and for that matter every other KIPP context are masked by aggregation across all contexts, yet these differences may be relevant predictors of differences in KIPP success that may exist across these contexts.

Note that Houston and New York are non-trivial shares of the total KIPP sample. Here’s my run of KIPPs by state and by major city, using the NCES Common Core of Data 2010-11.

Slide6

Slide7

Revisiting the Foolish Endeavor of Rating Ed Schools by Graduates’ Value-Added

Knowing that I’ve been writing a fair amount about various methods for attributing student achievement to their teachers, several colleagues forwarded to me the recently released standards of the Council For the Accreditation of Educator Preparation, or CAEP. Specifically, several colleagues pointed me toward Standard 4.1 Impact on Student Learning:

4.1.The provider documents, using value-added measures where available, other state-supported P-12 impact measures, and any other measures constructed by the provider, that program completers contribute to an expected level of P-12 student growth.

http://caepnet.org/commission/standards/standard4/

Now, it’s one thing when relatively under-informed pundits, think tankers, politicians and their policy advisors pitch a misguided use of statistical information for immediate policy adoption. It’s yet another when professional organizations are complicit in this misguided use. There’s just no excuse for that! (political pressure, public polling data, or otherwise)

The problems associated with attempting to derive any reasonable conclusions about teacher preparation program quality based on value-added or student growth data (of the students they teach in their first assignments) are insurmountable from a research perspective.

Worse, the perverse incentives likely induced by such a policy are far more likely to do real harm than any good, when it comes to the distribution of teacher and teaching quality across school settings within states.

First and foremost, the idea that we can draw this simple line below between preparation and practice contradicts nearly every reality of modern day teacher credentialing and progress into and through the profession:

one teacher prep institution –> one teacher –> one job in one school –> one representative group of students

The modern day teacher collects multiple credentials from multiple institutions, may switch jobs a handful of times early in his/her career and may serve a very specific type of student, unlike those taught by either peers from the same credentialing program or those from other credentialing programs. This model also relies heavily on minimal to no migration of teachers across state borders (well, either little or none, or a ton of it, so that a state would have a large enough share of teachers from specific out of state institutions to compare). I discuss these issues in earlier posts.

Setting aside that none of the oversimplified assumptions of the linear diagram above hold (a lot to ignore!), let’s probe the more geeky technical issues of trying to use VAM to evaluate ed school effectiveness.

There exist a handful of recent studies which attempt to tease out certification program effects on graduate’s student’s outcomes, most of which encounter the same problems. Here’s a look at one of the better studies on this topic.

  • Mihaly, K., McCaffrey, D. F., Sass, T. R., & Lockwood, J. R. (2012). Where You Come From or Where You Go?

Specifically, this study tries to tease out the problem that arises when graduates of credentialing programs don’t sort evenly across a state. In other words, a problem that ALWAYS occurs in reality!

Researchy language tends to downplay these problems by phrasing them only in technical terms and always assuming there is some way to overcome them with statistical tweak or two. Sometimes there just isn’t and this is one of those times!

Let’s dig in. Here’s a breakdown of the abstract:

In this paper we consider the challenges and implications of controlling for school contextual bias when modeling teacher preparation program effects. Because teachers from any one preparation program are hired in more than one school and teachers are not randomly distributed across schools, failing to account for contextual factors in achievement models could bias preparation program estimates.

Okay, that’s a significant problem! Teachers from specific prep institutions are certainly not likely to end up randomly distributed across a state, are they? And if they don’t, the estimates of program effectiveness could be “biased.” That is, the estimates are wrong! Too high, or to low, due to where their grads went as opposed to how “good” they were. Okay, so what’s the best way to fix that, assuming you can’t randomly assign all of the teacher grads to similar schools/jobs?

Including school fixed effects controls for school environment by relying on differences among student outcomes within the same schools to identify the program effects.  However, the fixed effect specification may be unidentified, imprecise or biased if certain data requirements are not met.

That means, that the most legit way to compare teachers across programs is if you can compare teachers whose first placements are in the same schools, and ideally where they serve similar groups of kids. And, you’d have to have a large enough sample size at the lowest level of analysis – comparable classrooms within school – to accomplish this goal. So, the best way to compare teachers across prep programs is to have enough of them, from each and every program, in each school, teaching similar kids similar subjects at the same grade level, across grade levels. Hmmmm…. How often are we really likely to meet this data requirement?

Using statewide data from Florida, we examine whether the inclusion of school fixed effects is feasible in this setting, the sensitivity of the estimates to assumptions underlying for fixed effects, and what their inclusion implies about the precision of the preparation program estimates. We also examine whether restricting the estimation sample to inexperienced teachers and whether shortening the data window impacts the magnitude and precision of preparation program effects. Finally, we compare the ranking of preparation programs based on models with no school controls, school covariates and school fixed effects. We find that some preparation program rankings are significantly affected by the model specification. We discuss the implications of these results for policymakers.

With “no school” controls means not accounting at all for differences in the schools where grads teach. With “covariates” means correcting in the model for the measured characteristics of the kids in the schools – so – trying to compare teachers who teach in similar – by measured characteristics – schools. But, measured characteristics often fail to catch all the substantive differences between schools/classrooms.  And where “school fixed” effects means comparing graduates from different institutions who teach in the same school (though not necessarily the same types of kids!).

Okay, so the authors tested their “best” methodological alternative (comparing teachers within schools, by school “fixed” effect) with other approaches, including making no adjustment for where teachers went, or making adjustments based on the characteristics of the schools, even if not matched exactly.

The authors found that the less good alternatives were, to no surprise, less good- potentially biased. The assumption being that the fixed effect models are most correct (which doesn’t, however, guarantee that they are right!).

So, if one can only legitimately (though really not in this case either) compare teacher prep programs in cases where grads across programs are concentrated in the same schools for their first jobs, that’s a pretty severe limitation. How many job openings are there in a specific grade range in a specific school in a given year – or even over a five year period? And how likely is it that those openings can be filled with one teacher each from each teacher prep institution. But wait, really we need more than one from each to do any legit statistical comparison – and ideally we need for this pattern to be replicated over and over across several schools. In other words, the constraint imposed to achieve the “best case” model in this study is a constraint that is unlikely to ever be met for more than a handful of large teacher prep institutions concentrated in a single metropolitan area (or very large state like Florida).

Other recent studies have not found VAM particularly useful in parsing program effects:

We compare teacher preparation programs in Missouri based on the effectiveness of their graduates in the classroom. The differences in effectiveness between teachers from different preparation programs are very small. In fact, virtually all of the variation in teacher effectiveness comes from within-program differences between teachers. Prior research has overstated differences in teacher performance across preparation programs for several reasons, most notably because some sampling variability in the data has been incorrectly attributed to the preparation programs.

Koedel, C., Parsons, E., Podgursky, M., & Ehle, M. (2012). Teacher Preparation Programs and Teacher Quality: Are There Real Differences Across Programs? (No. 1204).

http://econ.missouri.edu/working-papers/2012/WP1204_koedel_et_al.pdf

Example from Kansas

Let’s use the state of Kansas and graduates over a five year period from the state’s major teacher producing institutions to see just how problematic it is to assume that teacher preparation institutions in a given state will produce sufficient numbers of teachers who teach in the same schools as graduates of other programs.

All programs

Slide3

Specific programs

Slide4

Slide5

Slide6

Slide7

Slide8

Slide9

Indeed, the overlap in more population dense states is somewhat more significant, but still unlikely sufficient to meet the high demands of the fixed effects specification (where you can only essentially compare when you have graduates of different programs working in the same school together, in similar assignments… presumably similar number of years out of their prep programs).

Strategically Gaming Crappy, Biased Measures of “Student Growth”

In practice, I doubt most schools of ed, or state education agencies will actually consider how to best model program effectiveness with these measures. They likely won’t even bother with this technically geeky question of the fixed effects model, and data demands to apply that model. Rather, they’ll be taking existing state provided growth scores or value-added estimates and aggregating them across their graduates.

Given the varied, often poor quality of state adopted metrics, the potential for CAEP Standard 4.1 to decay into absurd gaming is quite high. In fact, I’ve got a gaming recommendation right here for teacher preparation institutions in New York State.

We know from the state’s own consultant analyzing the growth percentile data that:

Despite the model conditioning on prior year test scores, schools and teachers with students who had higher prior year test scores, on average, had higher MGPs. Teachers of classes with higher percentages of economically disadvantaged students had lower MGPs. (p. 1) https://schoolfinance101.com/wp-content/uploads/2012/11/growth-model-11-12-air-technical-report.pdf

We also know from this same technical report that the bias appears to strengthen with aggregation to the school level. It may also strengthen with aggregation across similar schools. And this is after conditioning the model on income status and disability status.

As such, it is in the accreditation interest of any New York State teacher prep institution to place as many grads as possible into lower poverty schools, especially those with fewer children with disabilities. By extension, it is therefore also in the accreditation interest of NY State teacher prep institutions to reduce the numbers of teachers they prepare in the field of special education. As it turns out, the New York State growth percentiles are also highly associated with initial scores – higher initial average scores are positively associated with higher growth. So, getting grads into relatively higher performing schools might be advantageous.

With a little statistical savvy, a few good scatteplots, one can easily mine the biases of any state’s student growth metrics to determine how to best game them in support of CAEP standard 4.1.

Further, because it is nearly if not entirely impossible to use these data to legitimately compare program effects, the best one can do is to find the most advantageous illegitimate approach.

Are these really the incentives we’re looking for?

What does the New York City Charter School Study from CREDO really tell us?

With the usual fanfare, we were all blessed last week with yet another study seeking to inform us all that charteryness in-and-of-itself is preferential over traditional public schooling – especially in NYC! In yet another template-based pissing match (charter vs. district) design study, the Stanford Center for Research on Educational Outcomes provided us with aggregate comparisons of the estimated academic growth of a two groups of students – one that attended NYC charter schools and one that attended NYC district schools. The students were “matched” on the basis of a relatively crude set of available data.

As I’ve explained previously in discussing the CREDO New Jersey report, the CREDO authors essentially make do with the available data. It’s what they’ve got. They are trying to do the most reasonable quick-and-dirty comparison, and the data available aren’t always as precise as we might wish them to be. But, this is also not to say that supposed Gold Standard “lottery-based” studies are all that. The point is that doing policy research in context is tricky, and requires numerous important caveats about the extent to which stuff is, or even can be truly randomized, or truly matched.

The new CREDO charter study found that children attending charters outpaced their peers in district schools in math (significantly) and somewhat less so in reading (relatively small difference). Their analysis included six years of data through 2010-11 (meaning that the last growth period included would be 2009-10 to 2010-11).

How does a CREDO study work?

Students are matched with a virtual peer, where one attends a district school and another attends a charter school. The NYC CREDO study matches students on the following bases:

  • Grade-level
  • Gender
  • Race/Ethnicity
  • Free or Reduced Price Lunch Status
  • English Language Learner Status
  • Special Education Status
  • Prior test score on state achievement tests

The CREDO study does not match students by:

  • Their level of free vs. reduced priced lunch, which may be consequential to the validity of the match if the students in the district school sample are more likely to be free lunch than reduced lunch and the charter school sample the opposite.
  • The type or severity of disability, which may be similarly consequential if it turns out that the charter students are less likely to have more severe disabilities.

Prior score should partially compensate for these shortcomings. But, I discussed some of the problems that arise from assuming these matches to be adequate in a previous post. Nonetheless, this is still a secondary issue.

Perhaps the biggest issue here is that the CREDO method makes no attempt to separate the composition of the peer group from the features of the school. That is, it may be the case that some portion – even a large portion – of the effectiveness being attributed to charter schools is merely a function of putting together a group of less needy students.

CREDO School Effect = Peer Effect + School Effect

So who cares? Why is this important? As I’ve explained a number of times in this blog, from a policy perspective the “scalable” portion is the “school effect” or the stuff – educational programs/services/teacher characteristics, etc. that lead to differences in student achievement even if all of the kids were the same (not just the observed/matched child). If the effect is largely driven by achieving a selective peer group, that may be equally valuable for children who have access to this school, but one can only stretch the selective peer group model so far in the context of a high poverty city. It’s not scalable. It’s a policy that necessarily requires advantage a few (in terms of peer group) while disadvantaging others.

What about those peer groups?

Here’s a look at the “relative demographics” of New York City charter schools compared to schools serving the same grade ranges in the same borough.  This figure is derived from data used in a previous report, and being used in a forthcoming study, where we go to great lengths to determine a) the comparability of students, b) the characteristics of teachers, programs and services and c) the comparable spending levels of New York City charter schools and district schools serving similar students of similar grade ranges. Our studies have employed data from 2008-2010, significantly overlapping the CREDO study years.

Figure 1. Relative Demographics of Selected Management Organizations 2008-10

Slide3

Here, we see that compared to same grade level schools in the same borough, NYC charters have in many groups, 10% to 20% fewer children qualifying for free lunch (<130% income level for  poverty), even if they appear to have comparable shares qualifying for free or reduced price lunch (<185% income level for poverty). These groups are substantively different in terms of their educational outcomes.

Further, charters serve a much lower share of children with limited English language proficiency, a finding validated by other authors. And charter schools generally serve much lower shares of children with disabilities (a finding we explored in greater detail here!).

So, while CREDO matched individual students by the crude characteristics above, they did not attempt to separate in their analysis, whether actual school quality factors, or these substantive peer group differences, were the cause of differences in student achievement growth.

Now, we have no idea what share of the growth, if any, is explained by peer effect, but we do know from a relatively large body of research that selective peer effects work both to advantage those selected into the desirable peer group and disadvantage those selected out. That aside, it is conceivable that New York City charter schools are doing some things that may lead to differential achievement growth. In fact, given what we now know from our various studies of New York City charter schools (including peer sorting), I’d be quite shocked and perhaps even disappointed if NYC charters were not able to leverage their various advantages to achieve some gain for students!

In New York City, what are those strategies? [School Effects?]

Let’s start with class size variation. We used data from 2008 to 2010 to determine the average difference in class size between NYC charter school sand district schools serving similar grade ranges and similar student populations. Here’s what we found for 8th grade as an example.

Figure 2. Charter Class Size Difference from Similar District School

Slide4

Now, on to teacher salaries. First, we used individual teacher level data to estimate the salary curve by experience for teachers in NYC charter schools and similar assignments in district schools. Here’s what we found. Charter teachers, who already have smaller class sizes on average, are getting paid substantively more in many cases (in particularly elite/recognized charter management chains).

Figure 3. Projected Teacher Salaries (based on regression model of individual teacher data)

Slide8

But, that pay does come with additional responsibilities, which for students translates to a) longer school years and b) greater individual attention. Here are the contract month differences for NYC charter and district school teachers.

Figure 4. Contract Months

Slide9

Figure 5. Salary Controlling for Months

Slide10

Others have noted that “no excuses” models often provide substantial additional time in terms of length of school year and length of school day (+20% to 30% more time), but most have failed to provide reasonable cost analysis of this additional time.  Here are a few pictures of the comparable spending levels of district and charter schools, for elementary and middle schools by special education share (the strongest predictor of differences in site budgets per pupil in NYC.

Figure 6. Spending per Pupil and Special Education for Elementary Schools.

Slide7

Figure 7. Spending per Pupil and Special Education for Middle Schools.

Slide6

In our more comprehensive report on the topic and in a related forthcoming article, we have found that leading charter management organizations often spend from $3,000 to $5,000 more per pupil in NYC than do district schools serving similar populations.

To Summarize

Okay, so we know that:

CREDO School Effect = Peer Effect + School Effect

And we know that the peer groups into which the “matched” kids were sorted are substantively different from one another and that various school resources are substantively different (despite what some very poorly constructed, very selective analyses might suggest).  It’s certainly possible that BOTH MATTER – and that BOTH MATTER quite a lot. Or at least they should.

Figure 8. The Real Question behind the NYC CREDO Study?

NYC CREDO

Actually, it’s rather depressing that all that additional time, paid for in additional salaries and applied to smaller classes of more advantaged kids couldn’t accomplish an even better gain on reading assessments. That would undermine a lot of what we currently understand about schooling and peer effects.

And the Policy Implications Are?

What’s most important here is how we interpret the policy implications. Certainly, given the wide variation in both district and charter schooling in NYC and substantial differences between them, it would be foolish to assert that any differences found in the CREDO study provide endorsement of charter expansion. That is, provide endorsement of simply adding more schools called charter schools. The study is a study of charter schools that serve largely selective populations and have lots of additional resources for doing so. This by no means provides endorsement that we could just add any old charter schools in any neighborhood and achieve similar results.

It also may be the case that even if we try our hardest to replicate only the good charters, that as charter market share increases in NYC, both the more advantaged students and the access to big money philanthropy starts to run thin. Note that the NYC share of children in charter schools remained under/around 4% during the period studied – a sharp contrast from other states/cities where charter performance has been much less stellar.

An alternative assertion that might be drawn from combining the NYC charter study with our previous studies, is that more students might benefit from being provided additional resources. But scaling up these charter alternatives would not be cheap. Here’s what we found in our comparisons of New York City and Houston:

These findings, coupled with evidence from other sources discussed earlier in this report, paint a compelling picture that “no excuses” charter school models like those used in KIPP, Achievement First and Uncommon Schools, including elements such as substantially increased time and small group tutoring, may come at a significant marginal cost. Extrapolating our findings, to apply KIPP middle school marginal expenses across all New York City middle school students would require an additional $688 million ($4,300 per pupil x 160,000 pupils). In Houston, where the middle school margin is closer to $2,000 per pupil and where there are 36,000 middle schoolers, the additional expense would be $72 million. It makes sense, for example, that if one expects to find comparable quality teachers and other school staff to a) take on additional responsibilities and b) work additional hours (more school weeks per year), then higher wages might be required. We provide some evidence that this is the case in Houston in Appendix D. Further, even if we were able to recruit an energetic group of inexperienced teachers to pilot these strategies in one or a handful of schools, with only small compensating differentials, scaling up the model, recruiting and retaining sufficient numbers of high quality teachers might require more substantial and sustained salary increases.

But, it’s also quite possible that $688 million in New York or $72 million in Houston might prove equally or even more effective at improving middle school outcomes if used in other ways (for example, to reduce class size). Thus far, we simply don’t know.

As I noted in a previous post, it’s time to get beyond these charter vs. district school pissing match studies and seek greater precision in our comparisons and deeper understanding of “what works” and what is and isn’t “scalable.”

A drop in a half empty bucket? In defense of deprivation in NY

First, here’s a primer and reading list on the Empire State of School Finance:

  1. New York State maintains one of the least equitable state school finance systems in the nation
  2. New York State actually allocates a ton of state aid to districts that need it least, exacerbating the disparities
  3. Reformy types in New York State thought, under these circumstances, it would be really cool to make any additional state aid a district receives contingent on adopting a teacher evaluation scheme based on their documented deeply flawed metrics!
  4. To ice that reformy cake, the legislature saw fit to – after slashing state aid year after year – impose a local property tax limit on districts so that they are unable to even raise the funds they would need to provide a sound basic education, if they could raise those funds locally.

ohhh… but I’m just getting started here.  Then came the lawsuits. That’s what makes this so fun and interesting to watch.

Now, there is already a pending lawsuit challenging the overall adequacy of state funding in New York specifically for high need cities (brought by the state’s small city school districts).

More recently however, we’ve been hearing of two separate cases.

First, we have the state teacher’s union (as reported) suing the state over the imposition of the property tax cap, which, in effect prohibits many districts from making up the difference from the aid they’ve been screwed out of for the past several years – the aid that in theory – by the state’s own definition of its foundation formula – would provide for a sound basic education. That formula was implemented specifically to comply with a previous court order in Campaign for Fiscal Equity. 

Next, we have the lawsuit brought on behalf of children in New York City schools challenging the state’s authority to reduce the city’s funding by $250 million for non-compliance with adopting a teacher evaluation policy.

So far, it would appear that this argument has achieved a positive, immediate response from the judge, who a this stage has blocked the state funding reduction.
As laid out in full here: http://schoolfunding.info/wp-content/uploads/2013/02/Memorandum-of-Law-in-Opp-to-App-for-Prelim-Inj1.pdfAnd as characterized here: http://schoolfunding.info/2013/02/miriam-aristy-v-state-of-new-york/

Assistant Attorney General Steven Schulman described the $250 million that the state will cut from NYC schools as a “drop in the bucket” and argued that it was not great enough to have any effect on schools’ ability to provide a sound basic education.

The state’s defense of its actions is essentially that $250 million really isn’t that much money for New York City and certainly doesn’t deprive NYC schoolchildren of receiving their constitutionally mandated sound, basic education. And that forcing the state to provide the $250 million would undermine their authority. That is, their authority to deprive kids of their constitutionally mandated sound basic education! ? ! ? huh? Now, this is all part of legal maneuvering. Yeah… it would be difficult for NYC to show that holding back this additional 3.3% state funding tips the scales on whether the city can provide a sound basic education. As such, how can the court reason intervening and forcing the state to give this money back?
But that’s only if we set aside that the state of New York is already depriving New York City schoolchildren of 38% of the aid that should be allocated to the city based on the state’s own formula for what the city needs to provide a sound basic education. And that was a bogus, low-balled estimate to begin with. Here’s my quick run down on state aid shortfalls in 2012-13 – with respect to the state’s own estimates – for small city districts and for New York City:

Foundation Aid, Foundation after GEA expressed in Thousands (‘000s)Slide1New York City is being shorted about 3.4 billion in aid to achieve what the state has defined as “sound basic” funding. That’s about 38% of their total foundation aid.  That share is even larger for some small city districts. This next table shows that this amounts to thousands per pupil. Slide2 Sure, the loss from the teacher evaluation debacle amounts to a few hundred per pupil. But hey, what’s the harm? NYC is already being shorted over $3,000 per pupil.By the state’s logic, we, and the sitting judge are asked to ignore that the bucket into which that drop is to fall (or not) is nearly half empty (no, not half full… well… actually… about 62% full) to begin with.  That the murder who stabs to death a victim one day, and comes back to stab the already dead body one more time the next, is not guilty of any marginal crime for his actions on the second day.Perhaps not in the final legal analysis. I’ll leave that for the judge to figure out. But in my view, it’s still pretty damned offensive.

From Portfolios to Parasites: The Unfortunate Path(ology) of U.S. Charter School Policy

I recall several years ago attending an initial organizing meeting for a special interest group on Charter Schools at the American Educational Research Association. Note to outsiders – AERA has several special interest groups, some research oriented, some advocacy oriented…  many somewhere in between. These are member organized groups and many are very small. If I recall correctly, there were a handful of us at that meeting, including Gary Miron, Katy Bulkley and a few others. If memory serves me, I think Rick Hess may have paid a visit to the meeting to argue that this new group should really just be a part of the school choice special interest group. All of that aside, I and others attended this meeting out of our interest in studying this relatively new concept of charter schools. Most of us were intrigued by the possibilities of alternative governance structures that might provide opportunity for innovation (what might now be referred to a disruptive innovation).

I didn’t spend a whole lot of time researching charters in my first few years after that, but eventually I did start to explore charter schooling and teacher labor markets – specifically the recruitment/retention of teachers based on different academic backgrounds – specifically college selectivity. My perspective was that some creative, energetic leadership (which might now be referred to as Cage-busting leadership) that might be associated with a mission-driven start-up school, coupled with an ounce or two of deregulation, and applied in the right context, might provide opportunities to recruit an academically talented pool of teachers. Our research largely supported these assertions.

  • Baker, B. D., & Dickerson, J. L. (2006). Charter Schools, Teacher Labor Market Deregulation, and Teacher Quality Evidence From the Schools and Staffing Survey. Educational Policy, 20(5), 752-778.

In recent years, however, my perception is that this whole movement has gotten way out of control – it has morphed dramatically – especially the punditry and resultant public policy surrounding charter schooling. Sadly, I’m reaching a point where I now believe that the end result is causing more harm than good.  In my view, many charter schools, and certainly the political movement of charter schooling, are no-longer operating in the public interest. In fact, they have all the incentive in the world to do just the opposite, and there is little or no sign of this turning around any time soon.

We’ve shifted dramatically, and rather quickly from what some might refer to as a portfolio model, to what I would now characterize as a parasitic one.

Overarching Incentives & Chartery Miracles

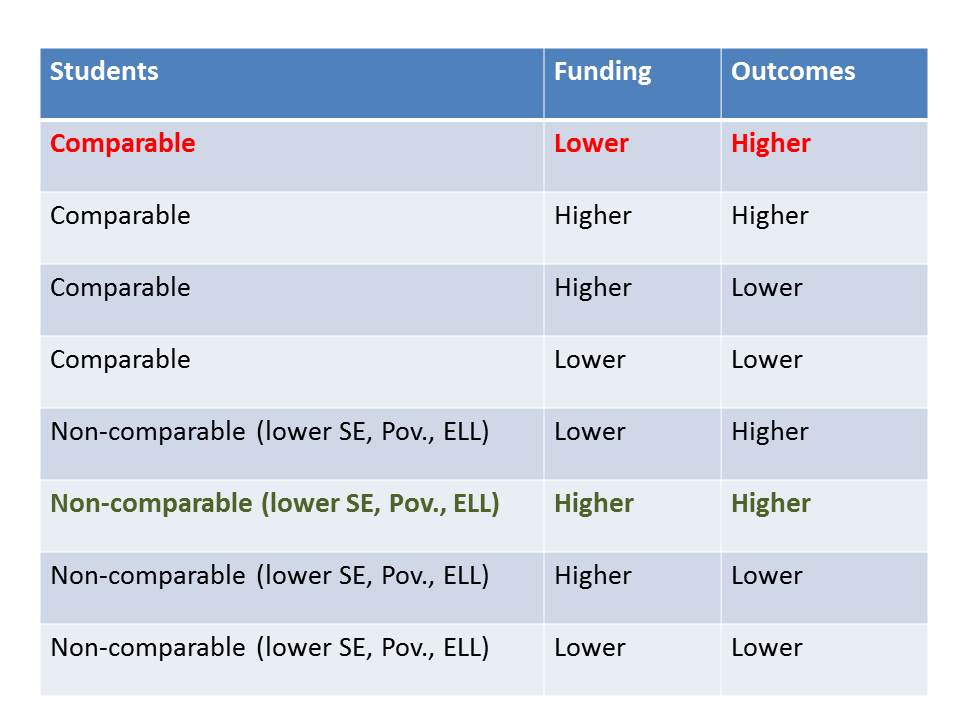
Since the early phases of significant national charter expansion which coincided (somewhat) with early implementation of NCLB, chartery success has been reduced to a definition reminiscent of the cult of efficiency. Chartery success (accompanied by headlines, news magazine segments and visits from politicians) is largely defined as A) getting higher test scores or greater test score growth, B) for less money, and C) with the “same” kids. Because this is the supposed definition of success, punditry around charter schooling – and research designed to endorse this punditry – makes every effort to validate A, while obfuscating or completely misrepresenting B and/or C.

Figure 1. Chartery Miracle Success Framework

Slide1

The central objective in Chartery Miracle Punditry is to prove that average scores, and otherwise methodologically weak policy analyses show that charter students outperform their traditional public school counterparts.

These studies rarely if ever include any accurate measure of the resources used by charters, more often than not citing bogus, irrelevant studies or providing flimsy back of the napkin analysis.

These studies often use entirely insufficient measures for declaring students as being “matched” with peers between district and charter schools, fail to consider fully the role of peer effects as one of the largest school factors, or the intersection of selective attrition and peer effects.

In part, because it is increasingly well understood that this is the way the game is played, charter school operators have all the incentive in the world to play the game this way (even if they were otherwise predisposed not to). And apparently far too many charter operators are responsive to these incentives.

Competition for Demographic Advantage

This recent Reuters article by Stephanie Simon explains practices actually used by many charter operators, arguably in response to current incentives.

http://www.reuters.com/article/2013/02/15/us-usa-charters-admissions-idUSBRE91E0HF20130215

In short, charter schools are applying a variety of creative strategies to screen out those students they feel won’t help their numbers. In some/many cases, children will be screened out on the basis of otherwise unobservable characteristics. Two low income children wish to apply… but only one is sufficiently motivated to complete the 15 page entry essay. They are labeled as similar as one returns to the district school and one matriculates to the charter, but clearly there is at least some difference between them which may influence their future performance. But these mechanisms also serve to sort out poorer children from more disrupted households, more mobile families, and non-English speaking families. And clearly they send a signal to parents of children with disabilities that this may not be the school for you.

In many parts of the country, especially in areas where charter schools serve a larger share of total enrollment, charter schools do seem to serve more lower income students. And in states where there exists an incentive to serve children with disabilities, charters often do so (boutique special education charters). But these incentives get out of hand as well.

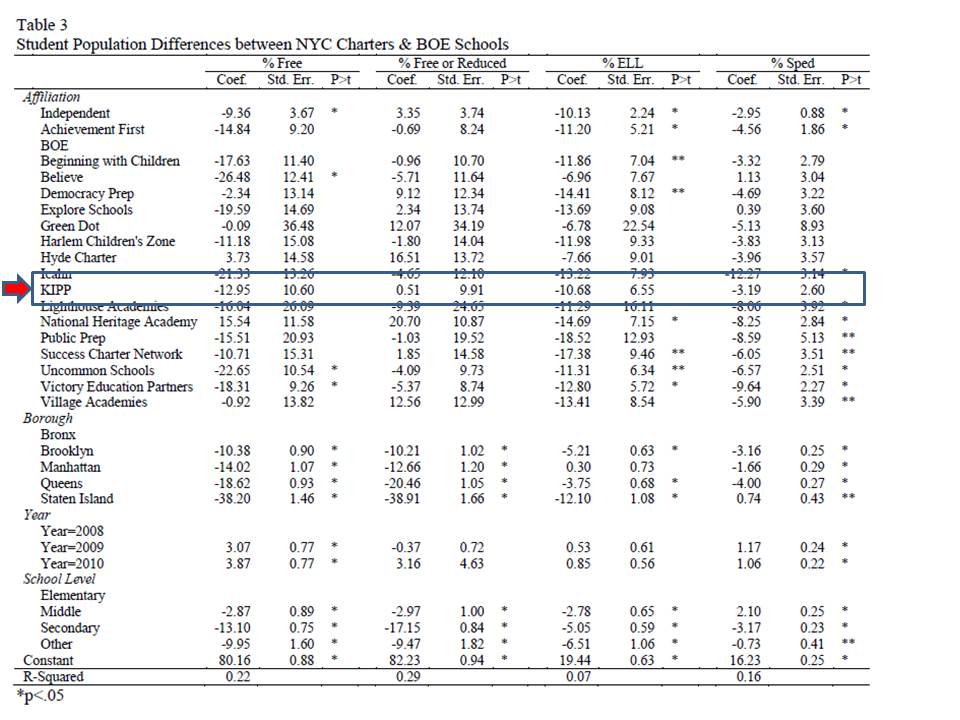
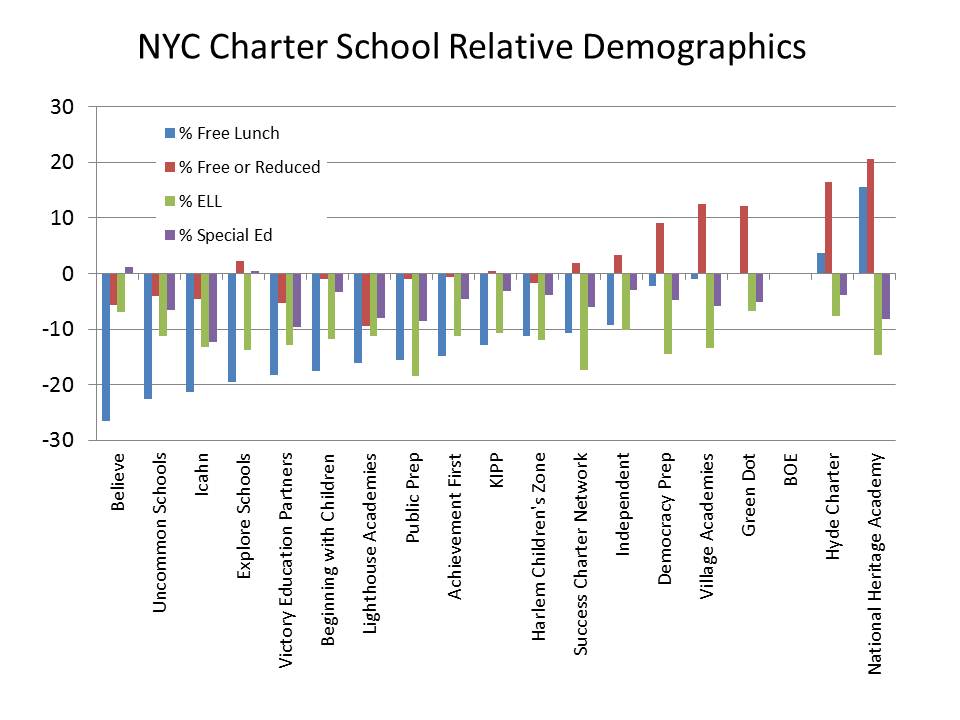
In affluent, economically diverse states like New Jersey, New York and Connecticut, as I commented in the Reuters article, my research (& related posts) shows substantial cream-skimming among charters.  Many of these findings are validated by others, as I explain in my reports/publications.  Here are a few figures on demographics of New York and Connecticut charter schools.

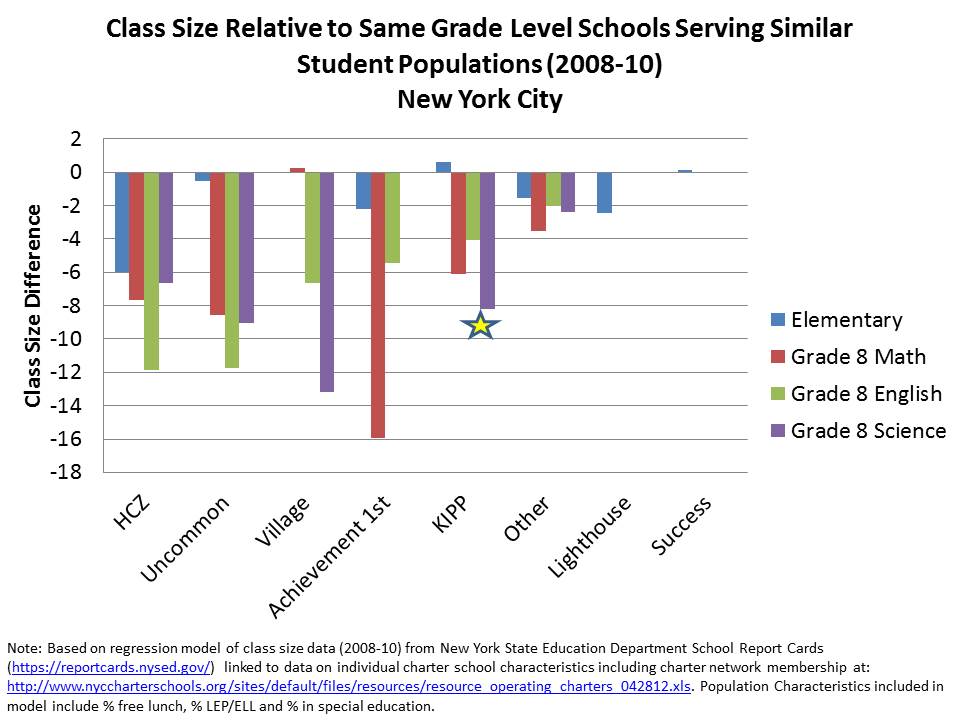
This figure on New York City Charter schools draws on data from a forthcoming article (related to a recent report). In this analysis, I use three years of data from 2008-10, and I estimate a regression equation for each demographic measure, comparing schools that serve the same grade level in the same borough of the city. The graph shows how much lower (or higher) the population share is in each charter school chain, relative to NYC district schools.

Figure 2. New York City Relative Demographics

Slide2

This next figure shows the demographics of Connecticut Charter Schools that are in high poverty cities. To construct this comparison, I combine CTDOE data with data from NCES Common Core. I sum the total number of public & charter school enrolled children by City (school location in CCD) and the total numbers of free lunch, ELL and special education enrolled children. Note that the special education concentrations are for only regular district (& charter) schools. Overall district rates of children with disabilities are marginally higher (because some are in special &/or private placements).

Table 1. Connecticut Charter Schools in High Poverty (<50% Free Lunch) Cities

Slide8

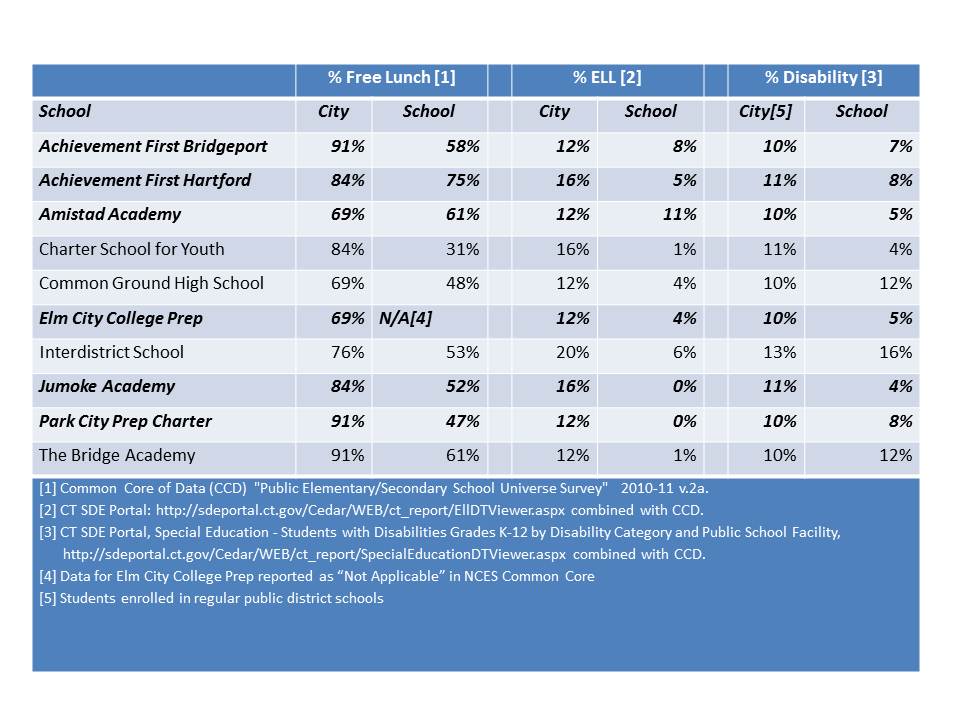
Let me make this absolutely clear. In a heterogeneous urban schooling environment, the more individual schools or groups of schools engage in behavior that cream skims off children who are less poor, less likely to face language barriers, far less likely to have a disability to begin with, and unlikely at all to have a severe disability, the higher the concentration of these children left behind in district schools.(see for example: https://schoolfinance101.wordpress.com/2012/08/06/effects-of-charter-enrollment-on-newark-district-enrollment/)

Indeed, as I’ve pointed out previously, districts create some similar (or even more extreme) segregation on their own through magnet schools, but under these circumstances, districts can (and should) regulate the extent of segregation – and specifically the extent to which high need children are left behind clustered in certain district schools. Certainly some urban districts do a very poor job at managing this balance.

But with independent charter expansion, districts lose the ability to even try to manage the balance. Sadly, what may initially have been conceived of as a symbiotic relationship between charter and district schools is increasingly becoming parasitic!

In a “competitive marketplace” of schooling within a geographic space, under this incentive structure, the goal is to be that school which most effectively cream skims – without regard for who you are leaving behind for district schools or other charters to serve – while best concealing the cream-skimming – and while ensuring lack of financial transparency for making legitimate resource comparisons.

This is precisely why the idea of replacing entirely urban public school systems with a portfolio of charters competing against one another with minimal centralized oversight, is a massively stupid [from a public policy perspective] idea.  That is, unless the overarching incentive structure were to change entirely. But I have little hope of that happening, and there seems to be little incentive for advocates of the extreme extension of charter madness to support altering the incentives.

There does seem to be some increased media and public awareness that many charter schools are indeed attempting to game their enrollments. Some charter (and chartering) advocates, including Mike Petrilli have capitulated on this point, but have suggested that this isn’t necessarily a bad thing. I might agree that with moderation, under the right controls, which requires some centralized governance/management, this may be partly true. But under current circumstances, it’s not.

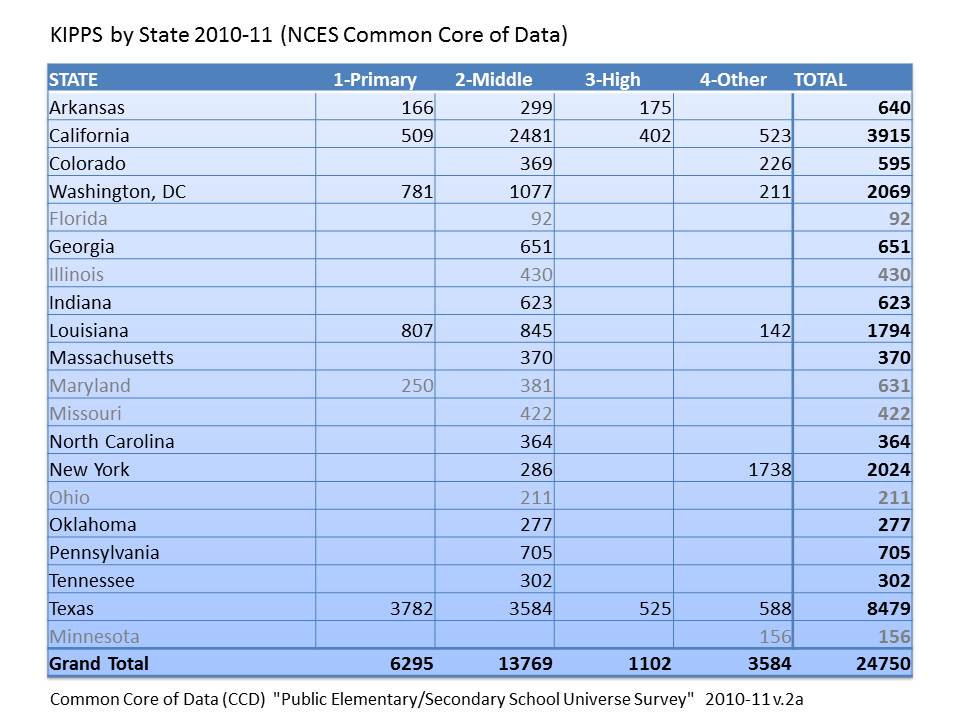
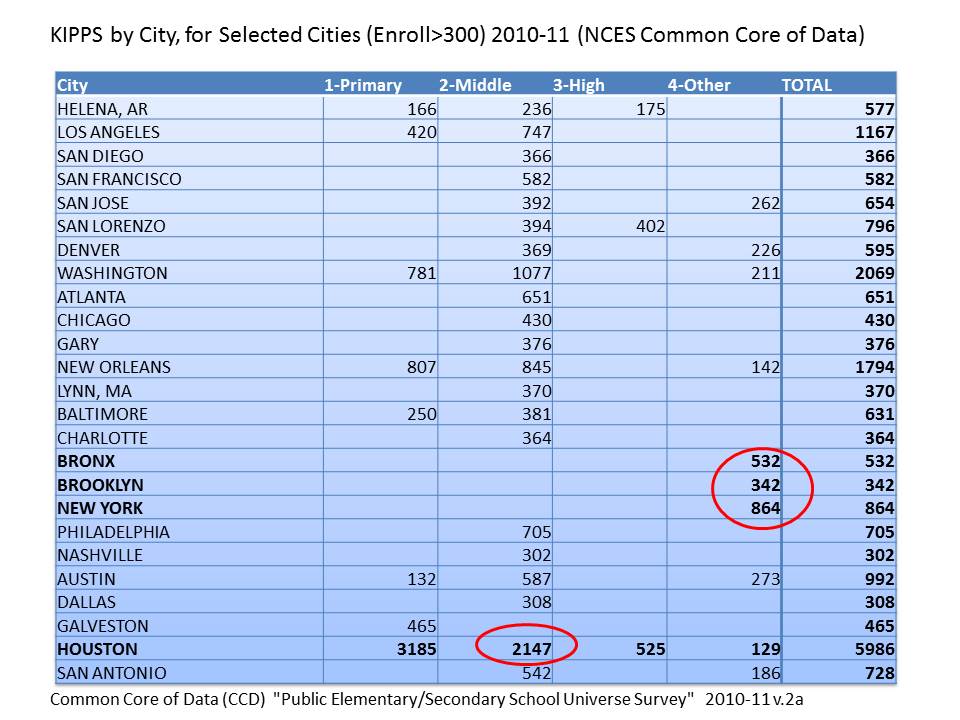
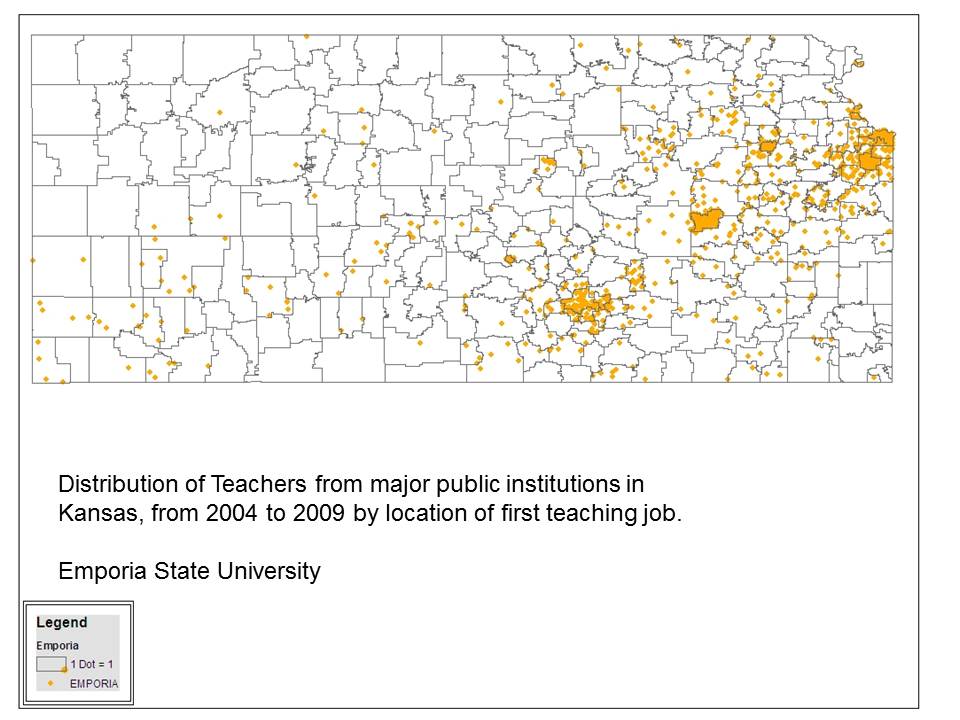
[sidebar – one need only look at the geographic distribution of charters in New Orleans or Kansas City with respect to neighborhood income to see how such a system, under the current incentive structure, will fail to serve the neediest children]

Competition for Resources

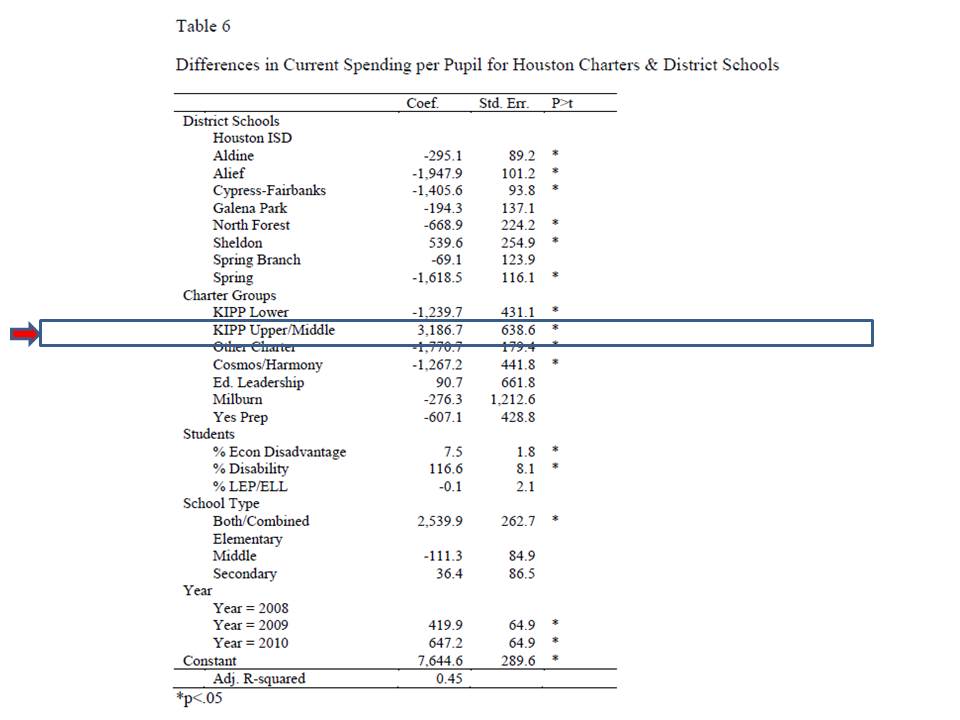
The last frontier of deception in the charter debates seems to be over comparability of resources.  Few if any studies which praise charter successes make any legitimate attempt to measure resources. Ken Libby, Katy Wiley and I did our best to tease out resource comparability in NYC, Texas and Ohio. The fact that our report has so darn many pages (over 20) of appendices, footnotes, caveats and explanations regarding those comparisons is testament to the fact that policymakers (and the charter industry influencing them) seem to have little interest in improving transparency or comparability of charter school finances.

Lack of clear reporting, transparency and comparability permits the most vocal charter pundits to continue advancing utterly ridiculous arguments about their supposed massive, persistent resource disadvantage.

Thus, they (charter pundits) perpetuate the myth that charters everywhere and always are disadvantaged in terms of resources access – and specifically by the design of state funding systems.  Some indeed are, but others clearly are not. Thus, they position themselves to lobby fiercely for their supposed “fair share” of public resources. These arguments are most often anchored to the completely bogus Ball State/Public Impact study of charter school funding (see explanation of Bogosity here![1])

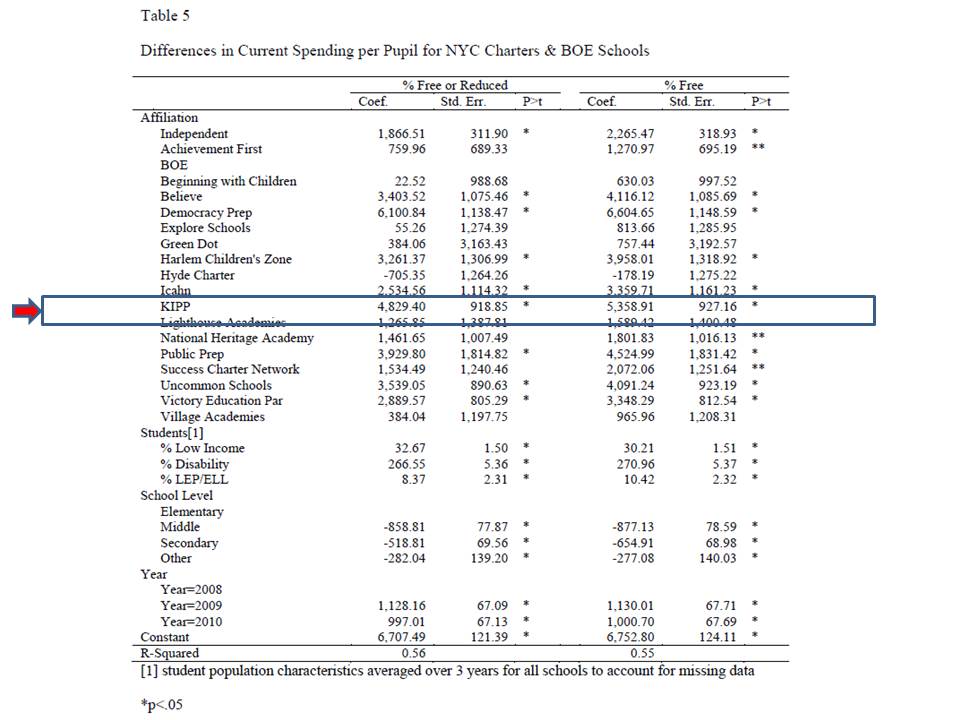
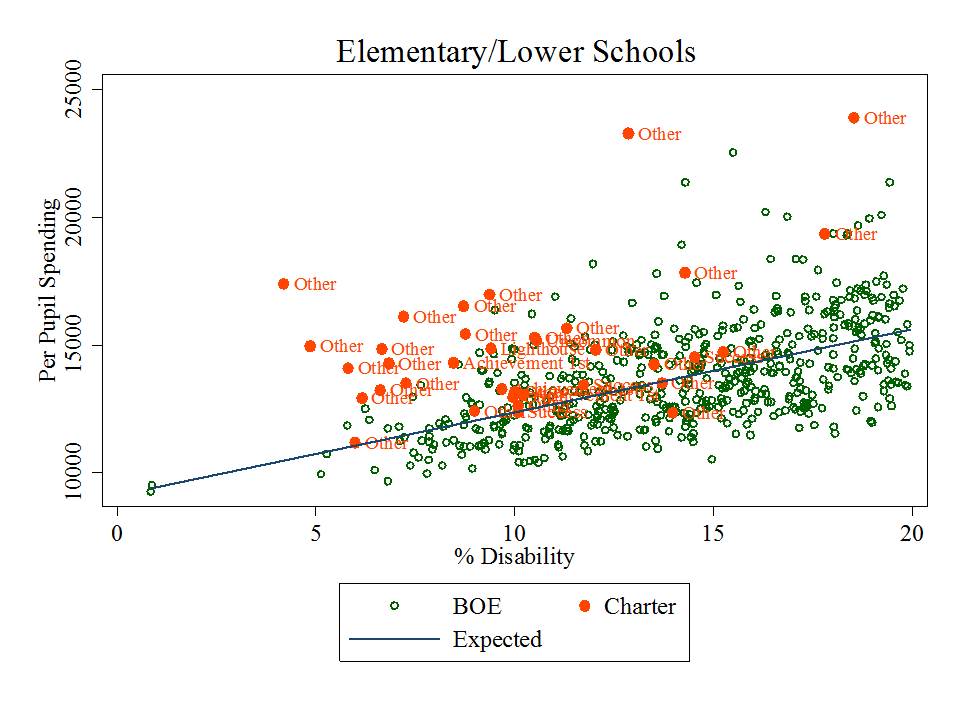
My recent report, and forthcoming article with expanded analyses, on New York City charter schools shows that most substantially outspend NYC BOE schools serving similar student populations and the same grade levels.  Figure 3 shows the scatterplot of middle schools by special education population share (where special education population is the strongest predictor of school site spending differences for NYC BOE schools).

Figure 3. Site Based Spending and % Special Education in NYC Middle Schools

Slide3

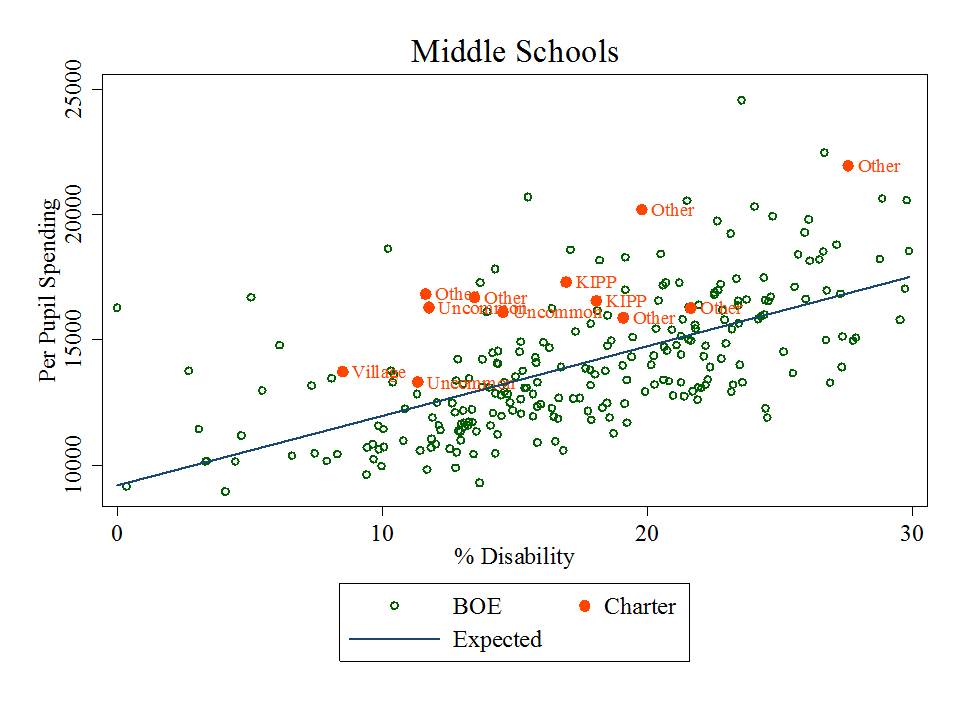
Figure 4 shows the elementary schools.

Figure 4. Site Based Spending and % Special Education in NYC Elementary Schools

Slide4

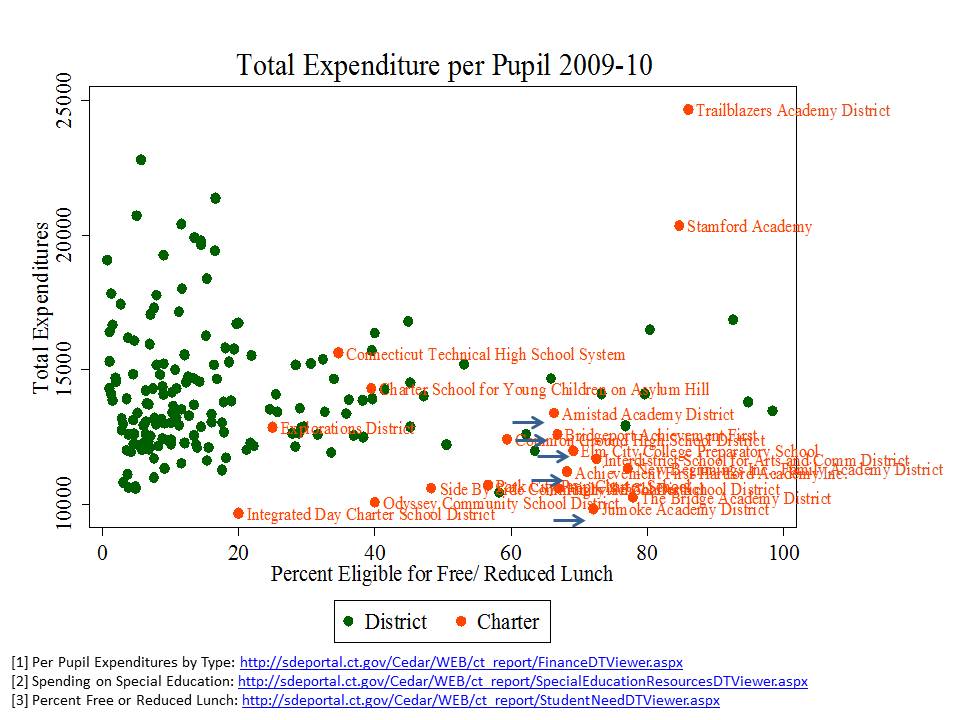
Figure 5 shows the total expenditures per pupil for Connecticut district and Charter schools. It would appear from Figure 5 that charter schools are getting the short end of the stick? Right? Especially those high flying charters like Amistad and Achievement First in Bridgeport? The problem with this comparison is that it is the host districts that are responsible for financing transportation costs, and ultimately responsible for serving children with disabilities (including/especially severe disabilities) and the expenditures for transportation and special education (including transportation of charter students) are reported on district expenditures.

Figure 5. Total Expenditures per Pupil for Connecticut District & Charter Schools

Slide9

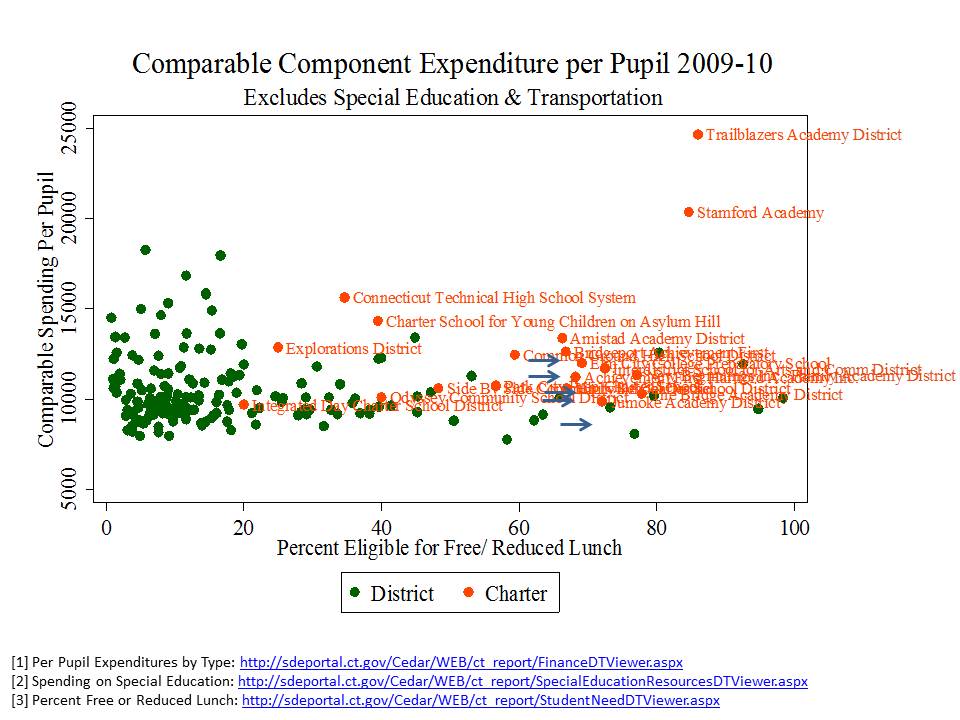
When we pull out transportation and special education spending the picture changes quite substantially as shown in Figure 6. The charter schools are doing reasonable well in comparable expenditures per pupil – setting aside lengthy discussion of chartery misrepresentations of comparisons of facilities costs (the classic charter reactionary argument being that charters in a state like CT spend about $1700 per pupil on facilities, whereas district facilities are supposedly “free.” Even if that was the case, many CT charters would still be ahead. But, district facilities also come with maintenance costs and long term debt payments [which yes, are expenditures] that while not equaling charter lease payments as a share of operating expense, they do close the supposed gap quite substantially – see lengthy note below).

Figure 6. Comparable Expenditures per Pupil for Connecticut District & Charter Schools

Slide10

Collateral Damage of the Parasitic Chartering Model

In previous posts I showed how the population cream-skimming effect necessarily leads to an increasingly disadvantaged student population left behind in district schools. High need, urban districts that are hosts to increasing shares of cream-skimming charters become increasingly disadvantaged over time in terms of the students they must serve.

It would be one thing if state policies were in some way trying to intervene to scale up district resources to mitigate this damage. It would be one thing if we could count on charter advocates/pundits to support public policy that would help local districts deal with these (intended) consequences.

But again, the overarching incentives do not favor such advocacy. Resources are finite, and in the never ending quest to “win” the chartery success wars, it is in the interest of charter advocates to do whatever they can to get the largest share of the resources, and not care so much whether district schools get anything. In fact, it’s easier to win if they don’t.

I was not initially so cynical as to believe that charter advocates would seemingly endorse persistent deprivation of needy traditional districts in their own effort to garner more resources, and “win”. But, increasingly, it seems they are. At the very least, they want what they perceive to be their share, regardless of consequences for district schools. We see this in the persistent drive for access to facilities in New York City, subtle shifts in charter vs. district subsidy rates that appear to advantage the charters (see IBO reports) and the continued flood of philanthropy.

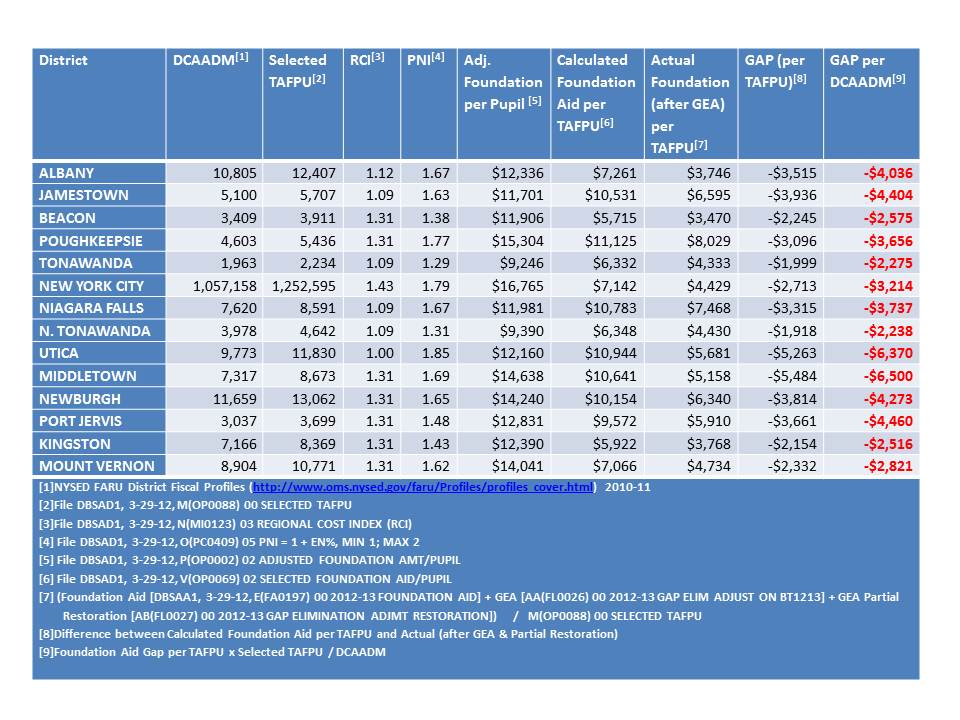
Meanwhile, what is the status of funding for high need districts in New York State? Well, Table 2 summarizes the current degrees of underfunding of New York State’s school finance formula.

Several high need districts are “underfunded” on the state’s own formula by thousands per pupil, including New York City. And where is the outcry from charter advocates that their hosts are being underfunded?

Table 2. Underfunding of New York State’s foundation formula

Slide12

Districts are starting to get fed up. But they still seem to lack the sex appeal (or bank accounts) and media access of leading charter advocates.

Yet, we don’t hear the cry from charter advocates to support the formula. Doing so might actually increase the pass through funds to charters. But, well endowed charters can offset whatever losses they might face by an underfunded formula… and be that much more likely to “win!” Is that really in the public interest? When is the last time you heard a charter advocate argue for fully funded the state aid formula (as opposed to mandating specifically an increase to their allotment of it).

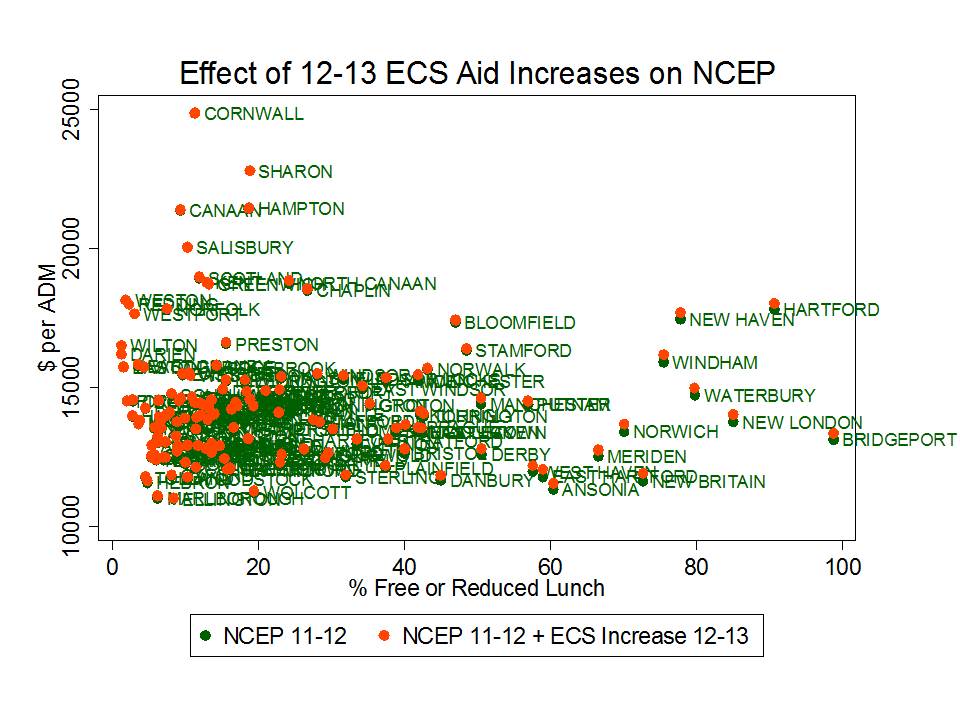
Connecticut provides a similar case of collateral damage. Figure 7 shows the per pupil increases in the Education Cost Sharing formula adopted for the current year, over prior year spending levels. In short, it ain’t much! Okay… it’s actually next to nothing. Persistent inequities exist between higher and lower need districts, and for that matter, among higher need districts (notably, Hartford and New Haven spending in this graph are distorted by magnet school aid, some of which is spent on kids from other districts).

In the same year, the CT legislature did manage to more significantly increase charter school funding (on the order of $2k per pupil), despite the fact that many charter schools were both serving lower need student populations and already spending more per pupil on a comparative basis than their host districts. Why? Well, first of all, it’s a lot cheaper – takes much less total funding increase – to increase funding for just charter kids. Second, that’s where the current punditry is – with charter advocates successfully conveying their (false) message of severe fiscal disadvantage. Pauvre, Pauvre Charter Schools?

Meanwhile, charters like Achievement First in Bridgeport seem more than happy to take their windfall and allow their “competition” (Bridgeport Public Schools) to languish.  It is indeed easier to win that way. And that seems to be what it’s all about.

Figure 7. 2012-13 increases to District Funding in Connecticut

Slide11

Closing Thoughts

It’s quite sad that we’ve reached this stage. As I envisioned it from the outset (or early on, around the late 1990s), it wasn’t supposed to turn out this way. It would, in theory be possible to establish an avenue for creative experimentation, increased flexibility – for appropriately moderated disruptive innovation and cagebusting leadership. It might even all fit into a portfolio model. Yeah… we could use all of the reformy language to describe what might have been a far more reasonable, thoughtful extension of chartering.

But alas, the potential for charters to contribute positively to the public good, in my view, has been severely compromised in part by the ill conceived incentive framework policymakers and pundits have wrapped around the concept of chartering.  Unfortunately, for the foreseeable future it is all too convenient for them to perpetuate this faulty incentive system. Yeah… the public is catching on, and eventually this too shall pass. The only question is just how much damage will have been done before we turn the corner.

[final side bar: Among the damages not discussed herein, but discussed in a previous post, are the increasing shares of students, primarily in urban districts serving low income children and minorities that will be forced to forgo constitutional rights and statutory protections that would be available to them in true public schools, in order to gain access to the only available charter schools. Sadly, many charters have chosen as one method to improve their chance of winning, discipline policies & requirements that would be impermissible in “public” schools (in legalize “state actors”)].

Notes:

[1] Footnote #22  from: http://nepc.colorado.edu/files/rb-charterspending_0.pdf

A study frequently cited by charter advocates, authored by researchers from Ball State University and Public Impact, compared the charter versus traditional public school funding deficits across states, rating states by the extent that they under-subsidize charter schools. The authors identify no state or city where charter schools are fully, equitably funded.

But simple direct comparisons between subsidies for charter schools and public districts can be misleading because public districts may still retain some responsibility for expenditures associated with charters that fall within their district boundaries or that serve students from their district. For example, under many state charter laws, host districts or sending districts retain responsibility for providing transportation services, subsidizing food services, or providing funding for special education services. Revenues provided to host districts to provide these services may show up on host district financial reports, and if the service is financed directly by the host district, the expenditure will also be incurred by the host, not the charter, even though the services are received by charter students.

Drawing simple direct comparisons thus can result in a compounded error: Host districts are credited with an expense on children attending charter schools, but children attending charter schools are not credited to the district enrollment. In a per-pupil spending calculation for the host districts, this may lead to inflating the numerator (district expenditures) while deflating the denominator (pupils served), thus significantly inflating the district’s per pupil spending. Concurrently, the charter expenditure is deflated.

Correct budgeting would reverse those two entries, essentially subtracting the expense from the budget calculated for the district, while adding the in-kind funding to the charter school calculation. Further, in districts like New York City, the city Department of Education incurs the expense for providing facilities to several charters. That is, the City’s budget, not the charter budgets, incur another expense that serves only charter students. The Ball State/Public Impact study errs egregiously on all fronts, assuming in each and every case that the revenue reported by charter schools versus traditional public schools provides the same range of services and provides those services exclusively for the students in that sector (district or charter).

Charter advocates often argue that charters are most disadvantaged in financial comparisons because charters must often incur from their annual operating expenses, the expenses associated with leasing facilities space. Indeed it is true that charters are not afforded the ability to levy taxes to carry public debt to finance construction of facilities. But it is incorrect to assume when comparing expenditures that for traditional public schools, facilities are already paid for and have no associated costs, while charter schools must bear the burden of leasing at market rates – essentially and “all versus nothing” comparison. First, public districts do have ongoing maintenance and operations costs of facilities as well as payments on debt incurred for capital investment, including new construction and renovation. Second, charter schools finance their facilities by a variety of mechanisms, with many in New York City operating in space provided by the city, many charters nationwide operating in space fully financed with private philanthropy, and many holding lease agreements for privately or publicly owned facilities.

New York City is not alone it its choice to provide full facilities support for some charter school operators (http://www.thenotebook.org/blog/124517/district-cant-say-how-many-millions-its-spending-renaissance-charters). Thus, the common characterization that charter schools front 100% of facilities costs from operating budgets, with no public subsidy, and traditional public school facilities are “free” of any costs, is wrong in nearly every case, and in some cases there exists no facilities cost disadvantage whatsoever for charter operators. Baker and Ferris (2011) point out that while the Ball State/Public Impact Study claims that charter schools in New York State are severely underfunded, the New York City Independent Budget Office (IBO), in more refined analysis focusing only on New York City charters (the majority of charters in the State), points out that charter schools housed within Board of Education facilities are comparably subsidized when compared with traditional public schools (2008-09). In revised analyses, the IBO found that co-located charters (in 2009-10) actually received more than city public schools, while charters housed in private space continued to receive less (after discounting occupancy costs). That is, the funding picture around facilities is more nuanced that is often suggested.

Batdorff, M., Maloney, L., May, J., Doyle, D., & Hassel, B. (2010). Charter School Funding: Inequity Persists. Muncie, IN: Ball State University.

NYC Independent Budget Office (2010, February). Comparing the Level of Public Support: Charter Schools versus Traditional Public Schools. New York: Author, 1.

NYC Independent Budget Office (2011). Charter Schools Housed in the City’s School Buildings get More Public Funding per Student than Traditional Public Schools. New York: Author. Retrieved April 24, 2012, from http://ibo.nyc.ny.us/cgi-park/?p=272.

NYC Independent Budget Office (2011). Comparison of Funding Traditional Schools vs. Charter Schools: Supplement. New York: Author .Retrieved April 24, 2012, from http://www.ibo.nyc.ny.us/iboreports/chartersupplement.pdf.

Note: The average “capital outlay” expenditure of public school districts in 2008-09 was over $2,000 per pupil in New York State, nearly $2,000 per pupil in Texas and about $1,400 per pupil in Ohio. Based on enrollment weighted averages generated from the U.S. Census Bureau’s Fiscal Survey of Local Governments, Elementary and Secondary School Finances 2008-09 (variable tcapout): http://www2.census.gov/govs/school/elsec09t.xls

Dismantling Public Accountability & Transparency in the Name of Accountability & Transparency?

This post comes about as a follow up to a previous post where I critiqued the rationale of the Students First policy agenda.  It should be noted that the Students First policy agenda is anything but unique. Like DFER, SFER, ALEC or any policy advocacy organization, the SF policy agenda is little more than an aggregation of largely non-original, template policy prescriptions.

Now, I’m not one who goes all in for the lingo of “corporate reform” or one who perceives “privatization” or “market” mechanisms to be inherently evil and contrary to the public good. However, I am someone who believes we should consider carefully the multitude of tradeoffs involved in shifting between publicness and privateness in the governance and provision of schooling.

What I have found most intriguing over time is that the central messaging of these reformy template policy prescriptions is that they will necessarily improve accountability and transparency of education systems, and that they will do so largely by improving the responsiveness of those intractable systems through altered governance and finance, including but not limited to “market” based choice mechanisms.

The standard list of strategies that are supposedly designed to increase accountability and transparency of our education system include, among other things:

  1. Expansion of charter schools, coupled with multiple charter authorizers (including private entities) and minimized charter regulation
  2. Adoption of tuition tax credit programs providing individuals and corporations the option to forgo paying a portion of taxes by contributing that amount to a privately governed entity (or entities) that manages tuition scholarships to privately governed/managed schools.
  3. Parent trigger policies that permit a simple majority of parents of children currently attending any school within a district to mandate that the local board of education displace the entire staff of the school and potentially turn over governance and management of school’s operations (and physical/capital assets?) to a private management company to be operated as a charter school.

It is argued that current large bureaucratic public education systems are simply intractable, non-responsive and can’t be improved – That they are simply not accountable to anyone because they are run by corrupt self-interested public officials elected by less than 2% of eligible voters (turnout for board elections) and that they have no incentive to be responsive because they are guaranteed a constantly growing pot of revenue regardless of performance/quality/responsiveness.

Whatever problems do exist with the design of our public bureaucracies, I would argue that we should exercise extreme caution in accepting uncritically the belief that we could not possibly do worse, and that large scale privatization and contracting of private entities to provide the public good is necessarily a better and more responsive, more efficient, transparent and accountable option.

Let’s take a walk-through of some of the key aspects of current preferred reforms by comparison to traditional public governance of our education systems.

Privately Governed/Managed Charter Schools vs. Local Education Agencies

Let’s begin with the push for less regulated, expansion of charter schooling with particular emphasis on expansion of privately governed and managed charter schools, and perhaps even charter schools authorized by independent private authorizers (granted authority to operate by a private entity given that authority by the state).  To be absolutely clear, no-matter how many reformy pundits proclaim from their soapbox that Charter Schools are PUBLIC Schools… it just isn’t that simple.  In many critically important ways, under many critically important conditions Charter Schools SIMPLY ARE NOT PUBLIC in every important traditional or legal sense!  See this post for further elaboration!

Note – this varies widely from state to state, depending on whether state charter statutes specifically spell out requirements of privately governed charter schools. 

Let’s explore how/why this might be important when it comes to evaluating whether and how expanded, less regulated chartering either increases or decreases public accountability.

Table 1. Chartering vs. Traditional District Schooling

Dimension Local Education Agency Privately Governed Charter (Non-State Actor)
Governance Governed by public officials (with all rights & immunities)Elected or appointedNecessarily subject to open public records & open meetings lawsNecessarily required to comply with public bidding requirementsNecessarily required to disclose publicly employee contracts Governed by appointed (self-appointed) board of private citizensMay not be subject to open records or meetings lawsMay not be required to engage in public contract/bidding requirementsPrivate appointed board may hire private management firm
Finance Required to disclose finances (reported relatively consistently in most state data systems, including detailed AFRs (annual financial reports) & public posting of budgets) Usually required to report expenditure of public funding. State data systems spotty and inconsistent on charter school revenue/spending data (may be required to disclose IRS filings [form 990])
Disclosure Public officials subject to open meetings laws.All documents/employee contracts/financial documents & communications between officials subject to open records laws. Board members & managers may not be subject to open meetings. Many documents/contracts with private manager, etc. considered private/proprietary.
Employees Public employees with key constitutional and statutory protections Private employees, forgoing certain rights to bring legal challenges against their employer
Students Retain rights to not have their government (school) infringe on various constitutional and statutory rights, and to uphold key statutory obligations. Students may forgo numerous rights under privately governed discipline codes.

These differences are not trivial, yet few are discussing them as critical factors for shaping future education policy. Rather, day after day, week after week, we are subjected to more and more vacuous punditry by self-proclaimed “expert” pundits displaying an astounding ignorance of education law and callous disregard for our system of government and the U.S. Constitution.

For example, it would appear that charter schools that are not “state actors” (which may include most that are governed by boards of private citizens and especially those managed by private companies/EMOs or CMOs) may require students to abide by disciplinary/conduct codes which involve compelling those students to recite belief statements about the school (mottos, pledges, loyalty oaths), obligatory participation in indoctrination activities and imposition of financial penalties for disciplinary infractions, none of which would be permissible in traditional public schools. Government entities – state actors – may not compel speech and especially may not compel statements of belief.

So then, what is a family to do when no traditional public schools are available to them (as is practically the case in many areas of New Orleans and increasingly the case in other higher charter market share cities)? Should parents have to choose which rights to forgo? [picking the school with the financial penalties over the one requiring daily recitation of a loyalty oath?]

Can (as some belligerent civic illiterate,  pundits believe) entire urban school systems be replaced with charter schools – or the traditional public schools adopt the lessons of “chartering” which involve infringement of constitutional rights? Is it reasonable to assume that the entire student population of a city would be placed in a position of necessarily forgoing their rights to free expression, free exercise?

I hear those reformy pundits cry… “but who cares about a little constitutional protection here and there if we can squeeze out an extra point or two on state assessments [via selective attrition of low performing peers]? They’ll be better for it in the long run!”

Yeah… sure… that’s all well and good for someone else’s kids. I for one believe the constitution continues to have a purpose and that constitutional rights should be equally available to all people’s children. I believe that constitutional protections are a key element of an accountable education system available to all – not just some.

This is a big freakin’ deal. An important policy trade-off to consider, if you will. This is a critically important tradeoff to consider when adopting policies that expand non-state-actor charter schooling, even if some marginal academic gain can be achieved.

Indeed, under our current public schooling system constitutional battles over free exercise, free speech, discrimination, etc. persist (as any good pro-school-choice libertarian will frequently argue – I, being a former card carrying member in my NH days!). It’s a never ending tension between the preferences of the majority vs. the rights and interests of the minority. Such arguments are often used as the basis for saying that all students/families should simply have the right/option to choose where to attend school – where they can each be their own majority.  The value of our current public (gov’m’nt) system is that the minority does have the right to challenge their mistreatment and that collective participation in the public system forces public debate over these issues (even if/when they end up being handled poorly). It ain’t perfect, but I’m not willing to replace it with a system that requires large numbers of children to forgo these rights in order to participate in schooling.

Poor and minority children should not be disproportionately required to forgo constitutional protections (and a variety of statutory protections) to gain access to those few additional test score points. Further, no-one is telling them that they even have rights to begin with – especially those pitching the charter expansion policies (constantly spewing the rhetoric of the “publicness” of charter schooling).

Charter Schooling & The Market for Lemons

In theory, the accountability and efficiency advantage of charter schooling is driven by the market for choice of one school over another. Increasingly, state education agencies have moved from being impartial technical assistance agencies and accountability reporting agencies to strongly promoting the charter sector. This advocacy behavior corrupts the state agency role and creates what economists refer to as an “asymmetry of information” – in the extreme case a “market for lemons.”

Markets fail when the consumer is misled to believe that the product they are being sold is a miracle product (without counterbalancing information available to the “customer”). Asymmetry of information occurs where the seller has more information on the quality of the product than the buyer and is able to extract from the buyer a higher price than is warranted given the product’s true quality. In this case, we are talking about the parents’ choice to apply their child’s gov’t subsidized education credit, per se, at a charter versus the traditional public school.  They’ve got one credit to spend for each child and the SEA endorsed spin these days is that that credit is nearly always best spent in a charter school (even when it clearly is not).

Taken to the extremes, State Education Agency and public media flaunting of chartery miracles has created a distorted market for those charters that are least proven on the market (perhaps in some cases, lemons), with those charters that are most proven already over-subscribed and not needing to compete openly. So, those most available on the market are those whose actual performance/quality is far lower than that which is capturing the headlines and receiving accolades from state officials. [not quite a true market for lemons since the price – education “credit” is fixed … though perhaps I can expand on this at a later point].

It is the absurd punditry, intentional obfuscation and complete disregard for legitimate data/analysis on charter schooling that have perhaps soured my taste for the movement more than anything else (bearing in mind that I was a founding member of the AERA special interest group on Charter School research and, at the time, was largely an advocate myself).

Tuition Tax Credits & Vouchers vs. Conventional LEA Governance

Next up, let’s talk about tuition tax credits and vouchers. Now, I would argue that in many ways, tuition tax credits and vouchers which provide the option for children to attend schools that are well understood to be private, that not state actors are at least more honest with respect to student and employee rights.

It is understood (or should be more clearly understood) that when choosing a private school or choosing to be employed by a private employer that one’s rights may differ. On very few occasions have I actually heard the rather absurd argument that private schools receiving students on publicly financed scholarships are “public” (yes, they did, without understanding the implications, make this claim in Louisiana when their voucher model was overturned by the state courts).

Now, let’s parse the governance and accountability differences between traditional public LEAs, Vouchers and Tuition Tax Credits.

Table 2. Vouchers & Tuition Tax Credits vs. Traditional District Schooling

Element LEA Voucher Tuition Tax Credit
Revenue Raising Raises local tax revenue (subject to local voter approval) & receives state aid (through legislation/formula adopted by state elected officials) Permits/requires the transfer of a set per pupil amount of funding from state and/or state/local sources to pay for private school tuition of students Permits corporations to pay funds to a privately governed, state approved/created/appointed entity (school tuition organization) in lieu of paying taxes.
Governance

(records/

meetings)

Required to disclose minutes of meetings and related documents pertaining to budget, financial report and any/all contractual agreements. Assuming voucher program governed by local or state board/public officials, related requirements apply. Entity governed by appointed private citizens, not public officials.  (thus, may not be required to disclose records, open meetings)
Disclosure Required to report/disclose annual budget (for approval by either/both local elected officials and/or local voters)Required to report/disclose annual financial report (usually with independent external audits) Financial disclosure of funds expended (from public agency) on vouchers subject to all public expenditure laws [that is, total allocated to vouchers from budget]Voucher receiving schools not likely required to provide detailed disclosure (non-religious non-profit pvts file with IRS, religious privates not required) May/may not be subject to disclosure requirements of public officials.If non-religious, organized as non-profit, may be required to report limited finances to IRS.
Use of Funds Expended directly by publicly governed entities (public officials) Comingled with all other operating funds of private school entity Comingled with all other operating funds of private school entity
Governance of Schools Publicly governed Private once $ reaches school Private once $ collected to tuition organization
Student/

Employee Rights

Public Private, not state actor Private, not state actor
Taxpayer/

Public Rights

Right to political participation (electing officials, etc.)Right to bring limited legal challenges regarding use of funds

Right to request disclosure

Right to bring limited legal challenges regarding use of funds Limited state legislative options (can try to vote in new legislators)[taxpayers lose right to challenge objectionable use of funds because the funds are not considered tax dollars]

The simple part here is that under either the tuition tax credit or voucher program, the schools that children attend are clearly private. It is (or at least should be) understood that students and employees forgo certain rights. As such, it would be plainly illogical to use such a model as the model for an entire city or state, meaning that children would not even have the option of attending a school where they are protected from discrimination and other forms oppression. [notably, while children/families may be oppressed and/or discriminated against by the ruling “majority” in a public school setting, they have a constitutional right to challenge their mistreatment – a right that ceases to exist where only private providers are available].

Other more nuanced delineations here are between the voucher and the tuition tax credit model. The more popular TTC approach is far more convoluted, and in being so, creates additional layers of opaque to non-existent accountability, ultimately negating altogether taxpayer legal rights.

Under a voucher model, like the Cleveland voucher model, taxpayers do have the right to challenge that their tax dollars are being allocated to religious education. Indeed, when such a challenge was brought, the U.S. Supreme Court decided that the voucher mechanism in place was sufficiently neutral (reliant on parental choice) that it did not violate the establishment clause of the U.S. Constitution. But, taxpayers at least had the right to bring this challenge even if they did lose.

What I find most objectionable (in terms of public accountability) about the TTC approach is that when a similar challenge was brought against the Arizona tuition tax credit model, the U.S. Supreme Court determined that the dollars being expended effectively weren’t the taxpayers’ dollars and thus the taxpayer had no right to bring a legal challenge to the policy (no taxpayer “standing”). Quite simply no taxpayer standing means NO taxpayer legal accountability. No taxpayer legal recourse. Arguing that TTC models increase public accountability is absurd.

Further, that these systems rely on creating non-public, non-publicly accountable entities to manage these funds diverted from the public coffers further reduces public accountability.

Parent Trigger vs. Conventional Local Education Agency Governance

Parent trigger is quite possibly the most ludicrous corruption of public governance and accountability on the education reformy education policy table.  Put simply, parent trigger is the most ill-conceived subversion of governance I’ve seen out there in the reformy playbook. Let’s give it a walk-through.

Table 3. Parent Trigger vs. Traditional District Schooling Governance

Element Traditional LEA Parent Trigger
Primary Control Elected or appointed board of public officials:Public disclosure requirements as addressed above Permits simple majority of parents of children currently attending any school within an LEA to require that the LEA change the management/operations of that school, to include transfer of governance to a private entity
Financial Governance Public officials govern annual budget and accumulated assets of LEA in accordance with public budgeting and finance statutesExpenditure of funds and/or transfer of assets subject to public approval & required public disclosure Small minority of district voter population may obligate district to allocate funds to/contract with private provider/charter manager against preferences of elected officials
Public control/accountability “Public approval” applies to all eligible voters whose primary residence lies within the geographic boundaries of the LEA (whose tax dollars support the annual operations and contributed to purchase and/or maintenance of assets)Board elections held on regular cyclesBudget approval may also require public vote and held on regular election cycleSpecific requirements apply for incurring municipal bond debt for capital investment Provides no recourse for property owners/taxpayers who have no children currently attending the schoolProvides no recourse for parents of children who would be attending the school in future years, until the point at which they would attendMay or may not occur on defined timeline – specific election cycle
Student/teacher rights Student and teacher constitutional and statutory rights as addressed above Students and employees forgo constitutional/statutory rights if converted to privately governed/managed school


The most substantive reductions of public accountability, transparency and governance occur when the simple majority of parents of children in one school decide that there school must be converted to a privately managed charter school, which may in turn adopt policies that deprive both children and employees of constitutional and statutory rights. Indeed, the district would likely be required to find a school for the displaced minority of students who don’t wish to forgo these rights. But the simple majority of parents in that school at that point in time should not be granted the authority to displace a minority of students in their school. Further, a simple majority of parents in a school in a district should not be granted the authority to dictate local board funding or contracting policies without input of the broader eligible voter population.

Among other things, Parent Trigger policies assume that the public at large who reside and own property within a school district have no stake in the accountability of that school system. School closures, school quality, school location, etc. affect the value of residential properties by affecting quality of neighborhood life. Quite likely (an open empirical question) conversion to exclusive and/or specifically themed charter schools creates unique effects on property values and neighborhood quality of life, and not necessarily always positive effects.

Finally, schools/school buildings and property are public assets having a lifespan far exceeding that brief moment in time when that trigger pulling simple majority has children attending the school and the public that has invested in those schools over time should thus have some say in their operation, maintenance and management.

The idea that this particular subversion of traditional governance somehow heightens public accountability is simply ridiculous.

Closing Thoughts

Love it or hate it, we’ve got a pretty well defined, reasonably functional system of public governance in this country, with the overarching rule of the land being our U.S. Constitution. I’m not trying to oversell here. I’m not saying it’s perfect, always responsive to all and never intractable, opaque or corrupt. But I am saying that we could certainly do worse and many proposals on the table are likely to do just that.

Importantly, state laws might be written to close many of the gaping holes in student and employee rights identified above, public disclosure requirements and clarify the delineation between publicness and privateness. But the current trend is not necessarily in that direction!

Our current system defines the roles and responsibilities of public officials, holding them to public accountability standards vetted by our federal and state judicial branches for over two centuries. Yeah, I know, many of these reformy pundits would also simply do away with that meddling judicial branch. I for one, think that our courts continue to play a critical role in protecting rights.

Modern education reform efforts, in the name of supposed increased accountability and transparency largely seek to subvert our system of government as we know it and in many cases seek to strip large shares of poor and minority children and the employees in schools of poor and minority children of constitutional protections. And we’re all supposed to be okay with that?

The Efficiency Smokescreen, “Cuts Cause no Harm” Argument & The 3 Kansas Judges who Saw Right Through It!

State school finance litigation is a tedious – often annoying –politically charged process.  Often, school finance litigation involves extensive debate over tedious statistical and other details underlying estimates of how much is should cost for states to meet their constitutional obligations. Too often, it seems, these debates over tedious statistical details serve to distract the conversation from broader principles of plainly logical fair treatment for kids.

In these cases, states continue to vigorously defend their right to fund – or not – schools as they see fit… when they see fit…. whether or not they see fit.  A relatively consistent pool of experts continue to advise states on strategies for their defense. These strategies have evolved somewhat over time.  For many years, the central “expert” strategy was simply to argue that there’s no proof that adding more money would matter anyway because there is no systematic relationship between funding and outcomes. Of course, this argument fails to excuse the facial inequity of permitting some children in some districts to have twice or more, the resources of others. But, defense experts have certainly extended the money doesn’t matter argument to support the contention that because money is inconsequential, so too are these inequities.

More nuanced versions of these arguments have emerged in recent years.  Bringing “efficiency” arguments into the debate, defense experts have taken to helping states build their central theory on the argument that all districts have more than enough money, even those with the least, and that if they simply used that money in the most efficient way, we could see that it is more than adequate. The extension of this argument is that therefore, even cutting funding to these schools would not cause harm and does not compromise the adequacy of their funding, if they take advantage of these cuts to improve efficiency.  This argument is then coupled with challenges to any and all attempts to estimate the “cost” of producing adequate outcomes based on existing practices of school districts – because existing practices are inefficient practices.  This is a nuanced and complex argument and one that I’ve addressed previously in academic writing and in this blog.

As I’ve stated previously:

Importantly, cost model estimates are estimates based on the actual production technologies of schooling. They are based on the outcomes schools and/or districts produce under different circumstances, for different children – the actual children they serve, based on the actual assessments given, and based on the real conditions under which children attend school. Some critics of education cost analysis in general, and cost function modeling in particular assert that all local public school districts are simply inefficient, mainly because they pay their personnel based on parameters not associated with improved student outcomes.[1] Therefore, they assert that it is useless to consider the spending practices of current districts when trying to determine how much needs to be spent to achieve desired outcomes. A common version of this argument goes that if schools/districts paid teachers based on test scores they produce and if schools/districts systematically dismissed ineffective teachers, productivity would increase dramatically and spending would decline. Thus, educational adequacy could be achieved at much lower cost, and therefore, estimating costs based on current conditions/practices is a meaningless endeavor.[2],[3]

The most significant problem with this logic is that there exists absolutely no empirical evidence to support it! It is entirely speculative, frequently based on the assertions that teacher workforce quality can be improved with no increase to average wages, simply by firing the bottom 5% each year and paying the rest based on the student test scores they produce.  To return to the car purchasing analogy above, this is like assuming that somewhere out there is a car/truck with all the features of the Escalade, but the price of the F-150 – specifically, a version of the Escalade itself produced by a new, yet to be discovered technology with materials not yet invented that allow that vehicle to be sold at less than 1/2 its original price.

In fact, the logical way to test these very assertions would be to permit or encourage some schools/districts to experiment with alternative compensation strategies, and other “reforms,” and to include these schools and districts among those employing other strategies (production technologies) in a cost function model, and see where they land along the curve. That is, do schools/districts that adopt these strategies land in a different location along the curve? Do they get the same outcomes with the same kids at much lower spending? In fact, some schools and districts do experiment with different strategies and those schools carry their relevant share of weight in any statewide cost model.

Pure speculation that some alternative educational delivery system would produce better outcomes at much lower expense is certainly no basis for making a judicial determination regarding constitutionality of existing funding, and is an unlikely (though not unheard of) basis for informing statewide mandates or legislation.  Cost model estimates, as well as recommendations of professional judgment and expert panels can serve to provide useful, meaningful information to guide the formulation of more rational, more equitable and more adequate state school finance systems.

In a Shawnee County District Court decision released on Friday, a three judge panel thoroughly impressed me with their understanding, and eloquent takedown of the efficiency & funding cuts smokescreen.

As the Kansas 3-Judge Panel Framed It: (p. 188)

If “value” is to be a determinative consideration in the evaluation of the costs of providing suitable education, which we concur it must be, then, nevertheless, we would have to believe the State would have some obligation in this proceeding to advance alternative measures that cost less, but which, at least, produce the same sustained effect in producing the “improvement in performance that reflects high academic standards” which now epitomizes the end measure for a “suitable education.” Here, the record is wholly devoid of such alternative approaches, by cost or otherwise, to that goal. Rather, here, the State has effectively asserted that all Kansas K-12 students have reached their apparent maximum and will continue to do so with less money. Here, it is clearly apparent, and, actually, not arguably subject to dispute, that the state’s assertion of a benign consequence of cutting school funding without a factual basis, either quantitatively or qualitatively , to justify the cuts is, but, at best, only based on an inference derived from defendant’s experts that such costs may possibly not produce the best value that can be achieved from the level of spending provided. This is simply not only a weak and factually tenuous premise, but one that seems likely to produce, if accepted, what could not be otherwise than characterized as sanctioning an unconscionable result within the context of the education system. Simply, school opportunities do not repeat themselves and when the opportunity for a formal education passes, then for most, it is most likely gone. We all know that the struggle for an income very often – too often – overcomes the time needed to prepare intellectually for a better one.

If the position advanced here is the State’s full position, it is experimenting with our children which have no recourse from a failure of the experiment.  Here, the legislative experiment with cutting funding has impacted Kansas children’s K-12 opportunity to learn for almost one-third of their k-12 educational experience (2009-10 through 2012-13). Further, given the increased performance results that have accrued after passage of the No Child Left Behind Act and the more focused attention to the increase in standards in the future, the failure to provide full opportunity for learning experiences in our Kansas K-12 school system in the past due to a shortfall in funding is truly sad, however, a continuation of the status quo would only deepen the reflection of opportunities lost. For past students and future students, “all that they can be” was, is currently, and will be, compromised.

See also:

Baker, B. D. (2012). Revisiting the Age-Old Question: Does Money Matter in Education?. Albert Shanker Institute.

Baker, B. D. (2011). Exploring the Sensitivity of Education Costs to Racial Composition of Schools and Race-Neutral Alternative Measures: A Cost Function Application to Missouri. Peabody Journal of Education, 86(1), 58-83.


[1]Hanushek, E. (2005, October). The alchemy of ‘costing out’ and adequate education. Paper presented at the Adequacy Lawsuits: Their Growing Impact on American Education conference, Cambridge, MA. Costrell, R., Hanushek, E., & Loeb, S. (2008). What do cost functions tell us about the cost of an adequate education? Peabody Journal of Education, 83, 198–223.

[2] For elaboration on this argument, see: Costrell, R., Hanushek, E., & Loeb, S. (2008). What do cost functions tell us about the cost of an adequate education? Peabody Journal of Education, 83, 198–223.

[3] An alternative version of this argument is presented by the “efficiency” intervenors in this case. Intervenors’ brief explains: “Therefore, it is literally impossible for the legislature or other current managers of the school system in Texas to take the position, in cost-effective economic terms, that any particular level of funding is necessary for efficiency. Even the question of allocation of funding among districts cannot be determined in an efficient manner without a more substantive and comprehensive system of financial accountability.” http://eduefficiency.org/wp-content/uploads/2012/02/2012-02-22-Plea-in-Intervention.pdf (p. 9) This comment would appear to be a backhanded attempt to undermine any use of analysis of existing spending data for addressing either the overall adequacy of funding to Texas school districts or the equitable distribution of that funding. But this argument suffers the same lack of substantiation that there actually exists some hypothetically more efficient system out there somewhere, and that the current system is necessarily so inefficient as to be irrelevant. The only reasonable basis for  the court to determine education costs in Texas, and how they vary across children and settings is to evaluate those costs in the context of policies as they currently exist, given the actual production of outcomes and average efficiency of schools and districts in producing those outcomes.  Reducing regulations may be a rational alternative, and re-estimating costs after such policy change is also reasonable. If costs of desired outcomes go down after such policy change, then great! But one cannot simply assume that regulatory change (or charter expansion as an approach to regulatory reduction – see Section 5.0) will result in dramatic efficiency gains.

Friday Ratings Madness: Quality Counts, Students First & Funding Fairness

It’s been a fun week for grading the states. First we had the wacky ratings from Students First which graded states largely on the extent to which they had adopted the preferred policies of that organization. Then we had the old-standard Education Week Quality Counts. When it comes to their finance rating system, little has changed in recent years. These two reports, of course, produced substantially conflicting results.

One might argue that both reports and ranking systems, like our School Funding Fairness report, include several indicators intended to identify policy conditions for success. This has been the standard response of Students First when they have been criticized on the basis that the states that they have applauded most tend to have pretty low average outcomes.  But, the Students First report, Quality Counts and our Funding Fairness report differ quite substantially on what we consider to be policy conditions for success. 

Students First has put policy conditions into three categories – 1) elevating the teaching profession, 2) parent empowerment and 3) finance and governance.  Students first gives no consideration across any of these categories to whether teacher wages, for example are sufficient to recruit/retain high quality candidates into teaching or whether wages are specifically competitive in high need schools. Students First gives no consideration to whether funding, overall, is sufficient to provide either/both competitive wages or reasonable class sizes, generally, or specifically in high need schools.  It would appear to be their opinion (as was rather clearly expressed by Eric Lerum in a video conference) that overall level or distribution of funding isn’t the issue – but rather that their preferred policies are what matters, regardless of funding (since the only funding/resource equity considerations in their rankings pertained to whether charter schools received what they consider equal funding – no validation provided!)

Education Week goes old school especially on their school finance rankings. I don’t have time/space to address all of their rankings. As I will show below, some of their old-school measures seem to capture relatively useful information, but others do not. Let’s quickly summarize the measures they use.

  • Fiscal Neutrality: Fiscal neutrality measures the relationship between district spending and district wealth. State school finance formulas are partly intended to disrupt this relationship – reduce the likelihood that wealthier districts spend systematically more. This measure is often still useful, but may be complicated by the fact that school finance formulas also try to address differences in student needs and costs. To the extend that higher need kids live in poorer districts (not always the case that taxable property wealth and student need are tightly associated), this indicator may work to partly capture both.
  • McLoone Index: Named for school finance legend Gene McLoone! This index tells us how close, on average, the per pupil spending of districts in the lower half (serving the lower half of kids) are to the median. That is, to what extent does the state formula succeed in “leveling up” the bottom half to the middle. A McLoone of 100 would mean that the lower half is equal to the middle. But this index in particular can produce some screwy results. Say for example a state has one or a few very large districts with high need populations and those districts constitute both the lower half and the middle (they have nearly or all of the bottom half of kids). A state with one or a handful of high need large districts with spending lower than everyone else (the upper half) might still get a McLoone of 100. But it would be a really crappy school finance system! (with all due respect to Gene!)
  • Coefficient of Variation: The coefficient of variation simply measures the extent of variation in per pupil spending as a percent of the mean per pupil spending. A CV of 10% indicates that 2/3 of children attend districts with per pupil spending within 10% of the mean. The problem with the CV is that, while it measures variation, it doesn’t capture the difference between GOOD variation and BAD variation. Modern state school finance formulas try to create variation in funding to accommodate differences in student needs. Education Week uses nominal weights to “adjust” for differences in student needs, but some state school finance systems actually adjust more aggressively for needs than do their weights. Those states are penalized in the CV.
  • Spending Index & Percent at/Above National Mean: A few reports back Education Week wanted to construct a form of “spending adequacy” figure to compare spending levels across states and the shares of kids with access to what they considered more “adequate” spending. So they adopted this measure and index based on the percent of children in each state who attended districts that spent at least the same as the national average district (spending adjusted for regional wage variation). This figure does generally capture spending level differences across states – adjusted for wage variation – but doesn’t, for example capture spending level differences corrected for student population differences, or the shares of students who might be attending very small, remote rural districts.

Ed week includes a few additional indicators like the restricted range – or difference in spending between the 95th and 5th %ile district, but these are largely redundant with the CV & McLoone and suffer the same problems of not accounting for other cost factors – or state aid formulas that aggressively adjust for needs and costs.

We had set out to correct for many of the problems in the Ed Week approach when we started work  on our Funding Fairness report. Specifically, we wanted to make comparisons that better accounted for differences in needs and costs across districts and states and that could be used to characterize state school finance policies consistently, without suffering some of the problems of old-school indicators like the CV or McLoone Index. We also look at spending level – using a statistical model based on 3 years of data to project the per pupil state and local revenue of a district with a) average poverty rate, b) in an average wage labor market and c) with 2,000 or more students and average population density. That is, our projected state and local revenue figures are adjusted for poverty, competitive wages, size and population density. We use the same model to then evaluate whether, on average – and in a predictable pattern – state and local revenues are systematically higher (progressive) or lower (regressive) in higher poverty districts (relative to lower poverty districts). That is, does the system overall target resources to higher poverty districts – controlling for the other factors.

That prerequisite discussion aside, let’s take a look at how all of this stuff lines up – How the Ed Week Indicators line up with the Funding Fairness Indicators and how both line up with the Students First Indicators. Finally, I look at how all line up with various outcome measures.

Again… all of these funding related indicators are about policy conditions for success, rather than success itself.

First up – and here’s a relative no-brainer – both our funding fairness report and Ed Week Quality Counts include an indicator of state funding effort – or share of state capacity allocated to elementary and secondary education.  I can’t speak for Ed Week, but we include ours to acknowledge that some states spend more than others (do better on our spending level measure) because they can and that we should grade them at least partly on their effort.  Figure 1 shows that our effort measure and Ed Week’s effort measure are pretty highly correlated.

Figure 1

Slide1

Figure 2, by contrast, shows that the Students First funding GPA isn’t related at all with the Ed Weeks effort indicator, and by extension with ours. Ed Week (and we) consider funding effort to be an underlying policy condition for success, apparently, Students First doesn’t .

Figure 2

Slide2

Figure 3 compares our funding level indicator and Education Week’s spending index – or relative adequacy indicator. Clearly the two are highly related… but the Ed Week indicator caps out at 100% – or where 100% of the children attend districts above the national average spending. Personally, I prefer indicators that capture the full range of variation.  But again, our spending level measure and Ed Week’s spending index are picking up much of the same information – relative spending differences across states.

Figure 3

Slide3But, Figure 4 shows that Students First finance rating scheme really doesn’t relate at all to Education Week’s spending index, suggesting that overall availability of resources – like the effort to raise them – is inconsequential in the eyes of Students First.

Figure 4

Slide4Figure 5 shows the relationship between our funding progressiveness indicator and Ed Week’s fiscal neutrality indicator. For many states, the two are picking up similar things. In states like New Jersey or Utah, where higher poverty districts have more resources than lower poverty ones, the systems have also achieved fiscal neutrality (disrupted the relationship between wealth and spending). By contrast, in states like Illinois or North Carolina, the wealth-spending relationship remains strong and positive (higher wealth – higher spending) and higher poverty districts receive systematically fewer resources!

Figure 5

Slide5

Recall that Illinois received one of the best grades on finance from Students First. Apparently, in addition to effort and spending level, fiscal neutrality and need based funding are also inconsequential to Students First when it comes to funding issues. Figure 6 shows the relationship between funding progressiveness and Students Firsts funding related GPA. Note that all of Students First’s funding superstars (Illinois, New York, Rhode Island and Michigan) are less than stellar on funding fairness.

Figure 6

Slide6

Figure 7 relates the Ed Week CV to our funding fairness measure, showing that states with progressive funding distributions including New Jersey, Ohio and Massachusetts are actually penalized by this measure.  The CV does not differentiate between need based variation as occurs in these states and wealth-drive variation as occurs in New Hampshire.  We all seem to agree – Ed Week, Students First and us… that New Hampshire’s funding is…well… not so good!

Figure 7

Slide7

Moving on, here’s the relationship between our funding fairness measure and the McLoone Index! Not much going on here… and but for a few specific examples… it’s actually hard to tell what the McLoone really captures these days in complex state school finance systems. At least it captures that New Hampshire school funding… well… sucks! But other than that, the McLoone really doesn’t capture much valuable additional information regarding equity.

Figure 8

Slide8

So then, how do these various policy conditions for success relate to various outcome measures. In this table and the following graphs I explore that question, using the following outcomes:

  1. Reduction in % below proficient (from http://www.hks.harvard.edu/pepg/PDF/Papers/PEPG12-03_CatchingUp.pdf)
  2. Annual Standardized Gain (NAEP, from http://www.hks.harvard.edu/pepg/PDF/Papers/PEPG12-03_CatchingUp.pdf)
  3. Adjusted (for initial level) Annual Standardized Gain
  4. Reading and Math NAEP 8th Grade 2011
  5. Reading and Math NAEP 8th Grade for Lowest Income Group (Free Lunch) 2011

Table 1 shows the correlations between each of the indicators addressed above and the outcome measures listed above.  Note that each of these correlations a) is relatively modest to non-existent and b) merely represents a relationship whereby when X is higher, so too is Y. Underlying causal relationships involve a complex web of factors including socio-economic and demographic conditions, etc.

Table 1

Slide9

Figure 9 ranks the correlations between policy conditions and reduction in % below proficient at the 8th grade level. Interestingly, variation (inequity – bad and good) in spending is most positively associated with reduction in % below proficient. Beyond that, our funding level indicator and the two funding level indicators from Ed Week are next in line.  Students First’s teaching profession indicator is next… but their funding indicator further down. The figure seems to suggest that higher spending states, even where that spending is unequal, are doing okay on reducing % below proficient – but this is a pattern that can clearly be influenced by regional variation.

Figure 9

Slide10

Figure 10 shows the correlations – ranked high to low – between each policy condition and adjusted standardized gain. In this case, adjusted standardized gains are most highly correlated with our spending level indicator, the Ed Week spending adequacy indicator, and our progressiveness indicator and Ed Week’s neutrality indicator. One might infer from this that more equitable and adequate funding is associated with greater long term average gains on NAEP… but again, regional differences may drive this to an extent. To get an idea of which states have better “adjusted annual gains” see the figure in Appendix A. Higher adjusted gains are states above the trendline and lower adjusted gains are those below the trendline.  Not all states are included (in the graph or correlations) for lack of baseline data year (I may work on updating this with multiple baseline years & tests. This is just a start).


Figure 10

Slide12Finally, we have Figure 11, which compares correlations with the NAEP scores of the lowest income children (which across states were not associated with the average income of the families of those children). These are children in families below the 130% income level for poverty.  As in Figure 9, states with the greatest spending variation seemed to have higher low income NAEP scores. Beyond that however, funding level, effort and wage competitiveness (Teaching Penalty data) seem to be positively correlated with low income NAEP scores. That is, states with higher funding levels, that put up more funding effort, and that have more competitive teacher wages (weekly, relative to non-teachers) have higher low income NAEP scores.

In Figure 11, all of the students first indicators (GPAs) are negatively associated with low income student NAEP scores. That is, low income children are doing much worse in states that got good grades from Students First.  That said, many of the conditions Students First included as setting the state for future success are policies only recently implemented in these states.

Figure 11

Slide13

So that’s it… my run down of the relationship between this week’s state rankings data, how they relate (or not) to our School Funding Fairness Report and how they relate to various outcome measures. I’ll let the rest of you run with it from here! Cheers!

Data Sources:

Students First Report Card

School Funding Fairness

Ed Week Quality Counts (Finance)

Teaching Penalty

Relevant Additional Readings

Appendix A: NAEP Standardized Gains and 1990 Scores

Slide11

Gates Still Doesn’t Get It! Trapped in a World of Circular Reasoning & Flawed Frameworks

Not much time for a thorough review of the most recent release of the Gates MET project, but here are my first cut comments on the major problems with the report. The take home argument of the report seems to be that their proposed teacher evaluation models are sufficiently reliable for prime time use and that the preferred model should include about 33 to 50% test score based statistical modeling of teacher effectiveness coupled with at least two observations on every teacher. They come to this conclusion by analyzing data on 3,000 or so teachers across multiple cities.  They arrive at the 33 to 50% figure, coupled with two observations, by playing a tradeoff game. They find – as one might expect – that prior value added of a teacher is still the best predictor of itself a year later… but that when the weight on observations is increased, the year to year correlation for the overall rating increases (well, sort of). They still find relatively low correlations between value-added ratings for teachers on state tests and ratings for the same teachers with the same kids on higher order tests.

So, what’s wrong with all of this? Here’s my quick run-down:

1. Self-validating Circular Reasoning

I’ve written several previous posts explaining the absurdity of the general framework of this research which assumes that the “true indicator of teacher effectiveness” is the following year value-added score. That is, the validity of all other indicators of teacher effectiveness is measured by their correlation to the following year value added (as well as value-added when estimated to alternative tests – with less emphasis on this). Thus, the researchers find – to no freakin’ surprise – that prior year value added is, among all measures, the best predictor of itself a year later. Wow – that’s a revelation!

As a result, any weighting scheme must include a healthy dose of value-added.  But, because their “strongest” predictor of itself analysis put too much weight on VAM to be politically palatable, they decided to balance the weighting by considering year to year reliability (regardless of validity).

The hypocrisy of their circular validity test is best revealed in this quote from the study:

Teaching is too complex for any single measure of performance to capture it accurately.

But apparently the validity of any/all other measures can be assessed by the correlation with a single measure (VAM itself)!?????

See also:

Evaluating Evaluation Systems

Weak Arguments for Using Weak Indicators

2. Assuming Data Models Used in Practice are of Comparable Quality/Usefulness

I would go so far as to say that it is reckless to assert that the new Gates findings on this relatively select sub-sample of teachers (for whom high quality data were available on all measures over multiple years) have much if any implication for the usefulness of the types of measures and models being implemented across states and districts.

I have discussed the reliability and bias issues in New York City’s relatively rich value-added model on several previous occasions. The NYC model (likely among the “better” VAMs) produces results that are sufficiently noisy from year to year to raise serious questions about their usefulness. Certainly, one should not be making high stakes decisions based heavily on the results of that model. Further, averaging over multiple years means, in many cases, averaging scores that jump from the 30th to 70th percentile and back again.  In such cases, averaging doesn’t clarify, it masks. But what the averaging may be masking is largely noise. Averaging noise is unlikely to reveal a true signal!

Further, as I’ve discussed several times on this blog, many states and districts are implementing methods far more limited than a “high quality” VAM and in some cases states are adopting growth models that don’t attempt – or only marginally attempt – to account for any other factors that may affect student achievement over time.  Even when those models to make some attempts to account for differences in students served, in many cases as in the recent technical report on the model recommended for use in New York State, those models fail! And they fail miserably.  But despite the fact that those models fail so miserably at their central, narrowly specified task (parsing teacher influence on test score gain) policymakers continue to push for their use in making high stakes personnel decisions.

The new Gates findings – while not explicitly endorsing use of “bad” models – arguably embolden this arrogant, wrongheaded behavior!  The report has a responsibility to be clearer as to what constitutes a better and more appropriate model versus what constitutes an entirely inappropriate one.

See also:

Reliability of NYC Value-added

On the stability of being Irreplaceable (NYC data)

Seeking Practical uses of the NYC VAM data

Comments on the NY State Model

If it’s not valid, reliability doesn’t matter so much (SGP & VAM)

3. Continued Preference for the Weighted Components Model

Finally, my biggest issue is that this report and others continue to think about this all wrong. Yes, the information might be useful, but not if forced into a decision matrix or weighting system that requires the data to be used/interpreted with a level of precision or accuracy that simply isn’t there – or worse – where we can’t know if it is.

Allow me to copy and paste one more time the conclusion section of an article I have coming out in late January:

As we have explained herein, value-added measures have severe limitations when attempting even to answer the narrow question of the extent to which a given teacher influences tested student outcomes. Those limitations are sufficiently severe such that it would be foolish to impose on these measures, rigid, overly precise high stakes decision frameworks.  One simply cannot parse point estimates to place teachers into one category versus another and one cannot necessarily assume that any one individual teacher’s estimate is necessarily valid (non-biased).  Further, we have explained how student growth percentile measures being adopted by states for use in teacher evaluation are, on their face, invalid for this particular purpose.  Overly prescriptive, overly rigid teacher evaluation mandates, in our view, are likely to open the floodgates to new litigation over teacher due process rights, despite much of the policy impetus behind these new systems supposedly being reduction of legal hassles involved in terminating ineffective teachers.

This is not to suggest that any and all forms of student assessment data should be considered moot in thoughtful management decision making by school leaders and leadership teams. Rather, that incorrect, inappropriate use of this information is simply wrong – ethically and legally (a lower standard) wrong. We accept the proposition that assessments of student knowledge and skills can provide useful insights both regarding what students know and potentially regarding what they have learned while attending a particular school or class. We are increasingly skeptical regarding the ability of value-added statistical models to parse any specific teacher’s effect on those outcomes. Further, the relative weight in management decision-making placed on any one measure depends on the quality of that measure and likely fluctuates over time and across settings. That is, in some cases, with some teachers and in some years, assessment data may provide leaders and/or peers with more useful insights.  In other cases, it may be quite obvious to informed professionals that the signal provided by the data is simply wrong – not a valid representation of the teacher’s effectiveness.

Arguably, a more reasonable and efficient use of these quantifiable metrics in human resource management might be to use them as a knowingly noisy pre-screening tool to identify where problems might exist across hundreds of classrooms in a large district. Value-added estimates might serve as a first step toward planning which classrooms to observe more frequently. Under such a model, when observations are completed, one might decide that the initial signal provided by the value-added estimate was simply wrong. One might also find that it produced useful insights regarding a teacher’s (or group of teachers’) effectiveness at helping students develop certain tested algebra skills.

School leaders or leadership teams should clearly have the authority to make the case that a teacher is ineffective and that the teacher even if tenured should be dismissed on that basis. It may also be the case that the evidence would actually include data on student outcomes – growth, etc. The key, in our view, is that the leaders making the decision – indicated by their presentation of the evidence – would show that they have used information reasonably to make an informed management decision. Their reasonable interpretation of relevant information would constitute due process, as would their attempts to guide the teacher’s improvement on measures over which the teacher actually had control.

By contrast, due process is violated where administrators/decision makers place blind faith in the quantitative measures, assuming them to be causal and valid (attributable to the teacher) and applying arbitrary and capricious cutoff-points to those measures (performance categories leading to dismissal).   The problem, as we see it, is that some of these new state statutes require these due process violations, even where the informed, thoughtful professional understands full well that she is being forced to make a wrong decision. They require the use of arbitrary and capricious cutoff-scores. They require that decision makers take action based on these measures even against their own informed professional judgment.

See also:

The Toxic Trifecta: Bad Measurement & Evolving Teacher Evaluation Policies

Thoughts on Data, Assessment & Informed Decision Making in Schools