I haven’t revisited the Newark charter school data in a while now. Here are my most recent cuts at the most recent available data:
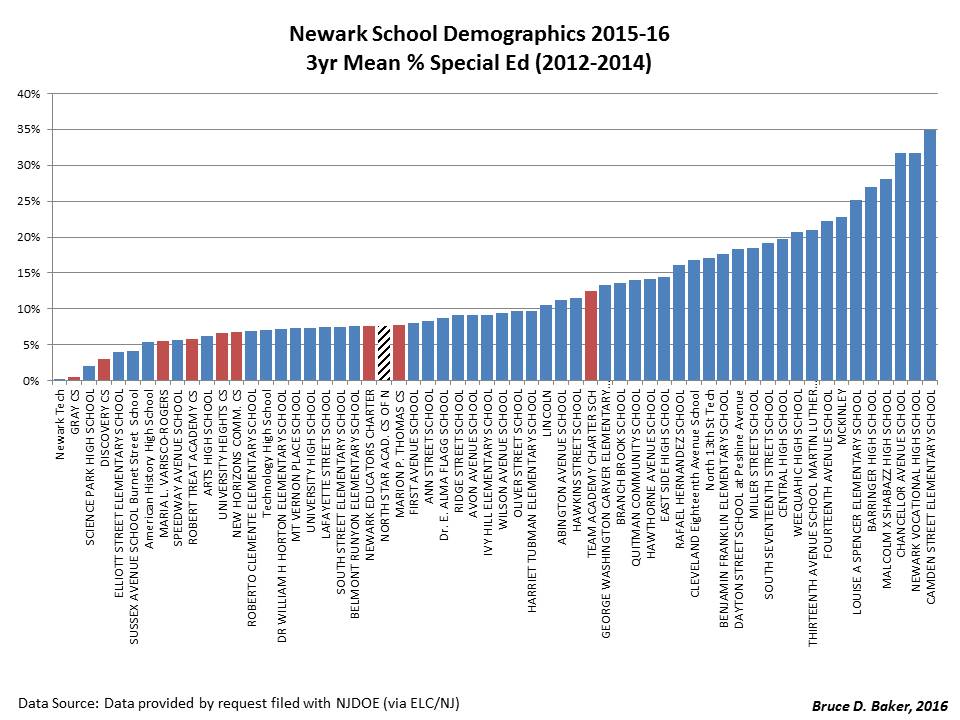
First, DEMOGRAPHICS of District and Charter Schools
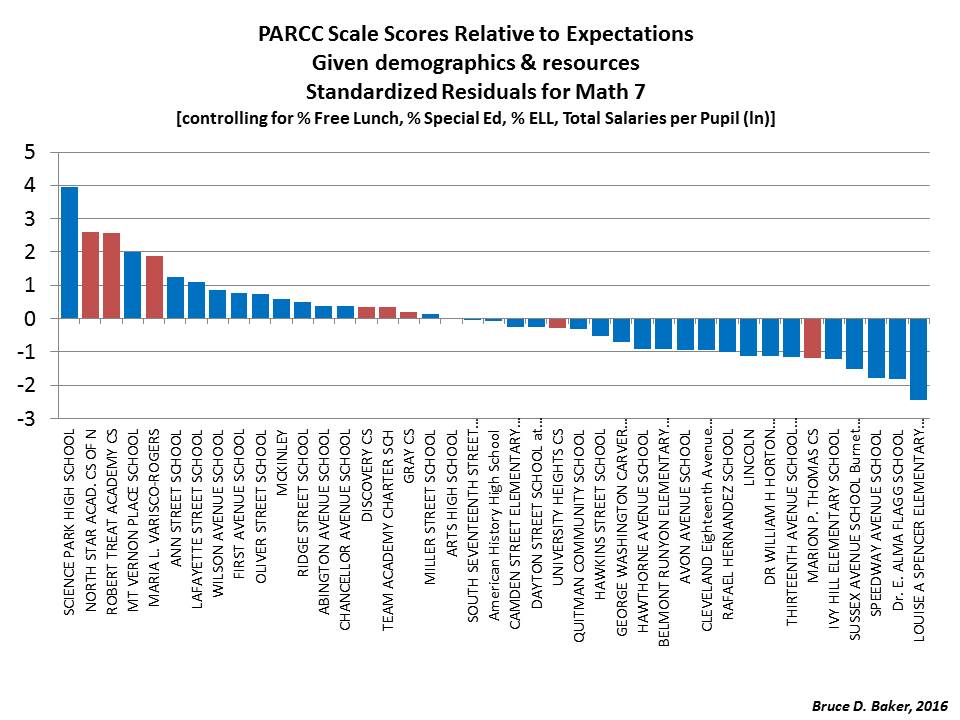
RED bars indicate CHARTER schools. Blue are other Newark Schools. North Star highlighted w/diagonal pattern as it has been the subject of recent twitter/blog fodder/debate.
[reason for focusing on “free lunch” explained here]



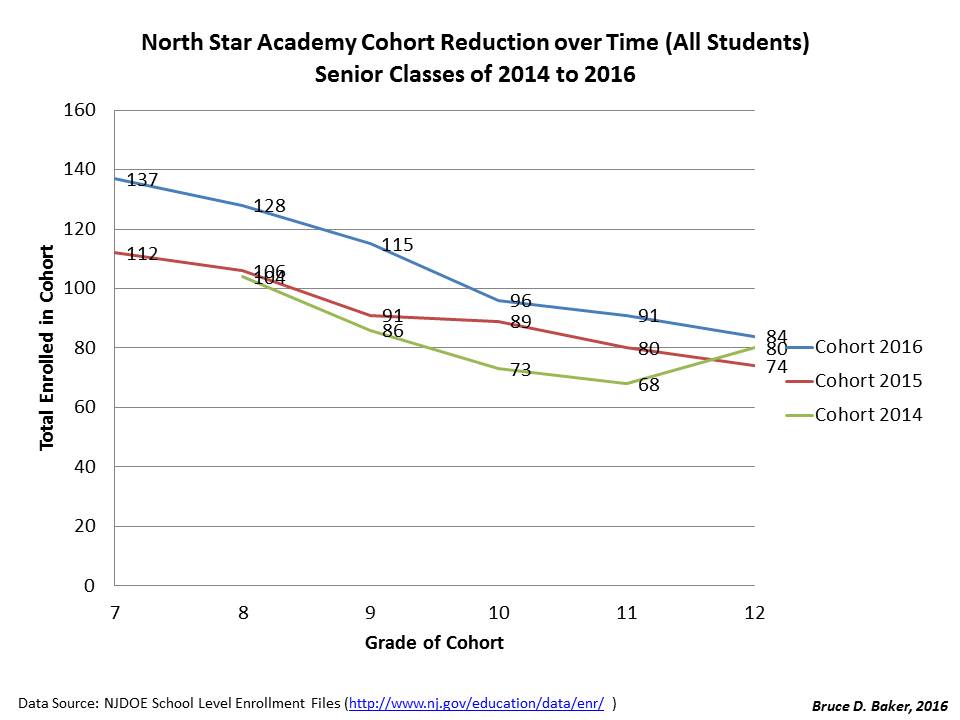
Next, COHORT reduction rates:
Given the reshuffling of students across district regular and special schools, including reorganization during the period, the following is a much clearer comparison than the ones previously posted (aggregating “district” schools):

How, you ask, can a senior cohort exceed in size the 7th graders who started five years prior? Presumably, some of the many, many black boys who started in North Star in particular (but also TEAM) do end up back in NPS district schools.

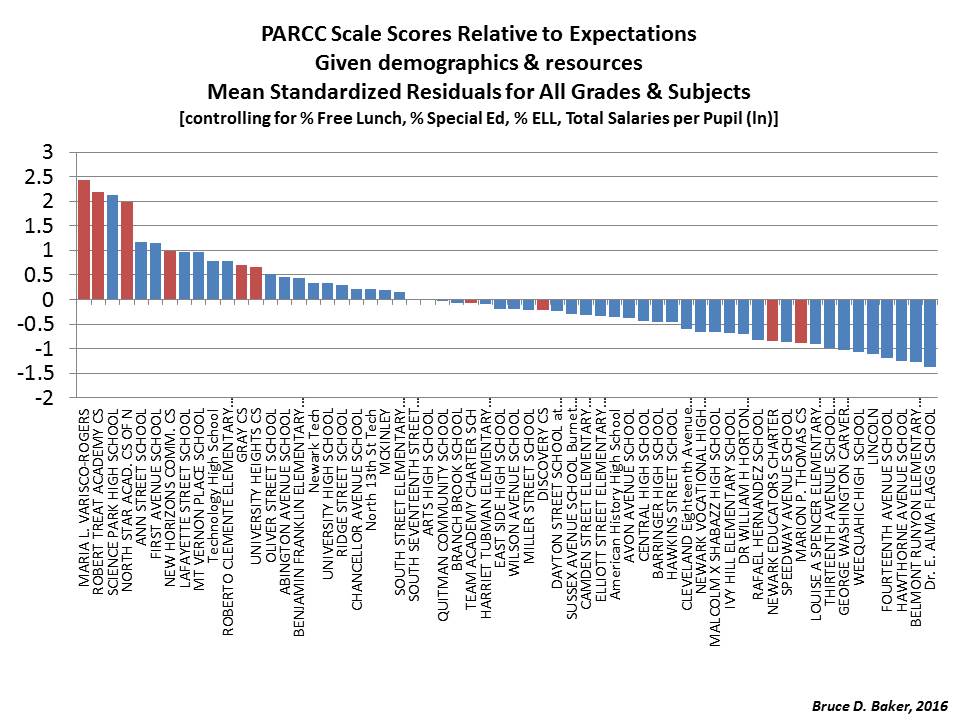
& Finally, some modeled estimates of relative GROWTH and relative PARCC Scale Scores (relative to predicted values) – noting that I a unable to effectively account for high rates of attrition (as in the North Star case specifically).



One thought on “Picture Post Friday: Newark Charter School Data Update”
Comments are closed.