Reformy Platitudes & Fact-Challenged Placards won’t Get Connecticut Schools what they Really Need!

For a short while yesterday – more than I would have liked to – I followed the circus of testimony and tweets about proposed education reform legislation in Connecticut. The reform legislation – SB 24 – includes the usual reformy elements of teacher tenure reform, ending seniority preferences, expanding and promoting charter schooling, etc. etc. etc. And the reformy circus had twitpics of of eager undergrads (SFER) & charter school students (as young as Kindergarten?) shipped in and carrying signs saying CHARTER=PUBLIC (despite a body of case law to the contrary, and repeated arguments, some lost in state courts [oh], by charter operators that they need not comply with open records/meetings laws or disclose employee contracts), and tweeting reformy platitudes and links to stuff they called research supporting the reformy platform (Much of it tweeted as “fact checking” by the ever-so-credible ConnCAN).

Ignored in all of this theatre-of-the-absurd was any actual substantive, knowledgeable conversation about the state of public education in Connecticut, the nature of the CT achievement gap and the more likely causes of it, and other problems/failures of Connecticut education policy.

First, that achievement gap:

Yes, Connecticut has a large achievement gap… among the largest. But, I encourage you to read my previous post in which I explain that poverty achievement gaps in states tend to be mostly a function of income disparity in states. The bigger the income difference between rich and poor, the bigger the achievement gaps between them. But, even then, the CT achievement gap is a problem. CT’s income gaps between poor and  non-poor are most similar to those of MA and NJ, but both MA and NJ do better than CT on achievement gap measures. Here’s a graph relating income gap and achievement gap:

Connecticut has a higher than otherwise expected gap and MA, NJ and RI have lower.

But, is this because of teacher tenure? Is it because teachers aren’t regularly fired because of bad student test scores? Is it because there aren’t enough charter or magnet schools in CT? That’s highly unlikely for several reasons.

First, teachers have tenure status in both higher and lower performing, higher and lower income districts in CT. As I show below, teacher salaries are lower and class sizes larger in disadvantaged districts. SB24 does NOTHING to fix that.

As for highly recognized charter and magnet schools in CT, these schools are actually serving far fewer of the lower income kids within the lower income neighborhoods. So, while they might be doing okay, on average, for the kids they are serving, it is equally likely that they are contributing to the achievement gap as much if not more than helping it. That’s not to say they aren’t helping the students they are serving. But rather that the segregated nature of their services is capitalizing on a peer effect of concentrating more advantaged children. Either way, these schools are unlikely to serve as a broad based solution for CT education quality in general or for resolving achievement gaps.

During this same time period, teachers in NJ and MA also had similar tenure protections and weren’t being tenured or fired based on student test scores. Still somehow, those states had smaller gaps. Further, while both other states do have charter schools, New Jersey which has a much smaller achievement gap than CT has thus far maintained a relatively small charter sector. What Massachusetts and New Jersey have done is to more thoroughly and systematically address school funding disparities.

The Real Disparities:

In a previous series of posts, I discussed what I called Inexcusable Inequalities. I actually used CT as the main example, not because CT is among the worst states on funding inequality, but because I happened to have good data on CT. CT is not among the worst. That special space is reserved for NY, IL, PA and a few others. But CT has its problems. Let’s do a quick walk through. In my previous analysis

I started my previous post by comparing per pupil spending adjusted for needs and costs across all CT school districts with actual outcomes of those districts in order to categorize CT districts into more and less advantaged groups. The differences, starting with the figure below were pretty darn striking. Districts like New Canaan, Westport and Weston have rather high need and cost adjusted spending, certainly by comparison with Bridgeport, New London or New Britain.

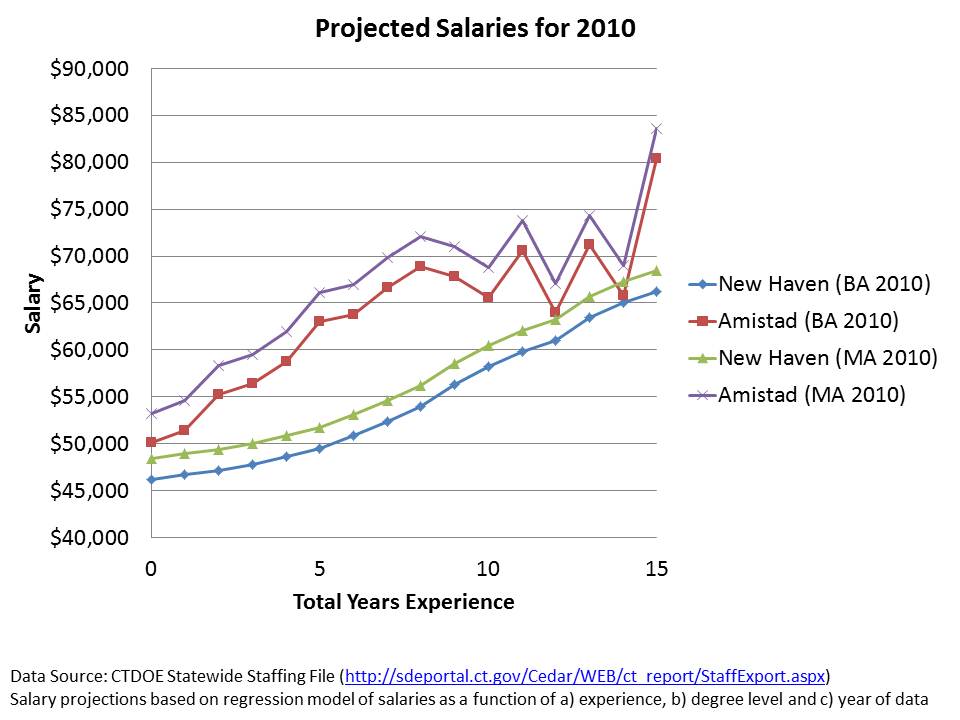
For Illustrative purposes, I then picked a few of the most disadvantaged CT districts and compared them to the most advantaged on a handful of measures – shown below. In this table, I report their nominal spending per pupil – not adjusted for the various needs and additional costs. Even without those adjustments, districts like Bridgeport and New Britain start well behind their more advantaged peers. And among other differences, they pay their teachers less a) on average and b) at any given level of experience or education. Pretty darn hard to recruit and retain quality teachers into these settings given the combination of working conditions and lower pay.

AND MAKING TENURE CONTINGENT ON STUDENT TEST SCORES, OR FIRING TEACHERS BASED ON STUDENT TEST SCORES WON’T FIX THAT! IT WILL FAR MORE LIKELY MAKE IT MUCH, MUCH WORSE!

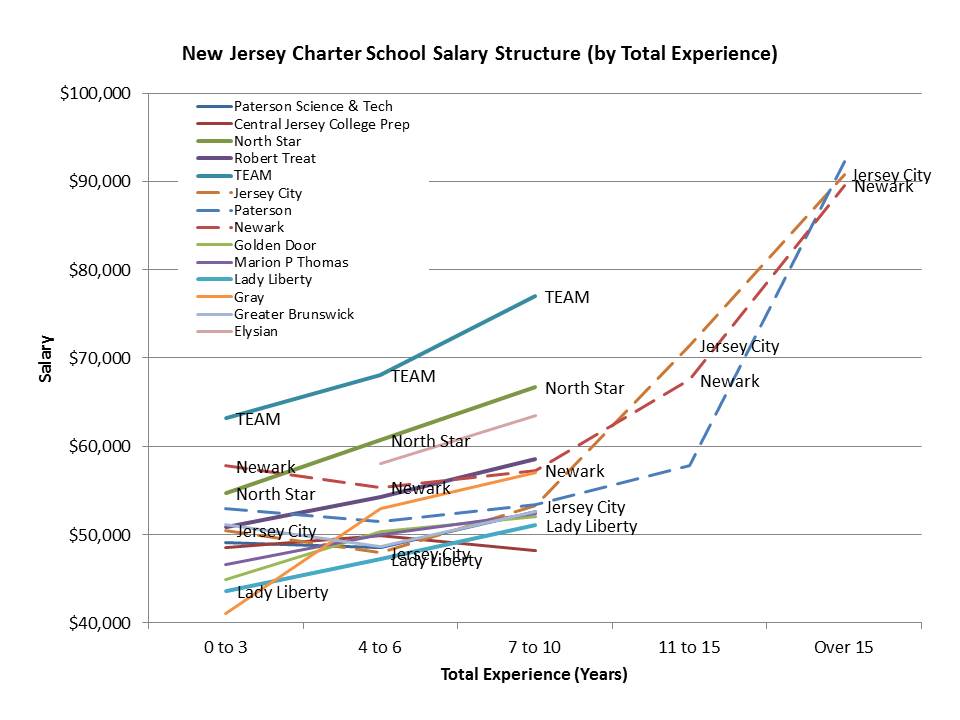
Salary disparity patterns hold when comparing a) all districts in the upper right of the first figure with b) all districts in the lower left, and c) districts furthers in the lower left (severe disparity):

On top of that, class sizes are also larger in the higher need districts, despite the need for smaller class sizes to aid in closing the achievement gaps for these children (more here).

Further, as I showed in my previous post, the funding disparities have significant consequences for the depth and breadth of curricular offerings available to high students in these districts:

For this analysis, I used individual teacher level data on individual course assignments to determine the distribution of teacher assignments per child, thus characterizing each district’s and group of districts’ offerings (for related research, see: https://schoolfinance101.com/wp-content/uploads/2010/01/b-baker-mo_il-resourcealloc-aera2011.pdf)

Disadvantaged districts have far fewer total positions per child, and if we click and blow up the graph, we can see some striking discrepancies! Those high need districts have far more special education and bilingual education teachers (squeezing out other options, from their smaller pot!). Those high need districts have only about half the access to teachers in physical education assignments or art, much less access to Band (little or none to Orchestra), and significantly less access to math teachers!

IN REALLY SIMPLE TERMS, UNDER CT POLICIES, HIGH NEED DISTRICTS SUCH AS BRIDGEPORT AND NEW BRITAIN HAVE FAR FEWER RESOURCES AND FAR GREATER NEEDS. THEIR TEACHERS HAVE LOWER SALARIES AND, ON AVERAGE, LARGER CLASSES.

Messing with teacher evaluation, especially in ways as likely to do harm as to do good, is an unfortunate distraction at best. Doing so on the basis that those are the policy changes needed to close Connecticut’s achievement gap reflects an astounding degree of utter obliviousness!

What about those amazing CT charter and magnet schools? Aren’t they the ultimate scalable solution?

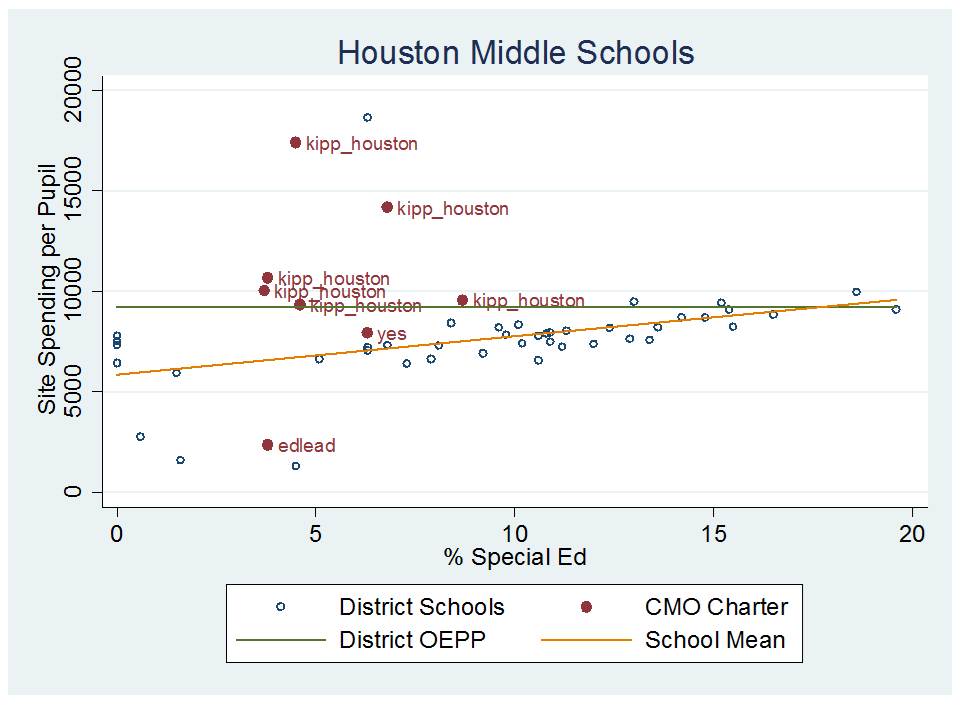
I’ve written much more detail here, about the issue of whether renowned CT charter schools actually “do more, with less while serving the same students.” Here are a few quick graphs. First, Amistad Academy of New Haven in context, by % free lunch:

Next, Capital Prep in Hartford in context. Now, I typically wouldn’t (shouldn’t) have to point out that a small selective magnet program drawing students across district lines is simply NOT REPRESENTATIVE and not likely a scalable solution for all kids.  It’s a potentially good option for those with access, and much of the benefit of the option likely rests in selective peer group effect (as noted above). I feel compelled, however, to point out how Capital Prep is (obviously) not a typical  school only because the head of the school seems to be trying to argue that it is a model scalable reform Really? Really? I mean…. REALLY?):

But what about Governor Malloy’s funding plan? That’ll fix it! Won’t it?

Amidst all of the reformy platitudes, misguided and fact-challenged placards and the like, there were occasional references to Governor Malloy’s changes to the state school finance formula – seemingly implying that the Governor has taken major steps toward making the (supposedly already overfunded) system fairer. There was certainly no outrage expressed at the types of disparities I note above, and all the warm fuzzy feeling anyone could possibly conjure that any finance package tied to the vast batch of reformyness on steriods would be sufficient to get the job done.

After all, new aid would be progressively distributed. Those poor districts would get, on average, about… oh… a whopping new $250 per pupil while richer districts would get only about $50 per pupil. And with this astounding outlay of fiscal effort, the most important thing is to make sure it doesn’t just go straight into the pockets of those union-lacky-lazy-self-interested-teachers, of course – or at least certainly not the “ineffective” ones.

Here are the effects of the Malloy funding increases, on a per pupil basis, if added on to Net Current Expenditures per Pupil (pulling out magnet school aid which creates a distorted representation for New Haven and Hartford):

What we have in this picture is each district as a dot (circle or triangle). Districts are sorted from low to high percent free/reduced lunch along the horizontal axis. Net Current Expenditures are on the vertical axis. Blue Circles represent current (okay, last year) levels of current expenditures per pupil. RED TRIANGLES REPRESENT THE ADDITION OF MALLOY AID. Wow… that’s one heck of a difference. That should certainly fix the disparities I laid out above! NOT!

Here it is with district names added, so you can see where some of our more disadvantaged districts start and end up:

Not that helpful for Bridgeport or New Britain, is it?

To summarize:

The fact is that EQUITABLE AND ADEQUATE FUNDING IS THE NECESSARY UNDERLYING CONDITION FOR IMPROVING EDUCATION QUALITY IN CONNECTICUT AND REDUCING ACHIEVEMENT GAPS!!!!!! (related research: http://www.tcrecord.org/library/content.asp?contentid=16106)

Equitable and adequate funding is a necessary underlying condition for running any quality school, be it a traditional public school, charter school or private school. Money matters and it matters regardless of the type of school we’re talking about.

Equitable and adequate funding is required for recruiting and retaining teachers in Connecticut’s high need, currently under-resourced schools (something charter operators realize). Recruiting and retaining teachers to work in these communities will take more, not less money.

Reformy platitudes (and fact-challenged placards) about tenure reform won’t change that.  And altering the job security landscape to move toward ill-conceived evaluation frameworks and flawed metrics will likely hurt far more than it will help.

It’s time to pack up the reformy circus, load up the buses and shred the placards and have some real, substantive conversations about improving the quality and equality of public schooling in Connecticut.

Borrowing wise words from those truly market-based, Private Independent schools…

Lately it seems that public policy and the reformy rhetoric that drives it are hardly influenced by the vast body of empirical work and insights from leading academic scholars which suggests that such practices as using value-added metrics to rate teacher quality, or dramatically increasing test-based accountability and pushing for common core standards and tests to go with them are unlikely to lead to substantial improvements in education quality, or equity.

Rather than review relevant empirical evidence or provide new empirical illustrations in this post, I’ll do as I’ve done before on this blog and refer to the wisdom and practices of private independent schools – perhaps the most market driven segment and most elite segment of elementary and secondary schooling in the United States.

Really… if running a school like a ‘business’ (or more precisely running a school as we like to pretend that ‘businesses’ are run… even though ‘most’ businesses aren’t really run the way we pretend they are) was such an awesome idea for elementary and secondary schools, wouldn’t we expect to see that our most elite, market oriented schools would be the ones pushing the envelope on such strategies?

If rating teachers based on standardized test scores was such a brilliant revelation for improving the quality of the teacher workforce, if getting rid of tenure and firing more teachers was clearly the road to excellence, and if standardizing our curriculum and designing tests for each and every component of it were really the way forward, we’d expect to see these strategies all over the home pages of web sites of leading private independent schools, and we’d certainly expect to see these issues addressed throughout the pages of journals geared toward innovative school leaders, like Independent School Magazine.  In fact, they must have been talking about this kind of stuff for at least a decade. You know, how and why merit pay for teachers is the obvious answer for enhancing teacher productivity, and why we need more standardization… more tests… in order to improve curricular rigor? 

So, I went back and did a little browsing through recent, and less recent issues of Independent School Magazine and collected the following few words of wisdom:

From Winter 2003, when the school where I used to teach decided to drop Advanced Placement courses:

A little philosophy, first. Independent schools are privileged. We do not have to respond to the whims of the state, nor to every or any educational trend. We can maximize our time attuned to students and how they learn, and to the development of curriculum that enriches them and encourages the skills and attitudes of independent thinkers. Our founding charters and missions established independence for a range of reasons, but they now give all of us relative curricular autonomy, the ability to bring together a faculty of scholars and thinkers who are equipped to develop rich, developmentally sound programs of study. As Fred Calder, the executive director of New York State Association of Independent Schools, wrote in a letter to member schools a few years ago: “If we cannot design our programs according to our best lights and the needs of our communities, then let the monolith prevail and give up the enterprise. Standardized testing in subject areas essentially smothers original thought, more fatally, because of the irresistible pressure on teachers to teach to the tests.”

http://www.nais.org/publications/ismagazinearticle.cfm?ItemNumber=144300

Blasphemy? Or simply good education!

And from way, way back in 2000, in a particularly thoughtful piece on “business” strategies applied to schools:

Educators do not respond to the same incentives as businesspeople and school heads have much less clout than their corporate counterparts to foster improvement. Most teachers want higher salaries but react badly to offers of money for performance. Merit pay, so routine in the corporate world, has a miserable track record in education. It almost never improves outcomes and almost always damages morale, sowing dissension and distrust, for three excellent reasons, among others: (1) teachers are driven to help their own students, not to outperform other teachers, which violates the ethic of service and the norms of collegiality; (2) as artisans engaged in idiosyncratic work with students whose performance can vary due to factors beyond school control, teachers often feel that there is no rational, fair basis for comparison; and (3) in schools where all faculty feel underpaid, offering a special sum to a few sparks intense resentment. At the same time, school leaders have limited leverage over poor performers. Although few independent schools have unionized staff and formal tenure, all are increasingly vulnerable to legal action for wrongful dismissal; it can take a long time and a large expense to dismiss a teacher. Moreover, the cost of firing is often prohibitive in terms of its damage to morale. Given teachers’ desire for security, the personal nature of their work, and their comparative lack of worldliness, the dismissal of a colleague sends shock waves through a faculty, raising anxiety even among the most talented.

http://nais.org/publications/ismagazinearticle.cfm?ItemNumber=144267

Unheard of! Isn’t firing the bad teacher supposed to make all of those (statistically) great teachers feel better about themselves? Improve the profession? [that said, we have little evidence one way or the other]

How can we allow our leading private, independent, market-based schools to promote such gobbledygook? Why do they do it? Are they a threat to our national security or our global economic competitiveness because they were not then, nor are they now (see recent issues: http://www.nais.org/) fast-tracking the latest reformy fads? Testing out the latest and greatest educational improvement strategies on their own students, before those strategies get tested on low income children in overcrowded urban classrooms? Why aren’t the boards of directors of these schools – many of whom are leaders in “business” – demanding that they change their outmoded ways? Why? Why? Why? Because what they are doing works! At least in terms of their success in continuing to attract students and produce successful graduates.

Now, that’s not to say that these schools are completely stagnant, never adopting new strategies or reforms. They do new stuff all the time (technology integration, etc.) – just not the absurd reformy stuff being dumped upon public schools by policymakers who in many cases choose to send their own children to private independent schools.

In my repeated pleas to private school leaders to provide insights into current movements in teacher evaluation and compensation, I’ve actually found little change from these core principles of nearly a decade ago.  Private independent schools don’t just fire at will and fire often and teacher compensation remains very predictable and traditionally structured. I’d love to know, from my private school readers, how many of their schools have adopted state mandated tests?

Private independent schools pride themselves on offering small class sizes   (see also here) and a diverse array of curricular opportunities, as well as arts, sports and other enrichment – the full package.  And, as I’ve shown in my previous research, private independent schools charge tuition and spend on a per pupil basis at levels much higher than traditional public school districts operating in the same labor market. They also pay their headmasters well! More blasphemy indeed.

In fact, aside from “no excuses” charter schools whose innovative programs consist primarily of rigid discipline coupled with longer hours and small group tutoring (not rocket science), and higher teacher salaries (here, here & here) to compensate the additional work, private independent schools may just be among the least reformy elementary and secondary education options out there.

That’s not to say they are anything like “no excuses” charter schools. They are not in many ways. But they are equally non-reformy.  In fact, the average school year in private independent schools is shorter not longer than in traditional public schools – about 165 days.  And the average student load of teachers working in private independent schools (course sections x class size) is much lower in the typical private independent school than in traditional public schools. But that ain’t reformy stuff at all, any more than trying to improve outcomes of low income kids by adding hours and providing tutoring.

None-the-less, for some reason, well educated people with the available resources, keep choosing these non-reformy and expensive schools. Some of these schools have been around for a while too! Maybe, just maybe, it’s because they are doing the right things – providing good, well rounded educational opportunities as many of them have for centuries, adapting along the way (see: http://www.exeter.edu/admissions/109_1220_11688.aspx) .  Perhaps they’ve not gone down the road of substantially increased testing and curriculum standardization, test-based teacher evaluation – firing their way to Finland – because they understand that these policy initiatives offer little to improve school quality, and much potential damage.

Perhaps there are some lessons to be learned from market based systems. But perhaps we should be looking to those market based systems that have successfully provided high quality schooling for centuries to our nation’s most demanding, affluent and well educated leaders, rather than basing our policy proposals on some make-believe highly productive private sector industry where new technologies reduce production costs to near $0 and where complex statistical models are used to annually deselect non-productive employees.

Just pondering the possibilities, and still waiting for Zuck (an Exeter alum) to invest in Harkness Tables for Newark Public Schools and class sizes of 12 across the board!

Productivity continued…updated…

Update

Mark Dynarski has added some additional useful recommendations regarding productivity research. Dynarski’s comments come in response to our suggestions for improving the rigor of productivity research, where our suggestions were based on rigorous application of relevant methods that we would expect to see applied in productivity research.

We agree with Mark Dynarski that using relevant methods alone doesn’t guarantee that they are used well.  We were starting from the position that the work of Roza and Hill doesn’t not apply relevant methods at all, no less well.  That in mind, we concur with Dynarski’s argument that it is not only important to use the right methods, but to use them well, and that reasonable standards may be applied. Here are Mark Dynarski’s suggestions:

Here are some examples of what I had in mind for research standards: the analysis has been replicated by another researcher working independently (replication being a lynchpin of scientific method). Predictions from the analysis have explanatory power outside the sample. The modeling framework is mathematically consistent. The research team has no conflicts of interest.

Applying these standards might result in excluding a lot of current research (even peer-reviewed research), but I think that would be the point Welner and Baker are making.

Readers interest in assessing research might take a look at the National Academy of Sciences’ Reference Manual on Scientific Evidence, now in its third edition, especially the chapter by Kaye and Freedman on statistics. It’s highly readable and available for free download from the academy’s website.

Below is my original reply to Mark Dynarski’s comment:

Over at Sara Mead’s Ed Week blog, Mark Dynarski checks in with a few relevant questions and observations. Actually, as it turns out, we agree ALMOST entirely with Dynarski when he says:

And focusing on peer-reviewed research as a form of quality assurance, as Baker and Welner suggest, seems problematic. Peer-reviewed research journals have highly variable degrees of editorial control, and peer review itself can vary from cursory reading to exhaustive and detailed comments. My own observation is that focusing on research with rigorous designs probably is a superior contributor to quality on average. There never seem to be enough of these when difficult debates on education policy issues arise, though.

Our only disagreement here is with his characterization of what we said. We did not uphold peer review as the gold standard. Though we probably used the phrase – peer review – too often in the brief itself. Rather, we believe just as Dynarski stated, that research with rigorous designs is a superior contributor to quality, on average! Hell yes. Absolutely. That’s our point. At the very least, the issues and questions at hand should be framed, or frame-able in relevant terms for rigorous evaluation.

That is precisely our concern with the Roza/Hill and Roza and other colleagues materials we address in our report (see pages 9 to 14). Further, a large section of our report summarizes the relevant methods – those rigorous and appropriate designs that should be applied to the questions at hand, but are noticeably absent even at the most cursory level in Roza and Hill’s materials.

To save you all the trouble of actually reading our entire brief, I’ve copied and pasted below the section of our brief where we address relevant methods:

Summary of Available Methods

Discussions of educational productivity can and should be grounded in the research knowledge base. Therefore, prior to discussing the Department of Education’s improving productivity project website and recommended resources, we think it important to explain the different approaches that researchers use to examine productivity and efficiency questions. Two general bodies of research methods have been widely used for addressing questions of improving educational efficiency. One broad area includes “cost effectiveness analysis” and “cost-benefit analysis.” The other includes two efficiency approaches: “production efficiency” and “cost efficiency.” Each of these is explained below.

 Cost-Effectiveness Analysis and Cost-Benefit Analysis

In the early 1980s Hank Levin produced the seminal resource on applying cost effectiveness analysis in education (with a second edition in 2001, co-written with Patrick McEwan),[i] helpfully titled “Cost-Effectiveness Analysis: Methods and Applications.” The main value of this resource is as a methodological guide for determining which, among a set of options, are more and less cost effective, which produce greater cost-benefit, or which have greater cost-utility.

The two main types of analyses laid out in Levin and McEwan’s book are cost-effectiveness analysis and cost-benefit analysis, the latter of which can focus on either short-term cost savings or longer term economic benefits. All these approaches require an initial determination of the policy alternatives to be compared. Typically, the baseline alternative is the status quo. The status quo is not a necessarily a bad choice. One embarks on cost-effectiveness or cost-benefit analysis to determine whether one might be able to do better than the status quo, but it is not simply a given that anything one might do is better than what is currently being done. It is indeed almost always possible to spend more and get less with new strategies than with maintaining the current course.

Cost-effectiveness analysis compares policy options on the basis of total costs. More specifically, this approach compares the spending required under specific circumstances to fully implement and maintain each option, while also considering the effects of each option on a common set of measures. In short:

Cost of implementation and maintenance of option A

Estimated outcome effect of implementing and maintaining option A

Compared to

Cost of implementation and maintenance of option B

Estimated outcome effect of implementing and maintaining option B

Multiple options may (and arguably should) be compared, but there must be at least two. Ultimately, the goal is to arrive at a cost-effectiveness index or ratio for each alternative in order to determine which provides the greatest effect for a constant level of spending.

The accuracy of cost-effectiveness analyses is contingent, in part, upon carefully considering all direct and indirect expenditures required for the implementation and maintenance of each option. Imagine, for example, program A, where the school incurs the expenses on all materials and supplies. Parents in program B, in contrast, are expected to incur those expenses. It would be inappropriate to compare the two programs without counting those materials and supplies as expenses for Program B. Yes, it is “cheaper” for the district to implement program A, but the effects of program B are contingent upon the parent expenditure.

Similarly, consider an attempt to examine the cost effectiveness of vouchers set at half the amount allotted to public schools per pupil. Assume, as is generally the case, that the measured outcomes are not significantly different for those students who are given the voucher. Finally, assume that the private school expenditures are the same as those for the comparison public schools, with the difference between the voucher amount and those expenditures being picked up through donations and through supplemental tuition charged to the voucher parents. One cannot claim greater “cost effectiveness” for voucher subsidies in this case, since another party is picking up the difference. One can still argue that this voucher policy is wise, but the argument cannot be one of cost effectiveness.

Note also that the expenditure required to implement program alternatives may vary widely depending on setting or location. Labor costs may vary widely, and availability of appropriately trained staff may also vary, as would the cost of building space and materials. If space requirements are much greater for one alternative, while personnel requirements are greater for the second, it is conceivable that the relative cost effectiveness of the two alternatives could flip when evaluated in urban versus rural settings. There are few one-size-fits-all answers.

Cost-effectiveness analysis also requires having common outcome measures across alternative programs. This is relatively straightforward when comparing educational programs geared toward specific reading or math skills. But policy alternatives rarely focus on precisely the same outcomes. As such, cost-effectiveness analysis may require additional consideration of which outcomes have greater value, which are more preferred than others. Levin and McEwan (2001) discuss these issues in terms of “cost-utility” analyses. For example, assume a cost-effectiveness analysis of two math programs, each of which focuses on two goals: conceptual understanding and more basic skills. Assume also that both require comparable levels of expenditure to implement and maintain and that both yield the same average combined scores of conceptual and basic-skills assessments. Program A, however, produces higher conceptual-understanding scores, while program B produces higher basic-skills scores. If school officials or state policy makers believe conceptual understanding to be more important, a weight might be assigned that favors the program that led to greater conceptual understanding.

In contrast to cost-effectiveness analysis, cost-benefit analysis involves dollar-to-dollar comparisons, both short-term and long-term. That is, instead of examining the estimated educational outcome effect of implementing and maintaining a given option, cost-benefit analysis examines the economic effects. But like cost-efficiency analysis, cost-benefit analysis requires comparing alternatives:

Cost of implementation and maintenance of option A

Estimated economic benefit (or dollar savings) of option A

Compared to

Cost of implementation and maintenance of option B

Estimated economic benefit (or dollar savings) of option B

Again, the baseline option is generally the status quo, which is not assumed automatically to be the worst possible alternative. Cost-benefit analysis can be used to search for immediate, or short-term, cost savings. A school in need of computers might, for example, use this approach in deciding whether to buy or lease them or it may use the approach to decide whether to purchase buses or contract out busing services. For a legitimate comparison, one must assume that the quality of service remains constant. Using these examples, the assumption would be that the quality of busing or computers is equal if purchased, leased or contracted, including service, maintenance and all related issues. All else being equal, if the expenses incurred under one option are lower than under another, that option produces cost savings. As we will demonstrate later, this sort of example applies to a handful of recommendations presented on the Department of Education’s website.

Cost-benefit analysis can also be applied to big-picture education policy questions, such as comparing the costs of implementing major reform strategies such as class-size reduction or early childhood programs versus raising existing teachers’ salaries or measuring the long-term economic benefits of those different programmatic options. This is also referred to as return-on-investment analysis.

While cost-effectiveness and cost-benefit analyses are arguably under-used in education policy research, there are a handful of particularly useful examples:

  1. Determining whether certain comprehensive school reform models are more cost-effective than others?[ii]
  2. Determining whether computer-assisted instruction is more cost-effective than alternatives such as peer tutoring?[iii]
  3. Comparing National Board Certification for teachers to alternatives in terms of estimated effects and costs.[iv]
  4. Cost-benefit analysis has been used to evaluate the long-term benefits, and associated costs, of participation in certain early-childhood programs.[v]

Another useful example is provided by a recent policy brief prepared by economists Brian Jacob and Jonah Rockoff, which provides insights regarding the potential costs and benefits of seemingly mundane organizational changes to the delivery of public education, including (a) changes to school start times for older students, based on research on learning outcomes by time of day; (b) changes in school-grade configurations, based on an increased body of evidence relating grade configurations, location transitions and student outcomes; and (c) more effective management of teacher assignments.[vi] While the authors do not conduct full-blown cost effectiveness or cost-benefit analyses, they do provide guidance on how pilot studies might be conducted.

Efficiency Framework

As explained above, cost-benefit and cost-effectiveness analyses require analysts to isolate specific reform strategies in order to correspondingly isolate and cost the strategies’ components and estimate their effects. In contrast, relative-efficiency analyses focus on the production efficiency or cost efficiency of organizational units (such as schools or districts) as a whole. In the U.S. public education system, there are approximately 100,000 traditional public schools in roughly 15,000 traditional public school districts, plus 5,000 or so charter schools. Accordingly, there is significant and important variation in the ways these schools get things done. The educational status quo thus entails considerable variation in approaches and in quality, as well as in the level and distribution of funding and the population served.

Each organizational unit, be it a public school district, a neighborhood school, a charter school, a private school, or a virtual school, organizes its human resources, material resources, capital resources, programs, and services at least marginally differently from all others. The basic premise of using relative efficiency analyses to evaluate education reform alternatives is that we can learn from these variations. This premise may seem obvious, but it has been largely ignored in recent policymaking. Too often, it seems that policymakers gravitate toward a policy idea without any empirical basis, assuming that it offers a better approach despite having never been tested. It is far more reasonable, however, to assume that we can learn how to do better by (a) identifying those schools or districts that do excel, and (b) evaluating how they do it. Put another way, not all schools in their current forms are woefully inefficient, and any new reform strategy will not necessarily be more efficient. It is sensible for researchers and policymakers to make use of the variation in those 100,000 schools by studying them to see what works and what does not. These are empirical questions, and they can and should be investigated.

Efficiency analysis can be viewed from either of two perspectives: production efficiency or cost efficiency. Production efficiency (also known as “technical efficiency of production”) measures the outcomes of organizational units such as schools or districts given their inputs and given the circumstances under which production occurs. That is, which schools or districts get the most bang for the buck? Cost efficiency is essentially the flip side of production efficiency. In cost efficiency analyses, the goal is to determine the minimum “cost” at which a given level of outcomes can be produced under given circumstances. That is, what’s the minimum amount of bucks we need to spend to get the bang we desire?

In either case, three moving parts are involved. First, there are measured outcomes, such as student assessment outcomes. Second, there are existing expenditures by those organizational units. Third, there are the conditions, such as the varied student populations,  and the size and location of the school or district, including differences in competitive wages for teachers, health care costs, heating and cooling costs, and transportation costs.

It is important to understand that all efficiency analyses, whether cost efficiency or production efficiency, are relative. Efficiency analysis is about evaluating how some organizational units achieve better or worse outcomes than others (given comparable spending), or how or why the “cost” of achieving specific outcomes using certain approaches and under some circumstances is more or less in some cases than others. Comparisons can be made to the efficiency of average districts or schools, or to those that appear to maximize output at given expense or minimize the cost of a given output. Efficiency analysis in education is useful because there are significant variations in key aspects of schools: what they spend, who they serve and under what conditions, and what they accomplish.

Efficiency analyses involve estimating statistical models to large numbers of schools or districts, typically over multiple years. While debate persists on the best statistical approaches for estimating cost efficiency or technical efficiency of production, the common goal across the available approaches is to determine which organizational units are more and less efficient producers of educational outcomes. Or, more precisely, the goal is to determine which units achieve specific educational outcomes at a lower cost.

Once schools or districts are identified as more (or less) efficient, the next step is to figure out why. Accordingly, researchers explore what variables across these institutions might make some more efficient than others, or what changes have been implemented that might have led to improvements in efficiency. Questions typically take one of two forms:

  1. Do districts or schools that do X tend to be more cost efficient than those doing Y?
  2. Did the schools or districts that changed their practices from X to Y improve in their relative efficiency compared to districts that did not make similar changes?

That is, the researchers identify and evaluate variations across institutions, looking for insights in those estimated to be more efficient, or alternatively, evaluating changes to efficiency in districts that have altered practices or resource allocation in some way. The latter approach is generally considered more relevant, since it speaks directly to changing practices and resulting changes in efficiency.[vii]

While statistically complex, efficiency analyses have been used to address a variety of practical issues, with implications for state policy, regarding the management and organization of local public school districts:

  1. Investigating whether school district consolidation can cut costs and identifying the most cost-efficient school district size.[viii]
  2. Investigating whether allocating state aid to subsidize property tax exemptions to affluent suburban school districts compromises relative efficiency.[ix]
  3. Investigating whether the allocation of larger shares of school district spending to instructional categories is a more efficient way to produce better educational outcomes.[x]
  4. Investigating whether decentralized governance of high schools improves efficiency.[xi]

These analyses have not always produced the results that policymakers would like to hear. Further, like many studies using rigorous scholarly methods, these analyses have limitations. They are necessarily constrained by the availability of data, they are sensitive to the quality of data, and they can produce different results when applied in different settings.[xii] But the results ultimately produced are based on rigorous and relevant analyses, and the U.S. Department of Education should be more concerned with rigor and relevance than convenience or popularity.


[i] Levin, H. M. (1983). Cost-Effectiveness. Thousand Oaks, CA: Sage.

Levin, H. M., & McEwan, P. J. (2001). Cost effectiveness analysis: Methods and applications. 2nd ed. Thousand Oaks, CA: Sage.

[ii] Borman, G., & Hewes, G. (2002). The long-term effects and cost-effectiveness of Success for All. Educational Evaluation and Policy Analysis, 24, 243-266.

[iii] Levin, H. M., Glass, G., & Meister, G. (1987). A cost-effectiveness analysis of computer assisted instruction. Evaluation Review, 11, 50-72.

[iv] Rice, J. K., & Hall, L. J. (2008). National Board Certification for teachers: What does it cost and how does it compare? Education Finance and Policy, 3, 339-373.

[v] Barnett, W. S., & Masse, L. N. (2007). Comparative Benefit Cost Analysis of the Abecedarian Program and its Policy Implications. Economics of Education Review, 26, 113-125.

[vi] See Jacob, B., & Rockoff, J. (2011). Organizing Schools to Improve Student Achievement: Start Times, Grade Configurations and Teacher Assignments. The Hamilton Project. Retrieved November 6, 2011 from http://www.hamiltonproject.org/files/downloads_and_links/092011_organize_jacob_rockoff_paper.pdf

See also Patrick McEwan’s review of this report:

McEwan, P. (2011). Review of Organizing Schools to Improve Student Achievement. Boulder, CO: National Education Policy Center. Retrieved December 2, 2011 from http://nepc.colorado.edu/thinktank/review-organizing-schools

[vii] Numerous authors have addressed the conceptual basis and empirical methods for evaluating technical efficiency of production and cost efficiency in education or government services more generally. See, for example:

Bessent, A. M., & Bessent, E. W. (1980). Determining the Comparative Efficiency of Schools through Data Envelopment Analysis, Education Administration Quarterly, 16(2), 57-75.

Duncombe, W., Miner, J., & Ruggiero, J. (1997). Empirical Evaluation of Bureaucratic Models of Inefficiency, Public Choice, 93(1), 1-18.

Duncombe, W., & Bifulco, R. (2002). Evaluating School Performance: Are we ready for prime time? In William J. Fowler, Jr. (Ed.), Developments in School Finance, 1999–2000, NCES 2002–316.Washington, DC: U.S. Department of Education, National Center for Education Statistics.

Grosskopf, S., Hayes, K. J., Taylor, L. L., & Weber, W. (2001). On the Determinants of School District Efficiency: Competition and Monitoring. Journal of Urban Economics, 49, 453-478.

[viii] Duncombe, W. & Yinger, J. (2007). Does School District Consolidation Cut Costs? Education Finance and Policy, 2(4), 341-375.

[ix] Eom, T. H., & Rubenstein, R. (2006). Do State-Funded Property Tax Exemptions Increase Local Government Inefficiency? An Analysis of New York State’s STAR Program. Public Budgeting and Finance, Spring, 66-87.

[x] Taylor, L. L., Grosskopf, S., & Hayes, K. J. (2007). Is a Low Instructional Share an Indicator of School Inefficiency? Exploring the 65-Percent Solution. Working Paper.

[xi] Grosskopf, S., & Moutray, C. (2001). Evaluating Performance in Chicago Public High Schools in the Wake of Decentralization. Economics of Education Review, 20, 1-14.

[xii] See, for example, Duncombe, W., & Bifulco, R. (2002). “Evaluating School Performance: Are we ready for prime time?” In William J. Fowler, Jr. (Ed.), Developments in School Finance, 1999–2000, NCES 2002–316. Washington, DC: U.S. Department of Education, National Center for Education Statistics.

Closing schools: Good Reasons and Bad Reasons

Current reformy rhetoric dictates that we MUST CLOSE FAILING SCHOOLS! That we must close those schools that are dropout factories or have persistently low achievement levels on state assessments. And, that we must, in the process, fire all of the staff in those schools that have caused these dismal conditions year after year, by thinking only of themselves, their tenure, their pensions and their wages – which are clearly too high for workers of their meager cognitive ability.

Take these simple bold steps and things will get better! Surely they will.

But, the bottom line is that you can’t just close down the poorest schools in any city school system and simply replace them with less poor ones – problem solved! That is, unless the larger strategy is actually about closing down entire neighborhoods, allowing them to become blighted, then seeking investors to step in and gentrify the area, replacing the old population with a new, less poor one! Problem solved. Or alternatively, if one relies on the off chance of a large scale natural disaster disproportionately displacing the poorest families to a large urban district in a neighboring state. But I digress.

A major unintended consequence of this ill-conceived reform movement is that it is distracting local school administrators and boards of education from closing and/or reorganizing schools for the right reasons by focusing all of the attention on closing schools for the wrong ones. In fact, even when school officials might wish to consider closing schools for logical reasons, they now seem compelled to say instead that they are proposing specific actions because the schools are “failing!” Not because they are too small to operate at efficient scale, that local demographic shift warrants reconsidering attendance boundaries, or that a facility is simply unsafe, or an unhealthy environment.

In really blunt terms, the current reformy rhetoric is forcing leaders to make stupid arguments for school closures where otherwise legitimate ones might actually exist!

There are legitimate reasons, cost saving reasons and other, to close schools and reorganize the delivery of educational services across organizational units and geographic locations within a district. Often, when I’m pushed to suggest the types of steps districts might take to achieve cost savings, the first issue I turn to is school organization/optimization.  Closing schools is not necessarily a bad thing. Closing schools for the wrong reasons and under the wrong pretexts is a bad thing. Reorganizing schools may lead to staffing reductions. These are cost cutting realities in a labor intensive industry. The fact is that you can’t really cut much from costs without cutting labor costs.  When enrollments decline significantly over time, fewer teachers are needed to get the job done and the staff may need to be reorganized.

But closing schools based on test scores, and pretending that we are somehow appropriately dismissing the staff that “caused” those low test scores is – well – just dumb.

Now let’s talk about some of the more legitimate reasons that a district might choose to close/reorganize schools.

First, let’s define “cost” and “cost cutting.” Cost is the minimum amount that needs to be spent to      achieve any given level of outcomes. It’s certainly possible to spend more than the minimum hypothetical – perfect world – cost of achieving any given level of outcomes. In fact, it’s pretty much a given that spending on outcomes occurs in less than perfect conditions, including unevenly growing and declining enrollments and unevenly distributed facilities capacity, quality and efficiency. Ultimately, the goal is to figure out how to reduce those barriers – less than perfect conditions – in order to get closer to that hypothetical minimum cost of achieving a given level of outcomes. In other words, the goal in times of budget cuts it to figure out how to spend less, but not compromise outcomes.

Here’s a short list of legitimate reasons a district might choose to close schools.

Economies of Scale

Operating unnecessarily small schools within a district creates inappropriate inequities. Providing more resources per pupil in one school necessarily means less in others. If those differences are based on legitimate differences in costs and student needs, that’s fine. It’s a difference that advances rather than erodes equity. But, sustaining inefficiently small schools at the expense of others within a large, population dense school district doesn’t meet those criteria. So, it’s in the best interest of the district as a whole to find ways to optimize the distribution of enrollments across schools within districts. To make sure, for example, that there aren’t elementary schools in one part of town with only 100 or so students, and in another part of town with 1,200 students. That there aren’t high schools with 300 to 400 students drawing  resources from high schools with 1,500 students. This can be really tricky to accomplish. But even moving toward optimal, while not reaching it is better than nothing. The literature on economies of scale suggests that elementary schools of 300 to 500 students and high schools of 600 to 900 students seem to produce optimal outcomes, and these sizes are consistent with literature that suggests that districts with 2000 to 4000 pupils seem to minimize costs of producing outcomes.

Facility efficiency

Some school facilities are simply more efficient to operate than others. They have more efficient mechanical/HVAC systems, are better insulated, have fewer deferred maintenance issues, potentially longer overall projected useful life.   Some facilities simply have more efficient space for accommodating the kinds of programs and services that need to be delivered. Evaluating the costs and benefits of maintaining and upgrading the current stock of facilities and whether children can be more efficiently distributed across “better” spaces with lower operations and maintenance costs is something any/all school districts should be engaged in on an ongoing basis.

Transportation efficiency

As population distribution shifts across spaces within a district, and while considering other reasons for reorganizing and redistributing students across schools – usually via changes to school attendance zones, but potentially with choice programs as well – evaluation of transportation efficiency should also be on the table.  In a district with dramatically declining enrollment or geographically shifting enrollment, school closings may be inevitable. In fact, a district may find itself closing some schools and selling off land, while opening others in different locations (less likely in more densely populated urban centers, but common in sprawling exurbia).

Health & Safety Concerns

This one is (or at least should be) a no brainer. Kids shouldn’t be housed in unsafe or unhealthy facilities.  That in mind, districts should engage in cost-benefit analyses to evaluate/compare the costs of improving the problem facilities/spaces versus other reorganization options.  Closing unsafe, unhealthy schools and appropriately distributing students among “better” spaces is obviously a legitimate reason for school closing.

Socioeconomic integration/balancing

A final reason why a district might close and/or reorganize schools to improve performance while maintaining (or cutting) spending, is to achieve better peer group balance across schools. Of course, this only works when the district is a) heterogeneous enough to be able to create better balanced peer groups and b) geographically small enough to not incur substantial transportation costs when implementing such a policy. A substantial body of research indicates that concentrated poverty and for that matter racial composition (racial isolation) in schools can affect the costs of achieving a given outcome target. Optimizing peer group composition across schools while considering interaction with other cost drivers (transportation) makes sense.  Of course, the U.S. Supreme Court has placed some constraints on the role of race in re-assignment policies, http://www.oyez.org/cases/2000-2009/2006/2006_05_908. But options remain available.

Improving peer group balance, optimizing school sizes, optimizing bus routes, making best use of most operationally efficient and educationally efficient learning spaces all can help districts both reduce costs and improve outcomes.

AND ABSOLUTELY NONE OF THIS HAS ANYTHING TO DO WITH CLOSING FAILING SCHOOLS.  Why, because there’s little or no evidence that closing “failing” schools improves either productivity or efficiency.

It’s not that sexy. It’s not reformy. It’s just good management decision making to get the most bang-for-the-buck. And it’s all stuff that districts can and should be working on constantly.

Closing schools is never easy. Someone will always be irked, no matter what the reason for the closure. A neighborhood will feel that it has lost its identity. Alums will feel that a piece of their childhood has been taken away.  So if we’re going to go down this road, and fight the difficult political fights that school closing plans create, then we ought to be closing the schools for the right reasons, and not the wrong ones!


Productivity Agenda Yes! But based on real research & rigorous analysis!

Pau Hill and Marguerite Roza’s response to my recent report – with Kevin Welner – and series of blog posts seems to offer as its central argument that we’re simply a curmudgeons, offering lots of complaints about the rigor of their arguments and their suggestions for improving schooling productivity and efficiency, but providing no creative or immediately useful ideas or solutions for school districts or states in these tough economic times.

My first response would be that bad ideas are bad ideas, even in the absence of alternatives. The fact that budgets are tight and many schools are underperforming is not an argument for implementing unproven, ill-considered policy solutions.

That said, my second response is that Kevin Welner and I did in fact offer our own solutions, both in our policy brief and elsewhere.

On the first response, allow me to point out that many of Hill and Roza’s own suggestions for how states or school districts should deal with these tough economic times are not cost-cutting measures at all. They provide little or no potential short-run cost savings – where cost savings means spending reduction while not harming (or perhaps even improving) student outcomes. For example, among the “cost-cutting” solutions offered in Petrilli and Roza’s Stretching the School Dollar[i], brief, one of the resources recommended by the U.S. Department of Education, is designing and implementing new teacher evaluations. I may disagree with the shape that most of these new systems are taking, but I certainly agree that improving evaluations is a good idea.

It is not, however, a cost-cutting measure. In fact, it would require significant up-front investments, and whether or not these new systems will improve student outcomes (to say nothing of doing so cost-effectively) is a completely open question.

In addition, Kevin Welner and I address numerous concerns regarding other proposals in Roza’s work on pages 9 to 15 of our policy brief, including proposals (in) for states to simply cut off aid for limited English proficient children after two years, or to cap the distribution of special education aid. These are simply spending cuts, not cost savings and there is little or no evidence that such cuts would cause no harm, much less generate improvements.

Hill and Roza also suggest that their brief on curing “Baumol’s disease” provides useful insights into how private sector industries have found cures that might be translated to public education. Kevin Welner and I thoroughly rebut the basic premise of the Baumols’ disease claim and Hill and Roza’s proposed solutions on Page 10-11 of our report. In short, Kevin Welner and I explain about this Baumol’s hypothesis (& solutions):

In sum, the report begins with two highly contestable claims. It then draws an unsupported causal connection between the two claims. Further, it assumes that the problem is universal—that the system as a whole is diseased. In making this assumption, the authors ignore any possibility that lessons may be derived from within the public education system.

My second general response is that, in contrast with Roza and Hill’s characterization of my work, Kevin Welner and I offer up lists of issues that have been studied regarding productivity and efficiency in public schooling, as well as frameworks for studying those issues and for guiding decision making.  That is, our policy brief on this topic is not merely a list of curmudgeonly complaints and critiques of the work of Roza and others, though we do have serious concerns (elaborated through curmudgeonly complaints) about the quality of much of that work and claims made. In fact, I personally have even more serious concerns about related work from Roza and colleagues that has come to light since the writing of that brief. Yes, Kevin and I can really crank out those curmudgeonly complaints. But we don’t stop there… this time.

Among other things, Kevin and I point to research that offers potentially mundane solutions – the non-reformy stuff – like organizing schools within districts to optimize distributions of enrollments (school size) to achieve economies of scale – and we cite a handful of examples provided in a paper we cite by Brian Jacob & Jonah Rockoff[ii], including (a) changes to school start times for older students, based on research on learning outcomes by time of day; (b) changes in school-grade configurations, based on an increased body of evidence relating grade configurations, location transitions and student outcomes; and (c) more effective management of teacher assignments. Perhaps more importantly, we address methods and resources for guiding decision making on the basis of cost-effectiveness, and point out how cost effectiveness of particular options may, in fact, vary across settings.

It also bears mentioning that we don’t necessarily reject all of the ideas that Hill and Roza present. Rather, we explain that some might be explored, and might even be evaluated in pilot settings before we starting pitching them as large scale reforms. For instance, regarding large scale changes to teacher compensation systems, we explain:

That is not to say that such ideas cannot or should not be piloted and tested. They are, to some extent, researchable questions, most appropriately studied through relative efficiency analyses across districts and schools that are applying varied approaches, including the proposed new approaches.

In a forthcoming piece we go further to explain that some of our concerns regarding Roza and Hill’s current proposals are that they encourage large scale policy experimentation on the most vulnerable children, and we find that unacceptable given the extent of unknowns involved.  We explain (forthcoming):

Further, the political rhetoric around the immediacy of reform focuses on so-called failing schools, and failure is identified through performance metrics heavily influenced by student demographics. Simply put, we have ethical concerns with imposing unproven and sometimes unstudied policies on schools in low-income communities of color. And this is what we see happening.

There is time to figure some of this stuff out, and there are things we can look to do more immediately to achieve short run cost savings where necessary. As I often point out, when advocates use language like “And they need these ideas NOW,” it is most often a ploy to compel people into expediting ill-conceived policies with as much potential to do harm as to do good.

Many of the things that can and should be done in the short run, to reorganize local school district budgets, and to cut spending with minimal negative impact on outcomes, are really mundane things. They’re just not sexy enough to make for a good political platform or to generate public outcry. They don’t even lend themselves to good acronyms or catch phrases, like LIFO (last in, first out). They don’t have really cool, catchy names like Parent Trigger (note – I’m not blaming or even trying to connect Roza and Hill to Parent Trigger). And they can’t be likened to a disease to be cured.

They are instead ideas with a strong, empirically-based track record.

In the longer term, yes – there are policies that should be considered and tested, including those pertaining to teacher quality. But they are substantive education policies, not cost-cutting measures, and we should not be using a budget crisis to justify unwarranted haste and recklessness. Good policy making must rely on good policy analysis, and this relationship should not be severed simply because money is tight. If anything, it should be strengthened.

===============

Supplemental Note:

Hill and Roza offer as evidence that their proposed strategies have been evaluated in terms of productive efficiency and cost effectiveness, three links to related “studies”. One of those links points to a paper by Dan Goldhaber and Roddy Theobald, regarding potential costs/benefits of Seniority based versus “Quality-Based” layoffs. On the one hand, the paper does not yield any decisive guidance for short term budget planning and on the other hand, suffers the circular logic I’ve discussed on numerous occasions on my blog regarding measuring the effectiveness of the policy by the same measure used to implement the policy (e.g. did firing teachers with low value added scores leave us with more teachers with high value added scores).  The central conclusion of the paper(s) is that “Finally, simulations suggest that a very different group of teachers would be targeted for layoffs under an effectiveness-based layoff scenario than under the seniority-driven system that exists today.” This is hardly surprising, and of limited usefulness for informing state or local leaders on how to handle personnel decisions in tough budgetary times, or the expected benefits or downsides of such policies, and fails to address such basic issues as the costs of putting into place a system that might be used for making such decisions. I provide a hypothetical discussion of this topic in an earlier blog post. The other study cited is Eric Hanushek’s paper suggesting that teachers whose effectiveness ratings are one standard deviation above the mean can yield $400,000 benefit in present value of student future earnings with a class size of 20. This study also provides no guidance for how district administrators might cut costs, or even hold the line, while attracting or retaining teachers whose value added scores are a standard deviation higher than their current average. Rather, this study speaks to the kind of large scale deselection which I’ve discussed numerous times in this blog. The third “study” is not a study at all, but rather an opinion brief by Roza with relatively meaningless national ball park estimates of job loss under alternative dismissal scenarios.


[i] Petrilli, M., & Roza, M. (2011). Stretching the School Dollar: A brief for State Policymakers. Thomas B. Fordham Institute. Retrieved November 6, 2011, from http://www.edexcellencemedia.net/publications/2011/20110106_STSD_PolicyBrief/20110106_STSD_PolicyBrief.pdf.

[ii] See Jacob, B., & Rockoff, J. (2011). Organizing Schools to Improve Student Achievement: Start Times, Grade Configurations and Teacher Assignments. The Hamilton Project. Retrieved November 6, 2011, from http://www.hamiltonproject.org/files/downloads_and_links/092011_organize_jacob_rockoff_paper.pdf.

Newark Public Schools: Let’s Just Close the Poor Schools and Replace them with Less Poor Ones?

This week started with several individuals from the Washington DC area asking if I would address a school closure/turnaround report produced by an outside consulting firm on contract with the DC Public Schools (as I understand it). That consulting firm basically made a map of the locations of the schools around the city, identified which schools had higher and lower proficiency rates, and where proficiency rates had changed over time, and then basically listed the lowest performing schools by these deeply flawed metrics suggesting their closure and alternatives for “turnaround,” essentially focusing on conversion and expansion of charter schools. Thankfully, before I even got a chance to dig into the report, two other bloggers took it to task. As Steve Glazerman explains here:

Student proficiency rates have long been discredited as a school performance measure because proficiency rates capture student achievement at a point in time, but say little about how much the school or its teachers contributed to its current students’ performance.

For example, a middle school could have declining proficiency rates if a feeder school begins sending more at-risk students to it, even if the teachers are especially skilled at working with a challenging population.

At a bare minimum, a sensible measure accounts for what a student knew before enrolling in the school (for example, using the student’s score from the prior year). This is why more and more states, including DC, have adopted student achievement growth measures instead of proficiency rates for their teacher and school performance indicators.

Using a trend in proficiency rates doesn’t help, and only creates a false sense of “gains” which is more likely to measure demographic change and other differences between successive cohorts of students cycling through a school than the performance of the schools’ educators. That’s because it compares students in one year to different students, instead of students in one year to the same students in the prior year.

By relying on flawed measures of school performance, policymakers risk closing down schools that are best equipped to work with challenging populations and replacing them with ones that would fail miserably if they started working with a different student body.

http://greatergreaterwashington.org/post/13512/flawed-study-mis-rates-potential-dc-school-closings/

Matt Di        Carlo also addressed the issue of conflating student and school performance here.

This early-in-the-week flap brought back to mind an even more crude, sloppy and egregiously flawed report that was produced last spring for Newark Public Schools by a group calling itself Global Education Advisors. Here’s a story about the report. http://www.njspotlight.com/stories/11/0607/2319/. And here’s a link to what they produced: http://www.njspotlight.com/assets/11/0306/2157

Let’s be really blunt/honest here. This stuff is hack junk, and whoever is responsible for producing it really has no business providing recommendations on anything relating to schools/education, or for that matter the basic use/presentation of data.

Because I didn’t take this report seriously at all at the time, I totally blew it off. After all, who would really make decisions affecting large numbers of low income urban schoolchildren based on such ill-conceived schlock. At least the shoddy analyses produced by the Pittsburgh based group working for Washington DC kind of looked serious.

Note that on Page 6 of the Newark report, the authors suggest that charter schools be moved into several NPS school locations including MLK, Burnet and Eighteenth Avenue. This recommendation appears in part based on the authors’ identification of “low performing schools” shown in appendices at the end of the document. The third slide from the end simply sorts schools from highest to lowest proficiency rates to identify the lowest performing quintile from 2009: http://www.njspotlight.com/assets/11/0306/2157

And perhaps none of this schlock really does enter into the current discussions on Newark school closures. One can only hope.

In any case, yesterday’s Star Ledger included a story on proposed school closures and reorganization in Newark. http://www.nj.com/news/index.ssf/2012/02/newark_superintendent_to_annou.html

Let me start by saying that I do like some of the language/explanations being used by the Superintendent in explaining her desire to look at the system as a whole – including charter, magnet and traditional public schools – and how they each affect one another in terms of how children are distributed across those schools.

Let me also be clear that I’m all for within district school reorganization especially to optimize the efficiency of school district operations and achieve more balanced student populations across schools. Very small schools operating within population dense urban districts are a resource drain. By very small, I mean elementary schools of less than 300 students, or high schools of less than 600 students. Subsidizing very small schools’ operations necessarily takes away from other things. Also, concentrated poverty – high concentrations of children from very low income families – is very hard to overcome, as is racial isolation in schools. To the extent that school districts can better distribute/balance/integrate populations, improving outcomes can be easier. This stuff should be considered/on the table. Just to be clear, I’m all for appropriate re-organization.

What I’m not for… and I’m not yet sure what’s going on here… is pretending that we can simply shut down schools in high poverty neighborhoods, blaming teachers and principals for their failure, and then either a) replacing the school management and staff with individuals likely to be even less qualified and less well equipped to handle the circumstances,  or b) initiating an inevitably continuous pattern of displacement from school to school to school for children already disadvantaged.

Again, I don’t yet see this kind of language being used in Newark, as it has been in New York City, for example (regarding the 33 “low performers” there).

But, let’s take a quick look at the schools which the Ledger reports as being on the closure hit list: “Dayton Street, Martin Luther King, 18th Avenue, Miller Street and Burnet Street elementary schools”

Some of these schools also made the Global Education Advisors hit list, including Burnett, MLK and Eighteenth Ave.

First, here’s where the schools fit in a districtwide/citywide sort of % Free Lunch (2011):

Closure elementary schools are indicated in Red, and charter schools in Green. District average (labeled Total – sorry) is in Black. In short, these are high poverty schools, with two of them – Dayton and Miller St having among the highest concentrations of low income children.

Now, here’s how they perform on a few select tests, with the schools sorted by low income concentration and proficiency based on 2010 assessment data (General Test Takers):

In brief, they perform pretty much where you’d expect them to, with Burnett and Miller outperforming similarly low income schools in Math, with Dayton well below the trendline, and with Burnet falling down with Dayton on Language. But again these schools still fall near other similar schools.

Low income concentration alone isn’t the only reasonable predictor of performance differences across theses schools, and it’s useful to be able to bring in  – aggregate – results across all of the tests and grade levels. So, I ran a quick & dirty descriptive regression model in which I predicted general test taker proficiency rates accounting for a) % Free lunch b) % by racial composition (Black/Hispanic) c) % LEP/ELL, d) % Female (strong predictor w/NJ scores in urban contexts). And, I control for which test/grade level. Here’s a link to the output.

Then, for visual fun, I plotted the differences (standard deviations) between expected and actual performance for 2010 assessments… here:

So, what we have here is a mix of Newark schools much like other Newark schools which are very high in poverty. They have a mix of student outcomes, some beating expectations and others falling short, and they have a mix in terms of specific grade levels and assessments.

And notice the green dots in the picture – those charter schools. All of those charter schools serve substantively less poor populations than the NPS schools identified by the Ledger for closure. And some of those charter schools actually fall further below their “expected” performance levels than the worst of the NPS schools slated for closure.

Let’s be absolutely clear here – these high poverty schools slated for closure (if the Ledger is correct) – cannot simply be converted into lower poverty schools and made “more successful.”

Indeed redistributing those students among less poor students – altering the peer composition by disrupting concentrated poverty might help. But there aren’t a whole lot of options available for accomplishing that. Further, with each disruptive relocation for each child comes another potential marginal loss.

Let’s just hope those involved are being somewhat more thoughtful about these decisions and using more reasonable information to guide their decision making that what was produced for the district last spring, or that which stirred up such controversy in DC earlier this week.

UPDATE:

Here are some maps of the above data. First, here are the schools in Newark, with the regression based relative performance estimates from the last figure above. Schools in blue perform above expectations (based on proficiency rates) and schools in red below expectations. Schools with a push-pin in them are charter schools and schools with a red X are elementary schools slated for closure.  As in the above pictures (because it’s the same data), those slated for closure include a mix of higher and lower performing schools. Similarly, charter schools are a mixed bag. Note that the locations of the schools are determined using the latitude and longitude data from the NCES Common Core, which by my experience, may include some errors (school locations may be incorrectly or imprecisely reported).

Here’s what it looks like with the schools shaded according to % free lunch. Schools slated for closure are invariably among the highest poverty schools. The difficulty here is that other NPS schools around them also tend to be very high poverty, while nearby charter schools have much… much… much lower poverty concentrations.

Friday Thoughts: In my own words (recent media commentary)

Interview for In These Times:

[I]t’s much easier to point blame at those working within the system–like teachers–than to actually raise the revenues to provide the resources necessary to really improve the system–to pay sufficient wages to attract and retain top college graduates and to provide the working conditions that would make teaching more appealing–including smaller total student loads… and higher quality infrastructure, materials, supplies, equipment and other supports.

http://www.inthesetimes.com/working/entry/12618/teachers_and_communities_overshadowed_by_corporate_fixes_for_schools/

In my interview with Geoff Mulvihill of AP:

In response to what reforms are needed most in New Jersey?

From a research angle, if you looked at the high-performing and the low-performing schools and you asked yourself what’s different about them, well, our highest-performing schools also have step-structured pay scales, collective bargained agreements, tenure, union contracts as do our low-performing schools. That’s not a differentiating factor.

These things that we’re talking about like merit pay, disrupting union contracts and collective bargaining don’t tend to be the things that the high-performing schools are doing.

http://www.courierpostonline.com/article/20120103/NEWS02/301030016/Educating-New-Jersey-s-urban-kids-costs-more-scholar-says?odyssey=nav|head

Follow up in a similar question

If you look at the biggest differences between the schools that are doing well and the schools that are doing poorly, there may be differences in teaching quality. There may be differences in skill-set of the teachers who are sorting themselves among the more and less desirable schools.

It may be that we’ve got some inequities in teaching quality. But to suggest that those inequities are a function of not having merit pay or they’re a function of having collective bargaining and a union presence doesn’t seem to fit when those structures also exist in the highly successful and affluent districts.

http://www.courierpostonline.com/article/20120103/NEWS02/301030016/Educating-New-Jersey-s-urban-kids-costs-more-scholar-says?odyssey=nav|head

On where to go from here:

I think we’ve got to keep up the effort of targeting resources toward the high-need districts, and the key is that equitable and adequate funding — and this is my big punchline — is the necessary condition for everything. If you want to run a good charter school, if you want to run a good public school, you’ve got to have enough money to do a good job.

Beneath the Veil of Inadequate Cost Analyses: What do Roland Fryer’s School Reform Studies Really Tell Us? (if anything)

Here’s a short section from one of my papers currently in progress (part of the summary of existing literature on alternative models/strategies, and marginal expenditures).

A series of studies from Roland Fryer and colleagues have explored the effectiveness of specific charter school models and strategies, including Harlem Childrens’ Zone (Dobbie & Fryer, 2009), “no excuses” charter schools in New York City (Dobbie & Fryer, 2011), schools within the Houston public school district (Apollo 20) mimicking no excuses charter strategies (Fryer, 2011, Fryer, 2012), and an intensive urban residential schooling model in Baltimore, MD (Curto & Fryer, 2011).  In each case, the models in question involve resource intensive strategies, including substantially lengthening school days and years, providing small group (2 or 3 on 1) intensive tutoring, providing extensive community based wrap around services (Harlem Childrens’ Zone) or providing student housing and residential support services (Baltimore).

The broad conclusion across these studies is that charter schools or traditional public schools can produce dramatic improvements to student outcomes by implementing no excuses strategies and perhaps wrap around services, and that these strategies come at relatively modest marginal cost. Regarding the benefits of the most expensive alternative explored – residential schooling in Baltimore (at a reported $39,000 per pupil) – the authors conclude that no excuses strategies of extended day and year, and intensive tutoring are likely more cost effective.

But, each of these studies suffers from poorly documented and often ill-conceived comparisons of costs and/or marginal expenditures.

In their study on the effectiveness of no excuses New York City charter schools, Dobbie and Fryer (2011) use data on 35 [those responding to their survey] charter schools to generate an aggregate index based on five policies including teacher feedback, use of data to guide instruction, high-dosage tutoring, increased instructional time and high expectations. [i] They then correlate this index with their measures of school effectiveness across the 35 schools, finding a significant relationship. Separately, the authors report weak or no correlations between “traditional” measures of school resources including per pupil spending and class size and their effectiveness measures, concluding that these measures are not correlated with effectiveness. In short, Dobbie and Fryer argue that potentially costly strategies matter, but money doesn’t. [or so the headlines went]

First, if potentially costly strategies matter (even if those costs are never measured), then so too does money itself. Second, the authors’ analysis and documentation of the financial data is woefully inadequate.[ii] The authors fail entirely to consider that the majority (55 to 60%) of per pupil spending differences across New York City charter schools are explained by grade ranges served and total enrollments (and/or enrollment per grade level, economies of scale), where enrollment is to some extent a function of institutional maturation (scaling up) (Baker and Ferris, 2011, p. 33).[iii]  Given the extent that expenditure variation is largely a function of uncontrollable structural differences across these schools, it is unlikely that one will find a simple correlation between spending variation and student outcomes (without finding some way to control for the structural differences). The authors also fail to report the source or descriptive statistics on their expenditure measure.

In earlier work on Harlem Childrens’ Zone, Dobbie and Fryer[iv] similarly argued that the substantial benefits they found for children participating in HCZ charter schools could be obtained at what they [feebly attempt to] characterize as negligible marginal expense. They arrive at this conclusion via the following [hap-hazard] cost calculation and [bogus] comparison:

The total per-pupil costs of the HCZ public charter schools can be calculated with relative ease. The New York Department of Education provided every charter school, including the Promise Academy, $12,443 per pupil in 2008-2009. HCZ estimates that they added an additional $4,657 per-pupil for in school costs and approximately $2,172 per pupil for after-school and “wrap-around” programs. This implies that HCZ spends $19,272 per pupil. To put this in perspective, the median school district in New York State spent $16,171 per pupil in 2006, and the district at the 95th percentile cutpoint spent $33,521 per pupil (Zhou and Johnson, 2008).[v]

Accepting the additional costs of Harlem Childrens’ Zone as adding up to $19,000 per pupil and accepting as a relevant comparison basis that this figure lies somewhere between the New York statewide median and statewide 95%ile of district spending, then the marginal expense for Harlem Childrens’ Zone might just be trivial. But the marginal expense calculation for HCZ is not clearly documented and highly suspect and the comparison basis misleading.

Baker and Ferris (2011) discuss the difficulties of deriving comparable spending per pupil figures for Harlem Childrens’ Zone schools, pointing out that reported total revenues based on IRS filings vary from $6,000 to $60,000 per pupil (p. 13) depending on the year of data and which children are counted in the denominator (charter students or all school aged residents in the zone).

Further it makes little sense to contextualize the HCZ total figure by placing it between the statewide median and 95%ile district, where affluent suburban Westchester County and Long Island districts far outpace per pupil spending in New York City (Baker and Welner, 2010, p.  10).[vi] Rather, more meaningful comparisons might use relevant budget components for all schools in New York City, or schools serving similar student populations in the same area of the city. Using the city Independent Budget Office (2010b) figure for 2008-09 of $15,672, and accepting the authors total cost figure of $19,000 per pupil, the marginal expense for HCZ would be 21%. Comparing against nearby school site budgets for select schools (see Baker and Ferris, p. 24), the marginal expense is 36 to 60%.

Similar imprecision plagues Fryer’s analysis of transfer of “no excuses” strategies from the charter school context to traditional public schools in Houston, Texas. Fryer explains in his study of Apollo 20 schools in Texas:

The marginal costs are $1,837 per student, which is similar to the marginal costs of other high-performing charter schools. While this may seem to be an important barrier, a back of the envelope cost-benefit exercise reveals that the rate of return on this investment is roughly 20 percent 30 – if one takes the point estimates at face value. Moreover, there are likely lower cost ways to conduct our experiment. For instance, tutoring cost over $2,500 per student. Future experiments can inform whether three-on-one (reducing costs by a third) or even online tutoring may yield similar effects.

Among other things, it is important to understand that this $1,837 figure is derived in a Houston, TX context (as opposed to an NYC context) where the average middle school operating expenditure per pupil is $7,911, for an average marginal expense of 1837/7911 = 23.2%.  While no documentation is provided for the $1,837 figure in Fryer’s paper, that figure is quite close to the average difference in current operating expenditure for the 5 Apollo 20 middle schools in Houston compared to all schools in Houston. But, when comparing only to other Houston Middle Schools that figure rises to $2,392, or 30%. In our view, a 23% to 30% increase in cost is substantial, but further exploration of the true costs of scaling the various reform strategies presented is warranted. [data available here: http://ritter.tea.state.tx.us/perfreport/aeis/2010/DownloadData.html]

In short, across Fryer’s various studies, we find a range of marginal expenses for preferred models and strategies from 21% to 60% above average expenditures of other schools not using the preferred models and strategies. So, what are these studies really saying?

Setting aside the exceptionally poor documentation behind any of the marginal expenditure or cost estimates provided in each and every one of these studies, throughout his various attempts to downplay the importance of financial resources for improving student outcomes, Roland Fryer and colleagues have made a compelling case for spending between 20 and 60% more on public schooling in poor urban contexts including New York City and Houston, TX.

I suspect there are more than a few urban superintendents and principals out there who would appreciate seeing and infusion of resources of this magnitude. And many might even be happy to allocate the bulk of those resources to adopt such strategies as increasing teacher compensation in order to extend school days and years and implement intensive tutoring supports (surprisingly non-reformy strategies).

I should also point out that 20% to 60% more funding, while marginally improving student outcomes in these districts, likely still falls well short of providing children attending poor urban districts equal opportunity to achieve outcomes commonly achieved by their more affluent suburban counterparts, and may fall well short of providing adequate resources for these children to gain access to and succeed in higher education and the labor market beyond. Estimating the true costs of these more lofty outcome objectives is a topic for another day.

NOTE: I would caution however, that we have little basis for asserting that a 20 to 60% increase in per pupil spending would be more efficiently spent on these strategies than on such alternatives as class size reduction and/or expansion of early childhood programs. These comparisons simply haven’t been made, and Fryer’s attempt at such a comparison (NYC “no excuses” study) is woefully inadequate.  Pundits who argue that class size reduction is an especially expensive and inefficient alternative seem willing to ignore outright the substantial additional costs of the strategies promoted in Fryer’s work, arriving at the erroneous conclusion (with Fryer’s full support) that class size reduction is ineffective and costly, and extended school time and intensive tutoring are costless and highly effective.


[ii] For a discussion of methods used for evaluating the relationship between fiscal inputs and student outcomes, see Baker, B.D. (2012) Revisiting the Age-Old Question: Does Money Matter in Education. Shanker Institute. http://www.shankerinstitute.org/images/doesmoneymatter_final.pdf

[iii] Baker, B.D. & Ferris, R. (2011). Adding Up the Spending: Fiscal Disparities and Philanthropy among New York City Charter Schools. Boulder, CO: National Education Policy Center. Retrieved [date] from http://nepc.colorado.edu/publication/NYC-charter-disparities.

[iv] Dobbie, W. & Fryer, R. G. (2009). Are High-Quality Schools Enough to Close the Achievement Gap? Evidence from a Bold Social Experiment in Harlem. Unpublished manuscript, Harvard University, 5.

[v] Dobbie, W. & Fryer, R. G. (2009). Are High-Quality Schools Enough to Close the Achievement Gap? Evidence from a Bold Social Experiment in Harlem. Unpublished manuscript, Harvard University, 5. http://www.economics.harvard.edu/files/faculty/21_HCZ_Nov2009_NBERwkgpaper.pdf

[vi] Baker, B. D., & Welner, K. G. (2010). “Premature celebrations: The persistence of interdistrict funding disparities” Educational Policy Analysis Archives, 18(9). Retrieved [date] from http://epaa.asu.edu/ojs/article/view/741

Jay Greene (Inadvertently?) Argues for a 23% Funding Increase for Texas Schools

I was intrigued by this post from Jay Greene today, in which he points out that public schools can learn from charter schools and perhaps can implement some of their successes. Specifically, Greene is referring to KIPP-like “no excuses” charter schools as a model, and their strategies for improving outcomes including much extended school time (longer day/year).  As the basis for his argument, Greene refers specifically to Roland Fryer’s updated analysis of Houston’s Apollo 20 schools – which are – in effect, models of no excuses charters applied in the traditional public district.  Greene opines:

Traditional public schools can get results like a KIPP school without having to actually become KIPP schools.  They just have to imitate a few of the key features employed by KIPP and other successful charter schools.  This is incredibly encouraging news.

Greene does acknowledge that pesky little issue of potentially higher costs, but seems to go along with Fryer’s downplaying of the additional costs, given the amazing benefits.

Cost is another barrier to bringing this reform strategy to scale, but he notes that the marginal cost is only $1,837 per student and the rate of return on that investment would be roughly 20%. (emphasis added)

Those of you who read Jay’s work regularly probably realize that he’s not generally one to argue that more money matters, at all, for improving public schools.  After all, here’s the intro to a synopsis of his book on Education Myths:

How can we fix our floundering public schools? The conventional wisdom says that schools need a lot more money, that poor and immigrant children can’t do as well as most other American kids, that high-stakes tests just produce “teaching to the test,” and that vouchers do little to help students while undermining our democracy. But what if the conventional wisdom is wrong?

Alternatively, what if Jay Greene is wrong and he just realized it – without even realizing it?  Perhaps he’s turning over a new leaf here. Perhaps he’s accepting that a little extra funding, if used on simple things like small group tutoring and additional time can help. Heck, if it’s such a small amount of money – ONLY $1,837 per pupil – we can likely find that somewhere already squandered in school budgets.

Really, what’s an additional $1,837 per Houston middle school student anyway? Let’s wrap some context around that number. Well, it’s about 23% higher than the average 2010 current operating expenditure per middle school pupil in Houston Independent School District (based on school site current operating expenditure data for Houston ISD, which can be downloaded here: http://ritter.tea.state.tx.us/perfreport/aeis/2010/DownloadData.html)

Now, in Houston ISD alone, there are about 36,000 middle schoolers, with somewhat under 4,000 (3,657) in 5 Apollo 20 Middle Schools (applying this list of middle schools – Attucks, Dowling, Fondren, Key, and Ryan – to the TEA school site data on enrollments). So let’s say we want to add about $2,000 per pupil to the budgets of the other middle schools serving about 32,000 pupils. Oh, that’s about $64 million.

Of course, it’s quite likely that the an additional 23% funding could also do some good toward expanding school time, providing intensive tutoring and other no excuses strategies in elementary and secondary schools as well. Houston Elementary schools serve over 100,000 kids and high schools nearly 50,000 kids. Rounding it off at an additional $2k per 150,000 kids, and well, we’re talking about a substantial increase in expenditure for Houston ISD.

Even if one can hypothetically re-allocate about 3 to 5% of existing funding toward these strategies, we’re still looking at approximately 18 to 20% increase in funding required to round out the programs/services.

Personally, I’m glad to see Jay Greene come around to this realization that a substantial infusion of additional funding, used wisely might lead to substantial improvement in traditional public schools.

Jay also points out that he has some concern that when scaling up these strategies, that sufficient supply of high quality teachers will be readily available. Fryer’s analysis doesn’t provide much insight into the competitive wages for the “no excuses” charter school teacher. Actually, Fryer’s analysis doesn’t even provide any real documentation of the $1,837 figure[1], but I’ll set that aside for now, since I’ve complained about Fryer’s hap-hazard, back of the napkin cost analyses in nearly every one of his other papers on a previous blog post.

Here’s a brief preview from ongoing research of the competitive wage structure of KIPP and other charter school teachers in Houston, and teachers in Houston ISD. These comparisons are based on a wage model using teacher level data in which I estimate the base salary of full time teachers as a function of degree levels and experience levels for teachers in each type charter school listed and in Houston ISD. I then project teacher salaries holding other factors constant.

Not surprisingly, KIPP in particular pays a significant premium for their teachers (with Harmony schools as a stark contrast, but see this story for additional context). Perhaps wages matter here, and that certainly needs to figure into the future scalability of these strategies, if we truly expect to hold teacher quality at least constant (if not improve it over time).

Here’s how Houston KIPP middle school operating expenditures per pupil stack up against Houston ISD middle schools (by special ed population share – which happens to be the most consistent predictor of school site spending differences, along with grade level served).

Paying teachers more to recruit and retain high quality candidates, and to find candidates willing to work more hours and days? Offering more time by extending school days and school years? Providing small group tutoring? This kind of stuff appears to make sense. And, it costs money. And if this stuff matters, then money matters. Sometimes it really is that simple.

Welcome aboard Jay. Perhaps money really does (or at least can) matter after all!

[1] The average difference in current operating expenditure per pupil between the five Apollo middle schools and all other Houston ISD schools (all grades) in 2010 appears to be about $1,839, surprisingly close to Fryer’s undocumented estimate.  But, the average difference between Apollo middle schools and Houston ISD middle schools was $2,392.

Follow up on Fire First, Ask Questions Later

Many of us have had extensive ongoing conversation about the Big Study (CFR) that caught media attention last week. That conversation has included much thoughtful feedback from the authors of the study.  That’s how it should be. A good, ongoing discussion delving into technical details and considering alternative policy implications.  I received the following kind note from one of the study authors, John Friedman, in which he addresses three major points in my critique:

Dear Bruce,

Thank you very much for your thorough and well-reasoned comment on our paper.  You raise three major concerns with the study in your post which we’d like to address.  First, you write that “just because teacher VA scores in a massive data set show variance does not mean that we can identify with any level of precision or accuracy which individual teachers … are “good” and which are “bad.”  You are certainly correct that there is lots of noise in the measurement of quality for any individual teacher.  But I don’t think it is right that we cannot identify individual teachers’ quality with any precision.  In fact, our value-added estimates for individual teachers come with confidence intervals that exactly quantify the degree of uncertainty, as we discuss in Section 6.2 of the paper.  For instance, if after 3 average-sized classrooms a teacher had VA of -0.2, which is 2 standard deviations below the mean, would have a confidence interval of approximately [-0.41,0.01].  This range implies that there is a 80% chance that the teacher is among the worst 15% in the system, and less than a 5% chance that the teacher is better than average.  Importantly, we take account of this teacher-level uncertainty in our calculations in Figure 10.  Even taking account of this uncertainly, replacing this teacher with an average one would generate $190K in NPV future earnings for the students per classroom.  Thus, even taking into account imprecision, value-added still provides useful information about individual teachers.  The imprecision does imply that we should use other measures (such as principal ratings or student feedback) in combination with VA (more on this below).

Your second concern is about the policy implications of the study, in particular the quotations given by my co-author and I for the NYT article, which give the impression that we view dismissing low-VA teachers as the best solution.  These quotes were taken out of context and we’d like to clarify our actual position.  As we emphasize in our executive summary and paper, the policy implications of the study are not completely clear.  What we know is that great teachers have great value and that test-score based VA measures can be useful in identifying such teachers.  In the long run, the best way to improve teaching will likely require making teaching a highly prestigious and well rewarded profession that attracts top talent.  Our interpretation of the policy implications of the paper is better reflected in this article we wrote for the New York Times.

Finally, you suggest to your readers that the earnings gains from replacing a bottom-5% teacher with an average one are small — only $250 per year.  This is an arithmetic error due to not adjusting for discounting. We discount all gains back to age 12 at a 5% interest rate in order to put everything in today’s dollars, which is standard practice in economics. Your calculation requires the undiscounted gain (i.e. summing the cumulative earnings impact), which is $50,000 per student for a 1 SD better teacher (84th pctile vs 50th pctile) in one grade. Discounted back to age 12 at a 5% interest rate, $50K is equivalent to about $9K.  $50,000 over a lifetime – around $1,000 per year – is still only a moderate amount, but we think it would be implausible that a single teacher could do more than that on average. So the magnitudes strike us as reasonable yet important.  It sounds like many readers make this discounting mistake, so it might be helpful to correct your calculation so that your readers have the facts right (the paper itself also provides these calculations in Appendix Table 14).

Thank you again for your thoughtful post, we hope look forward to reading your comments on our work and others in the future.

Best,

John Friedman

I do have comments in response to each of these points, as well as a few additional thoughts. And I certainly welcome any additional response from John or the other authors.

On precision & accuracy

The first point above addresses only the confidence interval around a teacher’s VA estimate for the teacher in the bottom 15%. Even then, if we were to use the VA estimate as a blunt instrument (acknowledging that the paper does not make such a recommendation – but does simulate it as an option) for deselection, this would result in a 20% chance of dismissing teachers who are not legitimately in the bottom 15% (5% who are actually above average), given three years of data.  Yes, that’s far better than break even (after waiting three full years), and permits one to simulate a positive effect of replacing the bottom 15% (in purely hypothetical terms, holding lots of stuff constant). But acting on this information, accepting a 1/5 misfire rate to generate a small marginal benefit, might still have a chilling effect on future teacher supply (given the extent that the error is entirely out of their control).

But the confidence interval is only one piece of the puzzle. It is the collective pieces of that puzzle that have led me to believe that the VA estimates are of limited if any value as a human resource management tool, as similarly concluded by Jesse Rothstein in his review of the first round of Gates MET findings.

We also know that if we were to use a different test of the supposed same content, we are quite likely to get different effectiveness ratings for teachers (either following the Gates MET findings, or the Corcoran & Jennings findings). That is, the present analysis tells us only whether there exists a certain level of confidence in the teacher ratings on a single instrument, which may or may not be the best assessment of teaching quality for that content area. Further test-test differences in teacher ratings may be caused by any number of factors. I would expect that test scaling differences as much as subtle content and question format differences, along with differences in the stakes attached lead to the difference in ratings across the same teachers when different tests are used. Given that the tests changed at different points in the CFR study, and there are likely at least some teachers who maintained constant assignments across those changes, CFR could explore shifts in VA estimates across different tests for the same teachers.  Next paper? (the current paper is already 5 or 6 rolled into one).

Also, as the CFR paper appropriately acknowledges, the VA estimates – and any resulting assumptions that they are valid – are contingent upon the fact that they were estimated to data retrospectively, using assessments for which there were no stakes attached – most importantly, where high stakes personnel decisions were not based on the tests.

And one final technical point, just because the model across all cases does not reveal any systematic patterns of bias does not mean that significant numbers of teacher cases within the mix would not have their ratings compromised by various types of biases (associated with either observables or unobservables). Yes, the bias, on average, is either a wash or drowned out by the noise. But there may be clusters of teachers serving clusters of students and/or in certain types of settings where the bias cuts one way or the other. This may be a huge issue if school officials are required to place heavy emphasis on these measures, and where some schools are affected by biased estimates (in any direction) and others not.

On the limited usefulness of VAM estimates

I do not deny, though I’m increasingly skeptical, that these models produce any useful information at the individual level. They do indeed, as CFR explain produce a prediction – with error – of the likelihood that a teacher produces higher or lower gains across students on a specific test or set of tests (for what that test is worth). That may be useful information. But that’s a very small piece of a much larger human resource puzzle. First of all, it’s very limited piece of information on a very small subset of teachers in schools.

While pundits often opine about the potential cost effectiveness of these statistical estimates for use in teacher evaluation versus more labor intensive observation protocols, we must consider in that cost effectiveness analysis that the VA estimates are capturing only effectiveness with respect to a) the specific tests in question (since other tests may yield very different results) and b) for a small share of our staff districtwide.

I do appreciate, and did recognize that the CFR paper doesn’t make a case for deselection with heavy emphasis on VA estimates. Rather, the paper ponders the policy implications in the typical way in which we academically speculate. That doesn’t always play well in the media – and certainly didn’t this time.

The problem – and a very big one – is that states (and districts) are actually mandating rigid use of these metrics including proposing that these metrics be used in layoff protocols (quality based RIF) – essentially deselection. Yes, most states are saying “use test-score based measures for 50%” and use other stuff for the other half.  And political supporters are arguing – “no-one is saying to use test scores as the only measure.” The reality is that when you put a rigid metric (and policymakers will ignore those error bands) into an evaluation protocol and combine it with less rigid, less quantified other measures the rigid metric will invariably become the tipping factor. It may be 50% of the protocol, but will drive 100% of the decision.

Also, state policymakers and local decision makers for the most part do not know the difference between a well estimated VAM, with appropriate checks for bias, and a Student Growth Percentile score – as being pitched to many state policymakers as a viable alternative and now adopted in many states – with no covariatesno published statistical evaluation on the properties, biases, etc.

Further, I would argue that there are actually perverse incentives for state policymakers and local district officials to adopt bad and/or severely biased VAMs because those VAMS are likely to appear more stable (less noisy) over time (because they will, year after year, inappropriately disadvantage the same teachers).

State policymakers are more than willing to make that completely unjustified leap that the CFR results necessarily indicate that Student Growth Percentiles – just like a well estimated (though still insufficient) VAM – can and should be used as blunt deselection tools (or tools for denying and/or removing tenure).

In short, even the best VAMs provide us with little more than noisy estimates of teaching effectiveness, measured by a single set of assessments, for a small share of teachers.

Given the body of research, now expanded with the CFR study, while I acknowledge that these models can pick up seemingly interesting variance across teachers, I stand by my perspective that that information is of extremely limited use for characterizing individual teacher effectiveness.

On the $250 calculation (and my real point)

My main point regarding the break down to $250 from $266k was that the $266k was generated for WOW effect, from an otherwise non-startling number (be it $1,000 or $250). It’s the intentional exaggeration by extrapolation that concerns me, like stretching the Y axes in the NY Times story (theirs, not yours). True, I simplified and didn’t discount (via an arbitrary 5%) and instead did a simple back of the napkin that would then reconcile, for the readers, with the related graph – which shows about a $250 shift in earnings at age 28 (but stretches the Y axis to also exaggerate the effect).  It is perhaps more reasonable to point out that this is about a $250 shift over $20,500, or slightly greater than 1.2%?

I agree that when we see shifts even this seemingly subtle, in large data sets and in this type of analysis, they may be meaningful shifts. And I recognize that researchers try to find alternative ways to illustrate the magnitude of those shifts. But, in the context of the NY Times story, this one came off as stretching the meaningfulness of the estimate – multiplying it just enough times  (by the whole class then by lifetime) to make it seem much bigger, and therefore much more meaningful.  That was easy blog fodder. But again, I put it down in that section of my critique focused on the presentation, not the substance.

If I was a district personnel director would I want these data? Would I use them? How?

This is one that I’ve thought about quite a bit.

Yes, probably. I would want to be able to generate a report of the VA estimates for teachers in the district. Ideally, I’d like to be able to generate a report based on alternative model specifications (option to leave in and take out potential biases) and on alternative assessments (or mixes of them). I’d like the sensitivity analysis option in order to evaluate the robustness of the ratings, and to see how changes to model specification affect certain teachers (to gain insights, for example, regarding things like peer effect vs. teacher effect).

If I felt, when pouring through the data, that they were telling me something about some of my teachers (good or bad), I might then use these data to suggest to principals how to distribute their observation efforts through the year. Which classes should they focus on? Which teachers? It would be a noisy pre-screening tool, and would not dictate any final decision.  It might start the evaluation process, but would certainly not end it.

Further, even if I did decide that I have a systematically underperforming middle school math teacher (for example), I would only be likely to try to remove that teacher if I was pretty sure that I could replace him or her with someone better. It is utterly foolish from a human resource perspective to automatically assume that I will necessarily be able to replace this “bad” teacher with an “average” one.  Fire now, and then wait to see what the applicant pool looks like and hope for the best?

Since the most vocal VAM advocates love to make the baseball analogies… pointing out the supposed connection between VAM teacher deselection arguments and Moneyball, consider that statistical advantage in Baseball is achieved by trading for players with better statistics – trading up (based on which statistics a team prefers/needs).  You don’t just unload your bottom 5%  or 15% players in on-base-percentage and hope that players with on-base-percentage equal to your team average will show up on your doorstep. (acknowledging that the baseball statistics analogies to using VAM for teacher evaluation to begin with are completely stupid)

Unfortunately, state policymakers are not viewing it this way – not seeking reasonable introduction of new information into a complex human resource evaluation process. Rather, they are rapidly adopting excessively rigid mandates regarding the use of VA estimates or Student Growth Percentiles as the major component of teacher evaluation, determination of teacher tenure and dismissal. And unfortunately, they are misreading and misrepresenting (in my view) the CFR study to drive home their case.