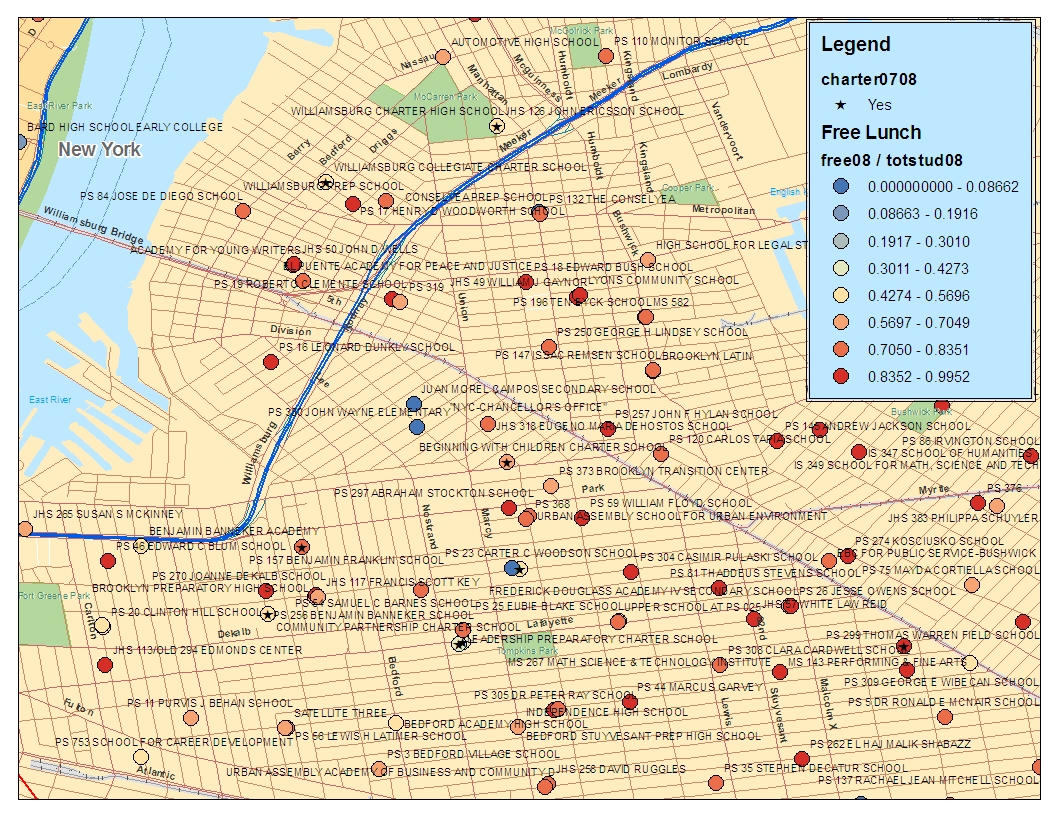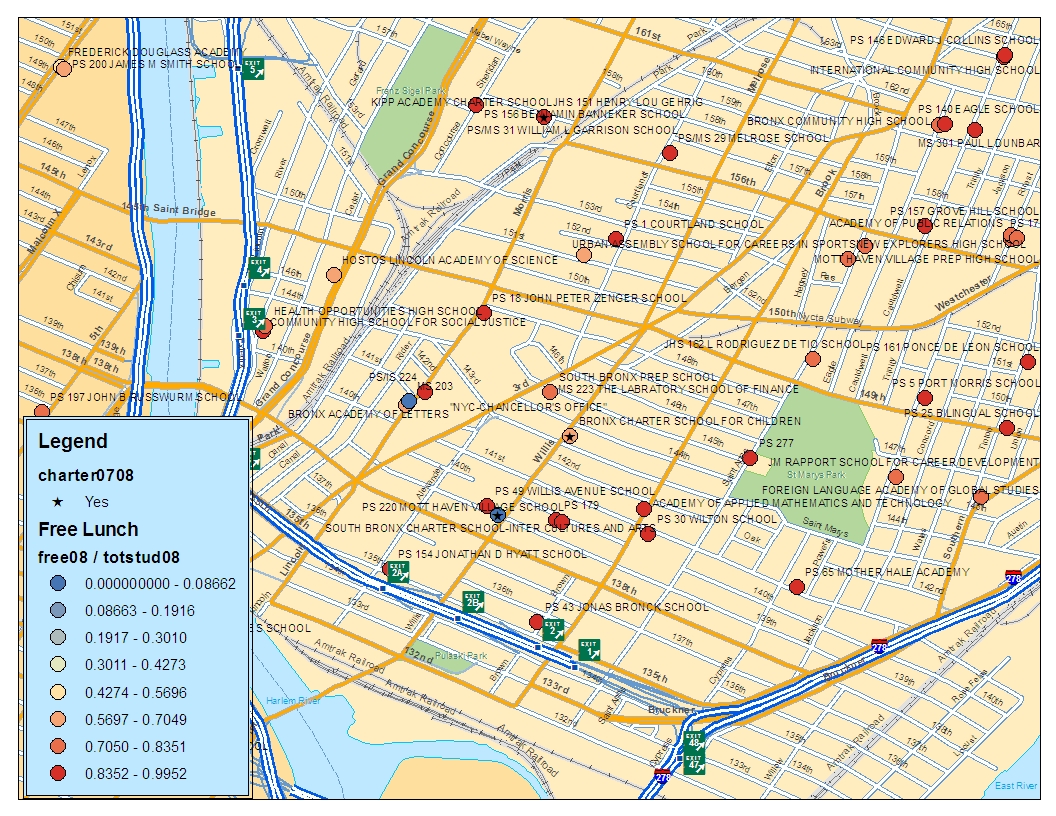
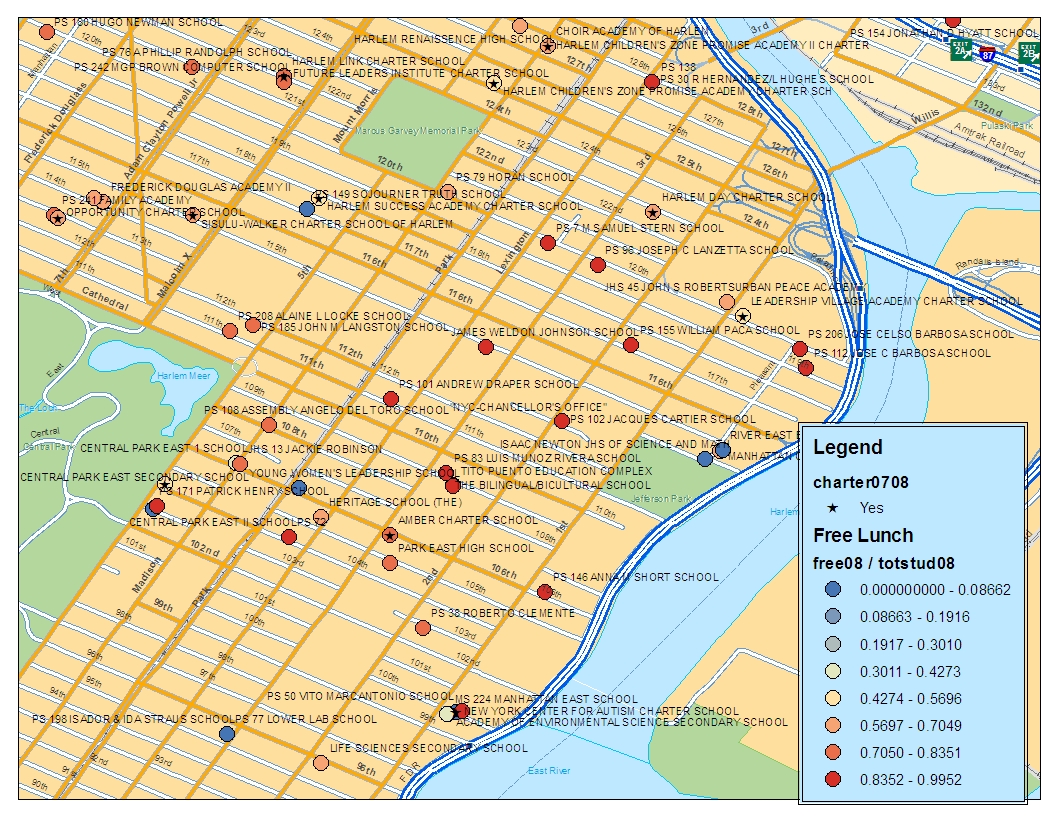
Just for fun, here are a few maps of New York City traditional public, special public and public charter schools. Charter schools are indicated with an asterisk. School level rates of children qualifying for free lunch are indicated by circle color. Deep red circles have free lunch shares over 83.6%. Blue circles have very low free lunch shares. Free lunch shares and school locations (lat / lon) are from the National Center for Education Statistics Common Core – Public School Universe 2007-08. Note that as with my previous NJ charter slides, NYC charter schools tend to serve somewhat lower shares of children qualifying for free lunch than are served by many of the surrounding traditional public schools.
Today’s fun maps: NYC charter school free lunch rates
Published by schoolfinance101
Bruce D. Baker is Professor in the Department of Teaching and Learning at the University of Miami and co-director and creator of the School Finance Indicators Database. Widely regarded as the nation's leading scholar on the financing of public elementary and secondary education, he has served as an expert witness in school funding litigation in more than a dozen states and has advised legislatures nationwide on funding formula design. His influence extends beyond the United States: he is collaborating with the World Bank on a global indicator system for evaluating educational adequacy. A 2024 Fellow of the American Educational Research Association, he is the author of three books from Harvard Education Press, most recently Segregation & School Funding (2026, with Matthew Di Carlo), and nearly 90 peer-reviewed journal and law review articles. View all posts by schoolfinance101