Here it is – my annual update of America’s most screwed school districts. This time, for stability purposes, I’ve used a 3-year average based on 2009-2011 data (2011 data being released earlier this week).
As I’ve explained in my previous posts on this topic (from last year’s post on screwed districts)…
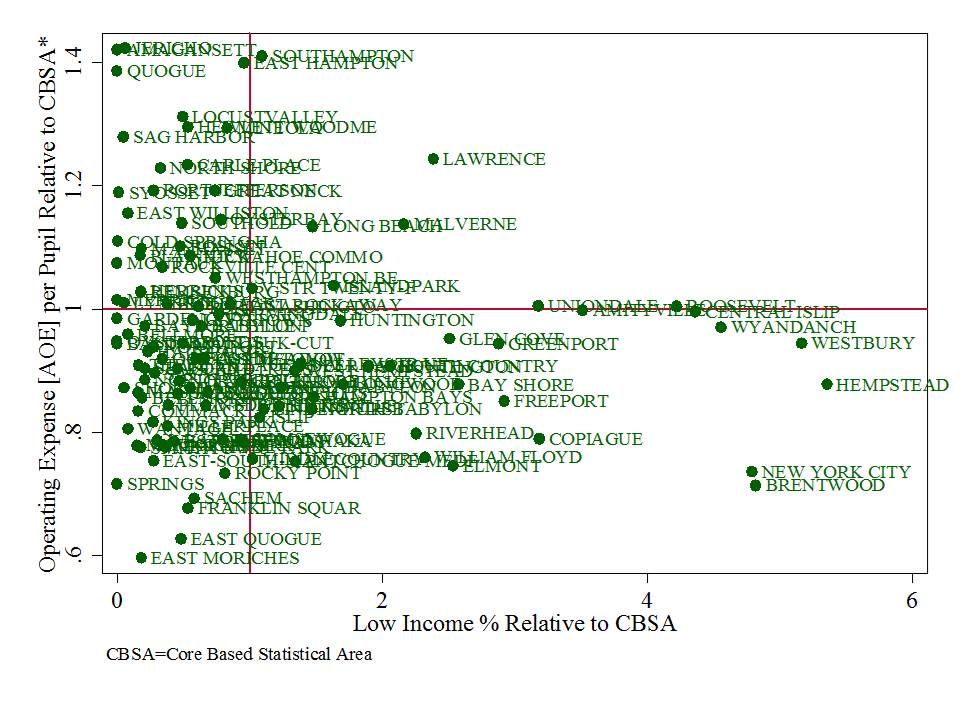
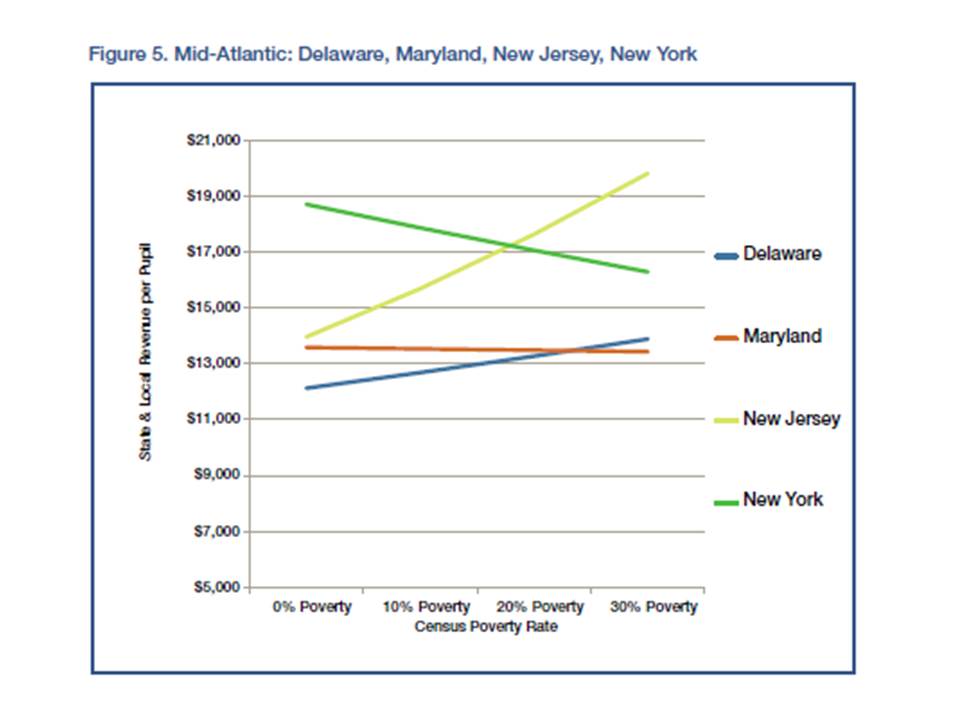
It’s important to understand that the value of any given level of education funding, in any given location, is relative. That is, it doesn’t simply matter that a district has or spends $10,000 per pupil, or $20,000 per pupil. What matters is how that funding compares to other districts operating in the same labor market, and for that matter, how that money relates to other conditions in the region/labor market. Why? Well, schooling is labor intensive. And the quality of schooling depends largely on the ability of schools or districts to recruit and retain quality employees. And yes… despite reformy arguments to the contrary – competitive wages for teachers matter! The largest share of school district annual operating budgets is tied up in the salaries and wages of teachers and other school workers. The ability to recruit and retain teachers in a school district in any given labor market depends on the wage a district can pay to teachers a) relative to other surrounding schools/districts and b) relative to non-teaching alternatives in the same labor market.
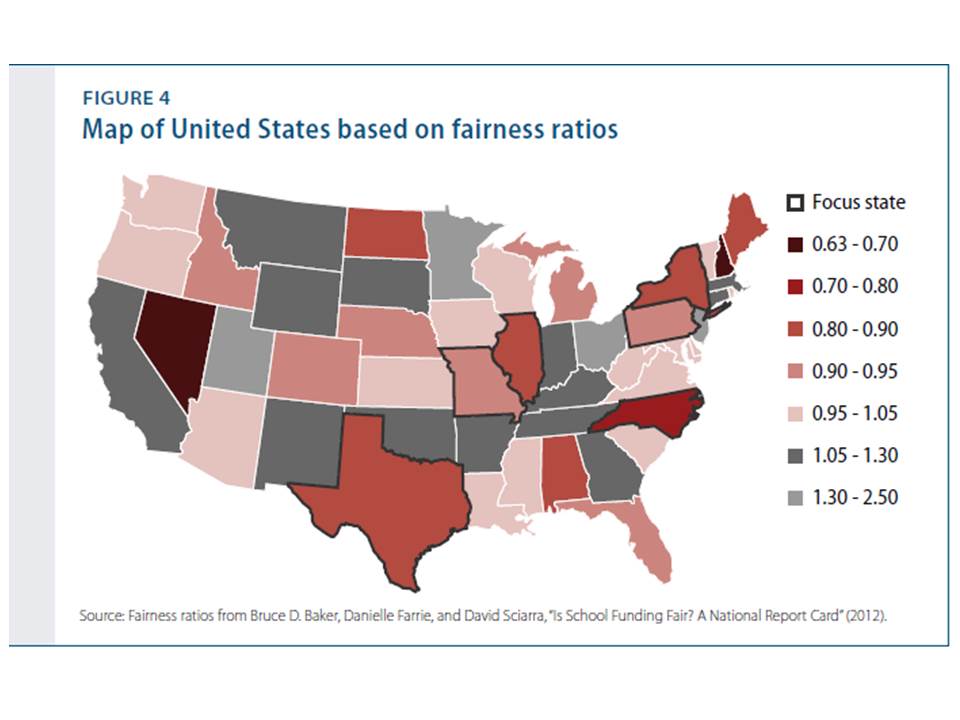
In our funding fairness report, we present statewide profiles of disparities in funding with respect to poverty. But, I thought it would be fun (albeit rather depressing) here to try to identify some of the least well-funded districts in the country. Now, keep in mind that there are still around 15,000 districts nationwide.
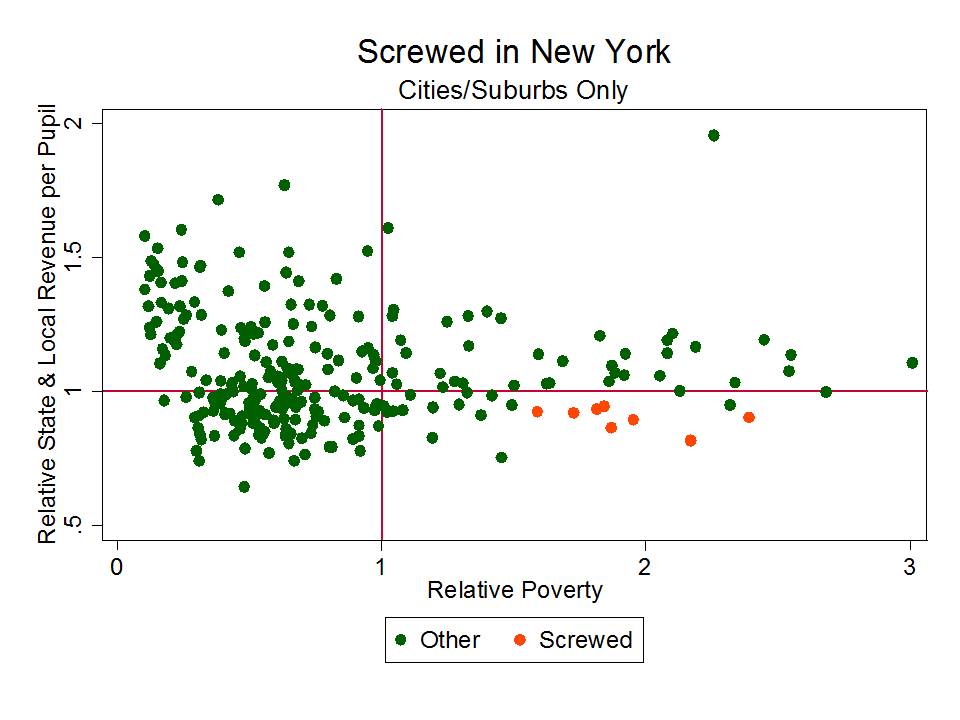
Here is this year’s empirical definition of “screwed” in school finance terms:
- State and Local Revenue per Pupil (Census Fiscal Survey, 3-year Average) less than 95% of average for districts in the same labor market*
- Adjusted Census Poverty Rate for 5 to 17 year olds (Census Small Area Income and Poverty Estimates, 3-year average) greater than 50% above average for districts in the same labor market.
*where “labor market” is defined as it is defined in the NCES Education Comparable Wage Index (essentially by core based statistical area for all districts in metropolitan or micropolitan areas).
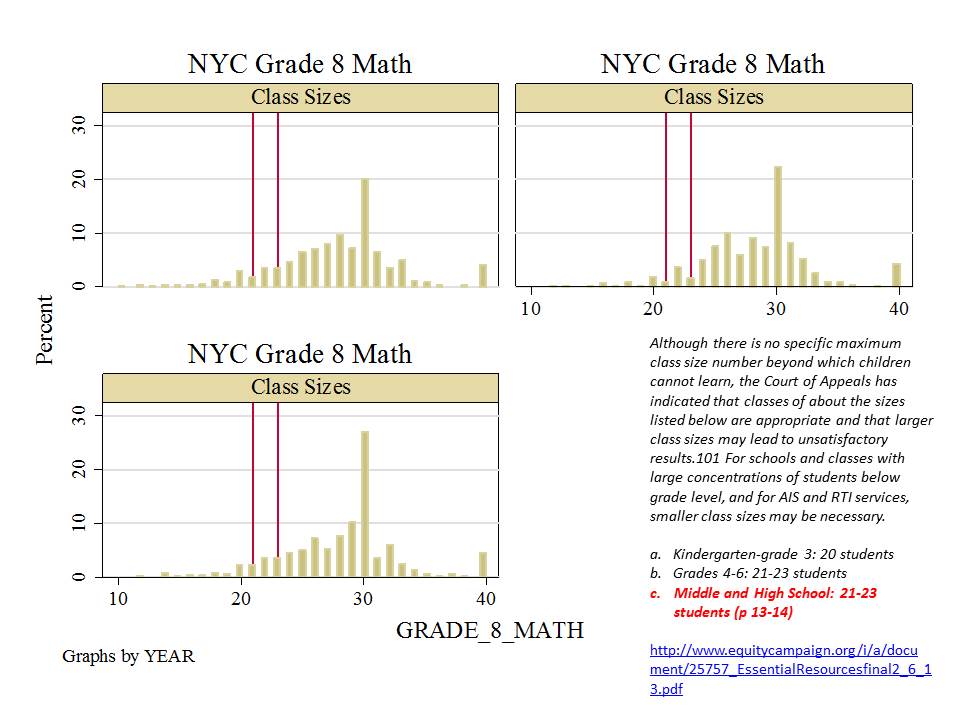
Put very simply, districts with higher student needs than surrounding districts in the same labor market don’t just require the same total revenue per pupil to get the job done. They require more. Higher need districts require more money simply to recruit and retain similar quantities (per pupil) of similar quality teachers. That is, they need to be able to pay a wage premium. In addition, higher need districts need to be able to both provide the additional program/service supports necessary for helping kids from disadvantaged backgrounds (including smaller classes in early grades) while still maintaining advanced and enriched course options.
The districts in this table not only don’t have the “same” total state and local revenue per pupil than surrounding districts. They have less and in some cases they have a lot less! In many cases their child poverty rate is more than twice that of the surrounding districts that continue to have more resources.
| State, District | Relative Poverty | Relative State & Local Revenue |
| Alabama,Bessemer City School District | 2.046 | 0.837 |
| Alabama,Fairfield City School District | 1.562 | 0.803 |
| Arizona,Sunnyside Unified District | 1.681 | 0.816 |
| California,Bayshore Elementary School D | 1.579 | 0.718 |
| California,Ravenswood City Elementary S | 1.715 | 0.749 |
| California,West Fresno Elementary Schoo | 1.793 | 0.739 |
| Colorado,Adams-Arapahoe School District | 1.758 | 0.915 |
| Connecticut,Bridgeport School District | 2.626 | 0.863 |
| Connecticut,East Hartford School Distri | 1.651 | 0.86 |
| Connecticut,New Britain School District | 2.427 | 0.903 |
| Connecticut,Waterbury School District | 1.849 | 0.871 |
| Delaware,Colonial School District | 1.573 | 0.94 |
| Georgia,Spalding County School District | 1.578 | 0.876 |
| Idaho,Caldwell School District 132 | 1.925 | 0.875 |
| Illinois,Chicago Public School District | 1.663 | 0.825 |
| Illinois,Granite City Community Unit Sc | 1.515 | 0.823 |
| Illinois,Kankakee School District 111 | 1.681 | 0.943 |
| Illinois,North Chicago School District | 2.174 | 0.857 |
| Illinois,Round Lake Community Unit Scho | 1.836 | 0.733 |
| Illinois,Waukegan Community Unit School | 2.044 | 0.722 |
| Indiana,Edinburgh Community School Corp | 1.709 | 0.912 |
| Indiana,Hammond School City | 1.547 | 0.948 |
| Indiana,River Forest Community School C | 1.598 | 0.941 |
| Kentucky,Dayton Independent School Dist | 1.861 | 0.797 |
| Massachusetts,Blackstone-Millville Scho | 1.804 | 0.918 |
| Massachusetts,Dennis-Yarmouth School Di | 1.509 | 0.95 |
| Massachusetts,Everett School District | 2.295 | 0.833 |
| Massachusetts,Lowell School District | 2.425 | 0.898 |
| Massachusetts,Revere School District | 1.774 | 0.807 |
| Massachusetts,Webster School District | 1.697 | 0.909 |
| Michigan,Clarenceville School District | 1.634 | 0.945 |
| Michigan,Clintondale Community Schools | 1.789 | 0.829 |
| Michigan,East Detroit Public Schools | 1.803 | 0.864 |
| Michigan,Godfrey-Lee Public Schools | 1.893 | 0.913 |
| Michigan,Hamtramck Public Schools | 2.114 | 0.793 |
| Michigan,Inkster City School District | 1.519 | 0.837 |
| Michigan,Kelloggsville Public Schools | 1.589 | 0.929 |
| Michigan,Madison Public Schools | 1.914 | 0.908 |
| Michigan,Port Huron Area School Distric | 1.814 | 0.775 |
| Michigan,Roseville Community Schools | 1.638 | 0.924 |
| Missouri,Independence Public Schools | 1.622 | 0.943 |
| Missouri,Jennings School District | 2.086 | 0.891 |
| Missouri,Ritenour School District | 1.5 | 0.896 |
| Missouri,Riverview Gardens School Distr | 1.979 | 0.853 |
| New Hampshire,Manchester School Distric | 1.826 | 0.85 |
| New Hampshire,Rochester School District | 1.826 | 0.87 |
| New Hampshire,Somersworth School Distri | 1.615 | 0.899 |
| New Jersey,Bound Brook Borough School D | 1.727 | 0.929 |
| New Jersey,Carteret Borough School Dist | 1.781 | 0.873 |
| New Jersey,Irvington Township School Di | 2.023 | 0.906 |
| New Jersey,Penns Grove-Carneys Point Re | 1.57 | 0.929 |
| New Jersey,Pennsauken Township School D | 1.605 | 0.939 |
| New Jersey,South Amboy City School Dist | 1.705 | 0.895 |
| New Jersey,Woodbury City School Distric | 1.565 | 0.946 |
| New York,Binghamton City School Distric | 1.815 | 0.936 |
| New York,Brentwood Union Free School Di | 2.17 | 0.817 |
| New York,Copiague Union Free School Dis | 1.844 | 0.945 |
| New York,Lansingburgh Central School Di | 1.953 | 0.895 |
| New York,Schenectady City School Distri | 2.39 | 0.903 |
| New York,Utica City School District | 1.87 | 0.865 |
| New York,Watervliet City School Distric | 1.59 | 0.925 |
| New York,William Floyd (Mastic Beach) U | 1.727 | 0.919 |
| North Carolina,Kannapolis City Schools | 1.529 | 0.688 |
| Ohio,Campbell City School District | 1.509 | 0.9 |
| Ohio,Clearview Local School District | 1.628 | 0.66 |
| Ohio,New Miami Local School District | 1.909 | 0.827 |
| Ohio,Northridge Local School District | 2.173 | 0.915 |
| Ohio,Painesville City Local School Dist | 1.667 | 0.946 |
| Oregon,Centennial School District 28J | 1.621 | 0.9 |
| Oregon,David Douglas School District 40 | 2.008 | 0.933 |
| Oregon,Reynolds School District 7 | 1.974 | 0.927 |
| Pennsylvania,Allentown City School Dist | 2.417 | 0.784 |
| Pennsylvania,Big Beaver Falls Area Scho | 1.811 | 0.93 |
| Pennsylvania,Connellsville Area School | 1.926 | 0.874 |
| Pennsylvania,Highlands School District | 1.517 | 0.907 |
| Pennsylvania,Laurel Highlands School Di | 1.564 | 0.82 |
| Pennsylvania,Lebanon School District | 2.143 | 0.919 |
| Pennsylvania,McKeesport Area School Dis | 1.927 | 0.947 |
| Pennsylvania,New Kensington-Arnold Scho | 1.91 | 0.932 |
| Pennsylvania,Philadelphia City School D | 2.115 | 0.905 |
| Pennsylvania,Reading School District | 2.39 | 0.792 |
| Pennsylvania,Uniontown Area School Dist | 1.963 | 0.857 |
| Rhode Island,Pawtucket School District | 1.604 | 0.793 |
| Rhode Island,Woonsocket School District | 1.983 | 0.764 |
| Tennessee,Hawkins County School Distric | 1.552 | 0.863 |
| Texas,Aldine Independent School Distric | 1.634 | 0.917 |
| Texas,Alief Independent School District | 1.597 | 0.93 |
| Texas,Castleberry Independent School Di | 1.575 | 0.897 |
| Texas,Dallas Independent School Distric | 1.871 | 0.95 |
| Texas,Edgewood Independent School Distr | 1.772 | 0.944 |
| Texas,Fort Worth Independent School Dis | 1.654 | 0.935 |
| Texas,North Forest Independent School D | 1.942 | 0.904 |
| Texas,San Antonio Independent School Di | 1.698 | 0.891 |
| Vermont,Winooski Incorporated School Di | 2.818 | 0.867 |
| Virginia,Fredericksburg City Public Sch | 2.411 | 0.806 |
| Virginia,Hopewell City Public Schools | 1.94 | 0.92 |
| Virginia,Manassas City Public Schools | 1.548 | 0.936 |
| Virginia,Norfolk City Public Schools | 1.681 | 0.939 |
List includes only those districts with Urban Centric Locale Codes for Cities (11,12,13) or Suburbs (21,22,23).
And here’s a list of the states with the largest shares of children attending “screwed” districts:
| State | % Attending Screwed Districts |
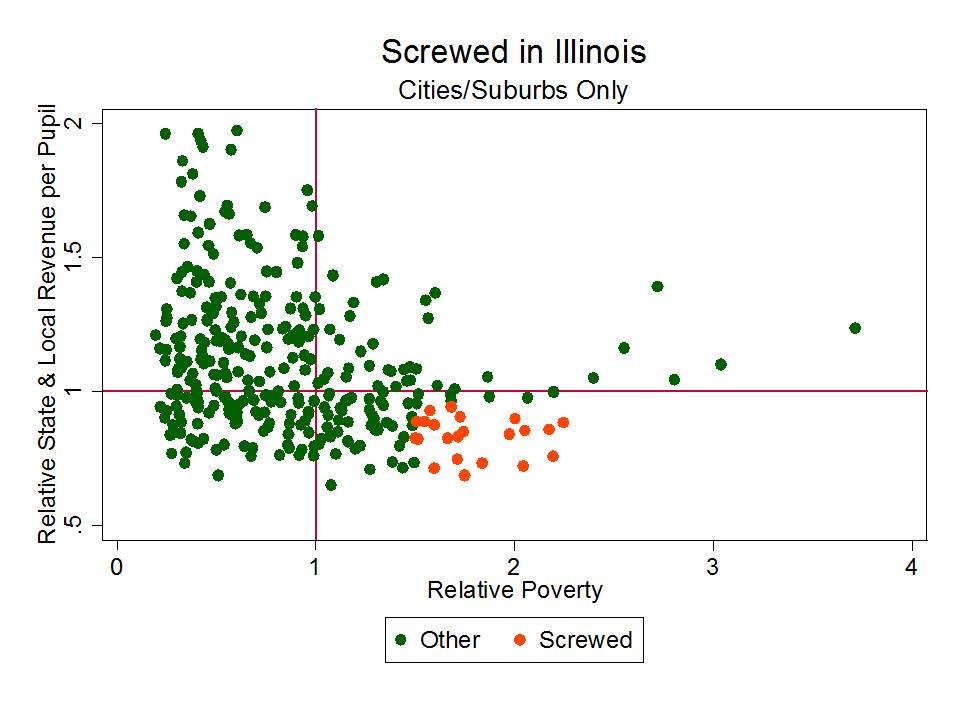
| Illinois | 24% |
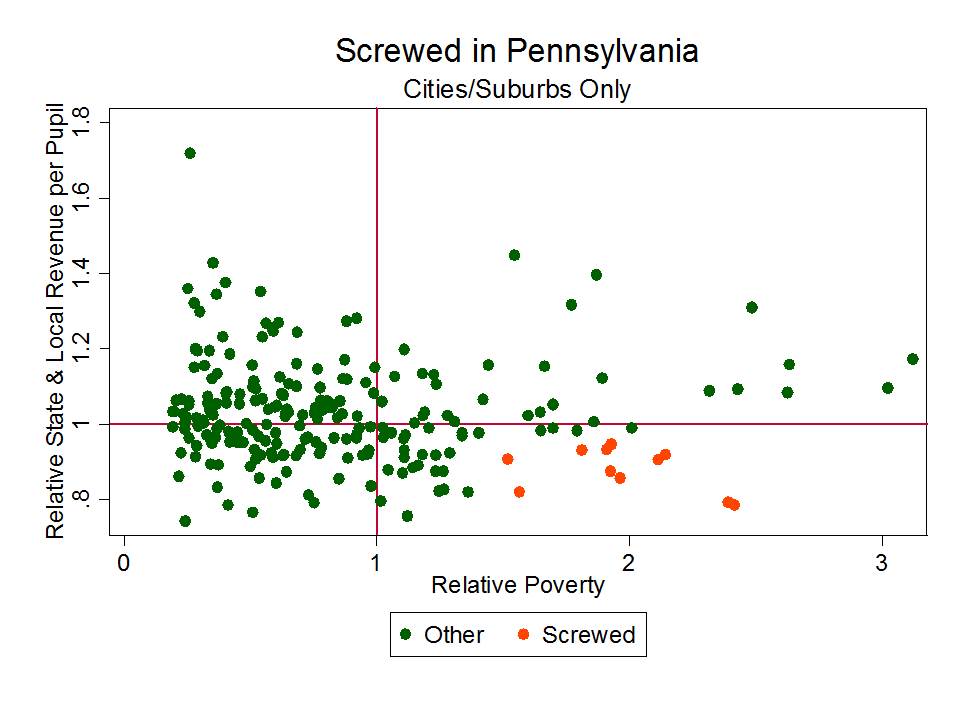
| Pennsylvania | 15% |
| New Hampshire | 15% |
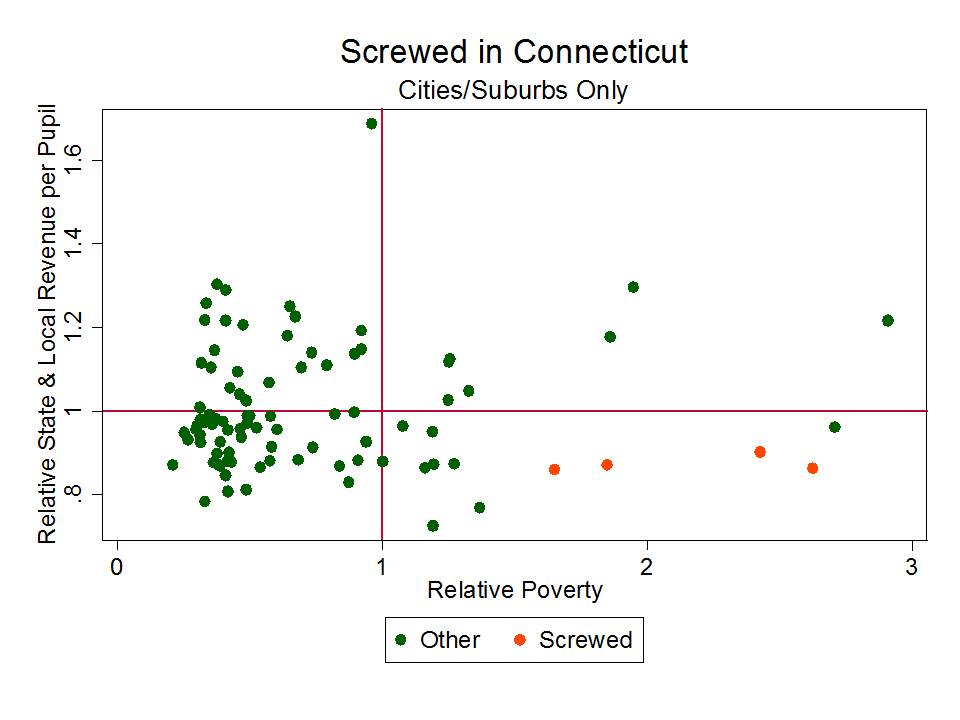
| Connecticut | 12% |
| Delaware | 12% |
| West Virginia | 11% |
| Rhode Island | 11% |
| Texas | 9% |
| Arizona | 9% |
| Vermont | 6% |
| Oregon | 5% |
| Colorado | 5% |
| Missouri | 5% |
Here are the patterns of “screwedness” in states which seem to have relatively large numbers of screwed districts.
In short – school funding disparities are alive and well – and certainly don’t appear to by improving substantively in recent years. More on that at a later point.