Blog

How and Why Money Matters in Schools (one more time – updated)

This post is taken from a forthcoming report in which I summarize literature related to state school finance reforms and explore relationships between changing distributions of funding and distributions of tangible classroom level resources. The newly released Jackson, Johnson and Persico NBER paper speaks to similar issues and is included in the discussion that follows:

==========

In a comprehensive review of literature addressing the question “Does Money Matter in Education?” in 2012, Baker concluded:

            To be blunt, money does matter. Schools and districts with more money clearly have greater ability to provide higher-quality, broader, and deeper educational opportunities to the children they serve. Furthermore, in the absence of money, or in the aftermath of deep cuts to existing funding, schools are unable to do many of the things they need to do in order to maintain quality educational opportunities. Without funding, efficiency tradeoffs and innovations being broadly endorsed are suspect. One cannot tradeoff spending money on class size reductions against increasing teacher salaries to improve teacher quality if funding is not there for either – if class sizes are already large and teacher salaries non-competitive. While these are not the conditions faced by all districts, they are faced by many.

Building on the findings and justifications provided by Baker (2012), we offer Figure 4 as a simple model of the relationship of schooling resources to children’s measurable school achievement outcomes. First, the fiscal capacity of states – their wealth and income – does affect their ability to finance public education systems. But, as we have shown in related research, on which we expand herein, the effort put forth in state and local tax policy plays an equal role.

Figure 4

how schools work

The amount of state and local revenue raised drives the majority of current spending of local public school districts, because federal aid constitutes such a relatively small share. Further, the amount of money a district is able spend on current operations determines the staffing ratios, class sizes and wages a local public school district is able to pay. Indeed, there are tradeoffs to be made between staffing ratios and wage levels. Finally, as noted above, a sizable body of research illustrates the connection between staffing qualities and quantities and student outcomes.

The connections laid out in this model seem rather obvious. How much you raise dictates how much you can spend. How much you spend – in a labor intensive industry dictates how many individuals you can employ, the wage you can pay them, and in turn the quality of individuals you can recruit and retain. But in this modern era of resource-free school “reforms” the connections between revenue, spending and real, tangible resources are often ignored, or worse, argued to be irrelevant. A common theme advanced in modern political discourse is that all schools and districts already have more than enough money to get the job done. They simply need to use it more wisely and adjust to the “new normal.”[i]

But, on closer inspection of the levels of funding available across states and local public school districts within states, this argument rings hollow. To illustrate, we spend a significant portion of this report statistically documenting these connections. First, we take a quick look at existing literature on the relevance of state school finance systems, and reform of those systems for improving the level and distribution of student outcomes, and literature on the importance of class sizes and teacher wages for improving school quality as measured by student outcomes.

Equitable and Adequate Funding

There exists an increasing body of evidence that substantive and sustained state school finance reforms matter for improving both the level and distribution of short-term and long-run student outcomes. A few studies have attempted to tackle school finance reforms broadly applying multi-state analyses over time. Card and Payne (2002) found “evidence that equalization of spending levels leads to a narrowing of test score outcomes across family background groups.”[ii] (p. 49) Most recently, Jackson, Johnson & Persico (2015) evaluated long-term outcomes of children exposed to court-ordered school finance reforms, finding that “a 10 percent increase in per-pupil spending each year for all twelve years of public school leads to 0.27 more completed years of education, 7.25 percent higher wages, and a 3.67 percentage-point reduction in the annual incidence of adult poverty; effects are much more pronounced for children from low-income families.”(p. 1) [iii]

Numerous other researchers have explored the effects of specific state school finance reforms over time. [iv] Several such studies provide compelling evidence of the potential positive effects of school finance reforms. Studies of Michigan school finance reforms in the 1990s have shown positive effects on student performance in both the previously lowest spending districts, [v] and previously lower performing districts. [vi] Similarly, a study of Kansas school finance reforms in the 1990s, which also involved primarily a leveling up of low-spending districts, found that a 20 percent increase in spending was associated with a 5 percent increase in the likelihood of students going on to postsecondary education.[vii]

Three studies of Massachusetts school finance reforms from the 1990s find similar results. The first, by Thomas Downes and colleagues found that the combination of funding and accountability reforms “has been successful in raising the achievement of students in the previously low-spending districts.” (p. 5)[viii] The second found that “increases in per-pupil spending led to significant increases in math, reading, science, and social studies test scores for 4th- and 8th-grade students.”[ix] The most recent of the three, published in 2014 in the Journal of Education Finance, found that “changes in the state education aid following the education reform resulted in significantly higher student performance.”(p. 297)[x] Such findings have been replicated in other states, including Vermont. [xi]

On balance, it is safe to say that a sizeable and growing body of rigorous empirical literature validates that state school finance reforms can have substantive, positive effects on student outcomes, including reductions in outcome disparities or increases in overall outcome levels.[xii]

Class Sizes and Teacher Salaries

The premise that money matters for improving school quality is grounded in the assumption that having more money provides schools and districts the opportunity to improve the qualities and quantities of real resources. Jackson, Johnson and Persico (2015) explain that the spending increases they found to be associated with long term benefits “were associated with sizable improvements in measured school quality, including reductions in student-to-teacher ratios, increases in teacher salaries, and longer school years.” (p. 1)

The primary resources involved in the production of schooling outcomes are human resources – or quantities and qualities of teachers, administrators, support and other staff in schools. Quantities of school staff are reflected in pupil to teacher ratios and average class sizes. Reduction of class sizes or reductions of overall pupil to staff ratios require additional staff, thus additional money, assuming the wages and benefits for additional staff remain constant. Qualities of school staff depend in part on the compensation available to recruit and retain them – specifically salaries and benefits, in addition to working conditions. Notably, working conditions may be reflected in part through measures of workload, like average class sizes, as well as the composition of the student population.

A substantial body of literature has accumulated to validate the conclusion that both teachers’ overall wages and relative wages affect the quality of those who choose to enter the teaching profession, and whether they stay once they get in. For example, Murnane and Olson (1989) found that salaries affect the decision to enter teaching and the duration of the teaching career,[xiii] while Figlio (1997, 2002) and Ferguson (1991) concluded that higher salaries are associated with more qualified teachers.[xiv] In addition, more recent studies have tackled the specific issues of relative pay noted above. Loeb and Page showed that:

“Once we adjust for labor market factors, we estimate that raising teacher wages by 10 percent reduces high school dropout rates by 3 percent to 4 percent. Our findings suggest that previous studies have failed to produce robust estimates because they lack adequate controls for non-wage aspects of teaching and market differences in alternative occupational opportunities.”[xv]

In short, while salaries are not the only factor involved, they do affect the quality of the teaching workforce, which in turn affects student outcomes.

Research on the flip side of this issue – evaluating spending constraints or reductions – reveals the potential harm to teaching quality that flows from leveling down or reducing spending. For example, David Figlio and Kim Rueben (2001) note that, “Using data from the National Center for Education Statistics we find that tax limits systematically reduce the average quality of education majors, as well as new public school teachers in states that have passed these limits.”[xvi]

Salaries also play a potentially important role in improving the equity of student outcomes. While several studies show that higher salaries relative to labor market norms can draw higher quality candidates into teaching, the evidence also indicates that relative teacher salaries across schools and districts may influence the distribution of teaching quality. For example, Ondrich, Pas and Yinger (2008) “find that teachers in districts with higher salaries relative to non-teaching salaries in the same county are less likely to leave teaching and that a teacher is less likely to change districts when he or she teaches in a district near the top of the teacher salary distribution in that county.”[xvii]

In addition, ample research indicates that children in smaller classes achieve better outcomes, both academic and otherwise, and that class size reduction can be an effective strategy for closing racial or socio-economic achievement gaps. [xviii] While it’s certainly plausible that other uses of the same money might be equally or even more effective, there is little evidence to support this. For example, while we are quite confident that higher teacher salaries may lead to increases in the quality of applicants to the teaching profession and increases in student outcomes, we do not know whether the same money spent toward salary increases would achieve better or worse outcomes if it were spent toward class size reduction. Indeed, some have raised concerns that large scale-class size reductions can lead to unintended labor market consequences that offset some of the gains attributable to class size reduction (such as the inability to recruit enough fully qualified teachers).[xix] And many, over time, have argued the need for more precise cost/benefit analysis. [xx] Still, the preponderance of existing evidence suggests that the additional resources expended on class size reductions do result in positive effects.

Both reductions to class sizes and improvements to competitive wages can yield improved outcomes, but the efficiency gains of choosing one strategy over the other are unclear, and local public school districts rarely have complete flexibility to make tradeoffs.[xxi] Class size reduction may be constrained by available classrooms. Smaller class sizes and reduced total student loads are a relevant working condition simultaneously influencing teacher recruitment and retention.[xxii] That is, providing smaller classes may partly offset the need for higher wages for recruiting or retaining teachers. High poverty schools require a both/and rather than either/or strategy when it comes to smaller classes and competitive wages.

[i] Baker, B., & Welner, K. G. (2012). Evidence and rigor scrutinizing the rhetorical embrace of evidence-based decision making. Educational Researcher, 41(3), 98-101.

[ii] Card, D., and Payne, A. A. (2002). School Finance Reform, the Distribution of School Spending, and the Distribution of Student Test Scores. Journal of Public Economics, 83(1), 49-82.

[iii] Jackson, C. K., Johnson, R., & Persico, C. (2014). The Effect of School Finance Reforms on the Distribution of Spending, Academic Achievement, and Adult Outcomes (No. w20118). National Bureau of Economic Research.

Jackson, C. K., Johnson, R., & Persico, C. (2015). The Effects of School Spending on Educational and Economic Outcomes: Evidence from School Finance Reforms (No. w 20847) National Bureau of Economic Research.

[iv] Figlio (2004) explains that the influence of state school finance reforms on student outcomes is perhaps better measured within states over time, explaining that national studies of the type attempted by Card and Payne confront problems of a) the enormous diversity in the nature of state aid reform plans, and b) the paucity of national level student performance data.

Figlio, D. N. (2004) Funding and Accountability: Some Conceptual and Technical Issues in State Aid Reform. In Yinger, J. (Ed.) p. 87-111 Helping Children Left Behind: State Aid and the Pursuit of Educational Equity. MIT Press.

[v] Roy, J. (2011). Impact of school finance reform on resource equalization and academic performance: Evidence from Michigan. Education Finance and Policy, 6(2), 137-167.

Roy (2011) published an analysis of the effects of Michigan’s 1990s school finance reforms which led to a significant leveling up for previously low-spending districts. Roy, whose analyses measure both whether the policy resulted in changes in funding and who was affected, found that “Proposal A was quite successful in reducing interdistrict spending disparities. There was also a significant positive effect on student performance in the lowest-spending districts as measured in state tests.” (p. 137)

[vi] Papke, L. (2005). The effects of spending on test pass rates: evidence from Michigan. Journal of Public Economics, 89(5-6). 821-839.

Hyman, J. (2013). Does Money Matter in the Long Run? Effects of School Spending on Educational Attainment. http://www-personal.umich.edu/~jmhyman/Hyman_JMP.pdf.

Papke (2001), also evaluating Michigan school finance reforms from the 1990s, found that “increases in spending have nontrivial, statistically significant effects on math test pass rates, and the effects are largest for schools with initially poor performance.” (p. 821)

Most recently, Hyman (2013) also found positive effects of Michigan school finance reforms in the 1990s, but raised some concerns regarding the distribution of those effects. Hyman found that much of the increase was targeted to schools serving fewer low income children. But, the study did find that students exposed to an additional “12%, more spending per year during grades four through seven experienced a 3.9 percentage point increase in the probability of enrolling in college, and a 2.5 percentage point increase in the probability of earning a degree.” (p. 1)

[vii] Deke, J. (2003). A study of the impact of public school spending on postsecondary educational attainment using statewide school district refinancing in Kansas, Economics of Education Review, 22(3), 275-284. (p. 275)

[viii] Downes, T. A., Zabel, J., and Ansel, D. (2009). Incomplete Grade: Massachusetts Education Reform at 15. Boston, MA. MassINC.

[ix] Guryan, J. (2001). Does Money Matter? Estimates from Education Finance Reform in Massachusetts. Working Paper No. 8269. Cambridge, MA: National Bureau of Economic Research.

“The magnitudes imply a $1,000 increase in per-pupil spending leads to about a third to a half of a standard-deviation increase in average test scores. It is noted that the state aid driving the estimates is targeted to under-funded school districts, which may have atypical returns to additional expenditures.” (p. 1)

[x] Nguyen-Hoang, P., & Yinger, J. (2014). Education Finance Reform, Local Behavior, and Student Performance in Massachusetts. Journal of Education Finance, 39(4), 297-322.

[xi] Downes had conducted earlier studies of Vermont school finance reforms in the late 1990s (Act 60). In a 2004 book chapter, Downes noted “All of the evidence cited in this paper supports the conclusion that Act 60 has dramatically reduced dispersion in education spending and has done this by weakening the link between spending and property wealth. Further, the regressions presented in this paper offer some evidence that student performance has become more equal in the post-Act 60 period. And no results support the conclusion that Act 60 has contributed to increased dispersion in performance.” (p. 312)

Downes, T. A. (2004). School Finance Reform and School Quality: Lessons from Vermont. In Yinger, J. (Ed.), Helping Children Left Behind: State Aid and the Pursuit of Educational Equity. Cambridge, MA: MIT Press.

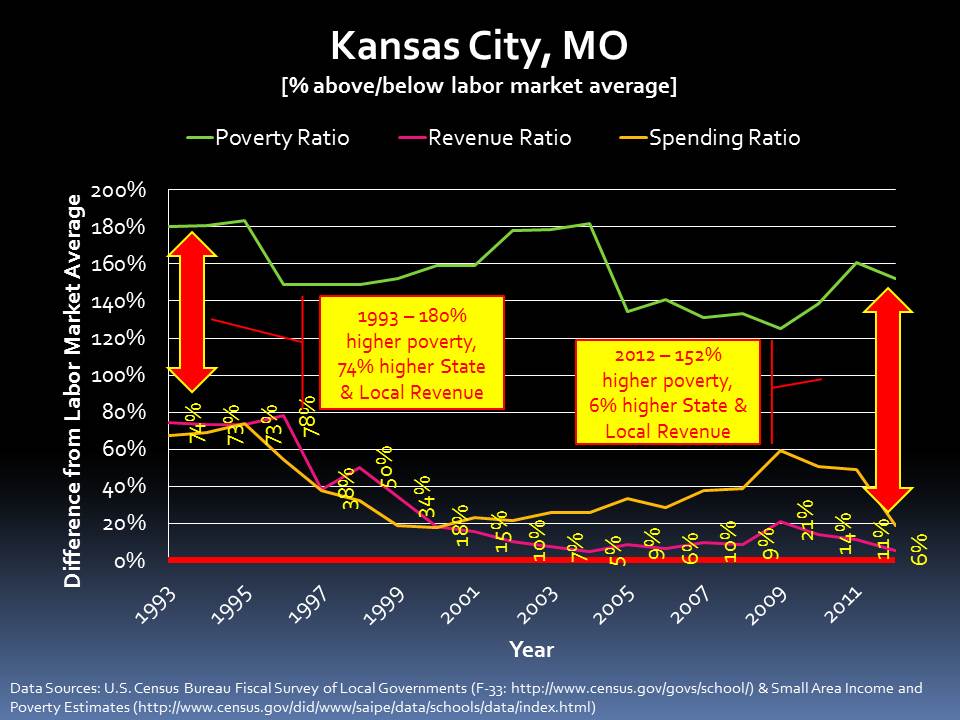
[xii] Indeed, this point is not without some controversy, much of which is readily discarded. Second-hand references to dreadful failures following massive infusions of new funding can often be traced to methodologically inept, anecdotal tales of desegregation litigation in Kansas City, Missouri, or court-ordered financing of urban districts in New Jersey.

Baker, B. D., & Welner, K. G. (2011). School finance and courts: Does reform matter, and how can we tell. Teachers College Record, 113(11), 2374-2414.

Two reports from Cato Institute are illustrative (Ciotti, 1998, Coate & VanDerHoff, 1999).

Ciotti, P. (1998). Money and School Performance: Lessons from the Kansas City Desegregations Experience. Cato Policy Analysis #298.

Coate, D. & VanDerHoff, J. (1999). Public School Spending and Student Achievement: The Case of New Jersey. Cato Journal, 19(1), 85-99.

Hanushek and Lindseth (2009) provide a similar anecdote-driven approach in which they dedicate a chapter of a book to proving that court-ordered school funding reforms in New Jersey, Wyoming, Kentucky, and Massachusetts resulted in few or no measurable improvements. However, these conclusions are based on little more than a series of graphs of student achievement on the National Assessment of Educational Progress in 1992 and 2007 and an untested assertion that, during that period, each of the four states infused substantial additional funds into public education in response to judicial orders. That is, the authors merely assert that these states experienced large infusions of funding, focused on low income and minority students, within the time period identified. They necessarily assume that, in all other states which serve as a comparison basis, similar changes did not occur. Yet they validate neither assertion. Baker and Welner (2011) explain that Hanushek and Lindseth failed to even measure whether substantive changes had occurred to the level or distribution of school funding as well as when and for how long. In New Jersey, for example, infusion of funding occurred from 1998 to 2003 (or 2005), thus Hanushek and Lindseth’s window includes 6 years on the front end where little change occurred (When?). Kentucky reforms had largely faded by the mid to late 1990s, yet Hanushek and Lindseth measure post reform effects in 2007 (When?). Further, in New Jersey, funding was infused into approximately 30 specific districts, but Hanushek and Lindseth explore overall changes to outcomes among low-income children and minorities using NAEP data, where some of these children attend the districts receiving additional support but many did not (Who?). In short the slipshod comparisons made by Hanushek and Lindseth provide no reasonable basis for asserting either the success or failures of state school finance reforms. Hanushek (2006) goes so far as to title the book “How School Finance Lawsuits Exploit Judges’ Good Intentions and Harm Our Children.” The premise that additional funding for schools often leveraged toward class size reduction, additional course offerings or increased teacher salaries, causes harm to children is, on its face, absurd. And the book which implies as much in its title never once validates that such reforms ever do cause harm. Rather, the title is little more than a manipulative attempt to convince the non-critical spectator who never gets past the book’s cover to fear that school finance reforms might somehow harm children. The book also includes two examples of a type of analysis that occurred with some frequency in the mid-2000s which also had the intent of showing that school funding doesn’t matter. These studies would cherry pick anecdotal information on either or both a) poorly funded schools that have high outcomes or b) well-funded schools that have low outcomes (see Evers & Clopton, 2006, Walberg, 2006).

In equally problematic analysis, Neymotin (2010) set out to show that massive court ordered infusions of funding in Kansas following Montoy v. Kansas led to no substantive improvements in student outcomes. However, Neymotin evaluated changes in school funding from 1997 to 2006, but the first additional funding infused following the January 2005 Supreme Court decision occurred in the 2005-06 school year, the end point of Neymotin’s outcome data.

Baker, B. D., & Welner, K. G. (2011). School finance and courts: Does reform matter, and how can we tell. Teachers College Record, 113(11), 2374-2414.

Hanushek, E. A., and Lindseth, A. (2009). Schoolhouses, Courthouses and Statehouses. Princeton, N.J.: Princeton University Press., See also: http://edpro.stanford.edu/Hanushek/admin/pages/files/uploads/06_EduO_Hanushek_g.pdf

Hanushek, E. A. (ed.). (2006). Courting failure: How school finance lawsuits exploit judges’ good intentions and harm our children (No. 551). Hoover Press.

Evers, W. M., and Clopton, P. (2006). “High-Spending, Low-Performing School Districts,” in Courting Failure: How School Finance Lawsuits Exploit Judges’ Good Intentions and Harm our Children (Eric A. Hanushek, ed.) (pp. 103-194). Palo Alto, CA: Hoover Press.

Walberg, H. (2006) High Poverty, High Performance Schools, Districts and States. in Courting Failure: How School Finance Lawsuits Exploit Judges’ Good Intentions and Harm our Children (Eric A. Hanushek, ed.) (pp. 79-102). Palo Alto, CA: Hoover Press.

Hanushek, E. A., and Lindseth, A. (2009). Schoolhouses, Courthouses and Statehouses. Princeton, N.J.: Princeton University Press., See also: http://edpro.stanford.edu/Hanushek/admin/pages/files/uploads/06_EduO_Hanushek_g.pdf

Greene and Trivitt (2008) present a study in which they claim to show that court ordered school finance reforms let to no substantive improvements in student outcomes. However, the authors test only whether the presence of a court order is associated with changes in outcomes, and never once measure whether substantive school finance reforms followed the court order, but still express the conclusion that court order funding increases had no effect.

Greene, J. P. & Trivitt, (2008). Can Judges Improve Academic Achievement? Peabody Journal of Education, 83(2), 224-237.

Neymotin, F. (2010) The Relationship between School Funding and Student Achievement in Kansas Public Schools. Journal of Education Finance 36 (1) 88-108.

[xiii] Richard J. Murnane and Randall Olsen (1989) The effects of salaries and opportunity costs on length of state in teaching. Evidence from Michigan. Review of Economics and Statistics 71 (2) 347-352

[xiv] David N. Figlio (2002) Can Public Schools Buy Better-Qualified Teachers?” Industrial and Labor Relations Review 55, 686-699. David N. Figlio (1997) Teacher Salaries and Teacher Quality. Economics Letters 55 267-271. Ronald Ferguson (1991) Paying for Public Education: New Evidence on How and Why Money Matters. Harvard Journal on Legislation. 28 (2) 465-498.

[xv] Loeb, S., Page, M. (2000) Examining the Link Between Teacher Wages and Student Outcomes: The Importance of Alternative Labor Market Opportunities and Non-Pecuniary Variation. Review of Economics and Statistics 82 (3) 393-408

[xvi] Figlio, D.N., Rueben, K. (2001) Tax Limits and the Qualifications of New Teachers. Journal of Public Economics. April, 49-71

See also:

Downes, T. A. Figlio, D. N. (1999) Do Tax and Expenditure Limits Provide a Free Lunch? Evidence on the Link Between Limits and Public Sector Service Quality52 (1) 113-128

[xvii] Ondrich, J., Pas, E., Yinger, J. (2008) The Determinants of Teacher Attrition in Upstate New York. Public Finance Review 36 (1) 112-144

[xviii] See http://www2.ed.gov/rschstat/research/pubs/rigorousevid/rigorousevid.pdf;

Jeremy D. Finn and Charles M. Achilles, “Tennessee’s Class Size Study: Findings, Implications, Misconceptions,” Educational Evaluation and Policy Analysis, 21, no. 2 (Summer 2009): 97-109;

Jeremy Finn et. al, “The Enduring Effects of Small Classes,” Teachers College Record, 103, no. 2, (April 2001): 145–183; http://www.tcrecord.org/pdf/10725.pdf;

Alan Krueger, “Would Smaller Class Sizes Help Close the Black-White Achievement Gap.” Working Paper #451 (Princeton, NJ: Industrial Relations Section, Department of Economics, Princeton University, 2001) http://www.irs.princeton.edu/pubs/working_papers.html;

Henry M. Levin, “The Public Returns to Public Educational Investments in African American Males,” Dijon Conference, University of Bourgogne, France. May 2006. http://www.u-bourgogne.fr/colloque-iredu/posterscom/communications/LEVIN.pdf;

Spyros Konstantopoulos Spyros and Vicki Chun, “What Are the Long-Term Effects of Small Classes on the Achievement Gap? Evidence from the Lasting Benefits Study,” American Journal of Education 116, no. 1 (November 2009): 125-154.

[xix] Jepsen, C., Rivkin, S. (2002) What is the Tradeoff Between Smaller Classes and Teacher Quality? NBER Working Paper # 9205, Cambridge, MA. http://www.nber.org/papers/w9205

“The results show that, all else equal, smaller classes raise third-grade mathematics and reading achievement, particularly for lower-income students. However, the expansion of the teaching force required to staff the additional classrooms appears to have led to a deterioration in average teacher quality in schools serving a predominantly black student body. This deterioration partially or, in some cases, fully offset the benefits of smaller classes, demonstrating the importance of considering all implications of any policy change.” p. 1

For further discussion of the complexities of evaluating class size reduction in a dynamic policy context, see:

David Sims, “A Strategic Response to Class Size Reduction: Combination Classes and Student Achievement in California,” Journal of Policy Analysis and Management, 27(3) (2008): 457–478

David Sims, “Crowding Peter to Educate Paul: Lessons from a Class Size Reduction Externality,” Economics of Education Review, 28 (2009): 465–473.

Matthew M. Chingos, “The Impact of a Universal Class-Size Reduction Policy: Evidence from Florida’s Statewide Mandate,” Program on Education Policy and Governance Working Paper 10-03 (2010).

[xx] Ehrenberg, R.G., Brewer, D., Gamoran, A., Willms, J.D. (2001) Class Size and Student Achievement. Psychological Science in the Public Interest 2 (1) 1-30

[xxi] Baker, B., & Welner, K. G. (2012). Evidence and rigor scrutinizing the rhetorical embrace of evidence-based decision making. Educational Researcher, 41(3), 98-101.

[xxii] Loeb, S., Darling-Hammond, L., & Luczak, J. (2005). How teaching conditions predict teacher turnover in California schools. Peabody Journal of Education, 80(3), 44-70.

Isenberg, E. P. (2010). The Effect of Class Size on Teacher Attrition: Evidence from Class Size Reduction Policies in New York State. US Census Bureau Center for Economic Studies Paper No. CES-WP-10-05.

The Subgroup Scam & Testing Everyone Every Year

This post is a follow up to my previous post in which I discussed the misguided arguments for maintaining a system of annual standardize testing of all students.

In my post, I skipped over one argument that seems to be pretty common among the beltway pundits. I skipped this argument largely because the point is moot if we plan on using testing data appropriately to begin with. My point in the previous post was about tests, testing data and how to use it appropriately. But just as the beltway pundit crowd so dreadfully misunderstands tests and testing data, they also dreadfully misunderstanding demography and geography and the intersection of the two. A related example of the complete lack of demographic “data sense” in the current policy discourse is addressed in my recent post on “suburban poverty.”

Among other issues I addressed in my previous post, the beltway crowd is up in arms that if we don’t test every kid every year, we’ll never have sufficient “n” – sample sizes – well actually “N” subpopulation sizes [since this is about testing everyone] – to really know how “subgroups” of students are performing – and more importantly – to apply to a school’s accountability rating! And that, of course is critical to the use of testing for the protection of children’s civil rights. But of course, this argument assumes many things.

For example, the pundits over at Bellwether explain:

Arne Duncan has estimated that hundreds of thousands of students were invisible to state accountability systems because of n-size issues. CAP has praised states in the past for lowering their n-sizes, but their plan to have fewer students “count” toward a school’s accountability rating would mean less attention on important subgroups of students. [ http://blog.bellwethereducation.org/grade-span-accountability-is-a-bad-idea-just-ask-cap-and-the-aft/ ]

There are so many layers of problems in this explanation it’s hard to know where to even begin. In this post, I critique the following three assumptions underlying this claim of urgency for retaining annual testing of everyone:

  • First, that testing everyone every year actually solves the problem of having sufficient numbers of children in each subgroup, in each school and district, to be able to make meaningful comparisons among them.
  • Second, that the subgroup classifications we use for “testing-based-accountability” purposes are, in fact, meaningful distinctions – meaningful ways to characterize student populations and measure differences among them.
  • Third, that the measures we are constructing of student outcomes for making comparisons between these subgroups are somehow meaningful and useful for characterizing school performance. In other words, that we aren’t violating the basic rules I set forth in my previous post, by, for example imposing penalties/sanctions on schools merely for exhibiting the presence of difference in proficiency rates or average scores between group A and group B.

Each of these assumptions is suspect!

Let’s break it down.

Population UNiverse Data Breeds IrratioNal ExuberaNce over “N”

As outlined so eloquently by ArNe DuNcaN (as characterized in the Bellwether blog), one impetus for maintaining testing everyone every year is so that poor and minority children don’t end up being “invisible” when it comes to rating school performance!

We must know the gaps between black and white where black children attend majority white schools, and vice versa.

We must know how poor children are performing in rich schools, and vice versa.

If we don’t test all children every year, we’ll miss those ten black kids in the white school, and those ten Hispanic kids in the black school!

We might even overlook the vast differences in proficiency rates between those 10 Asian kids and those tend black kids in the predominantly white school!

Leaving such gaping holes in our ability to label, takeover, close, reconstitute local public schools is entirely unacceptable!

First, most kids don’t attend racial and economically diverse schools. The differences across our educational system are mainly between schools and districts, not within them. As such, within school subpopulation sizes of subgroups are nearly always insufficient. Second, the common form of these measures – differences in average proficiency between these small groups (where even measurable) – are utterly meaningless as “school accountability” indices (more on this later). Using them for this purpose is reckless and irresponsible.

American public schools remain highly segregated. Elementary schools often enroll about 300 to 500 children, grades KG to 6 (with variations, of course). So, that’s just under 60 kids per grade level who might fall into a tested subpopulation. 10 kids are about 17%. But, in highly segregated metropolitan areas, many schools are either black or white (greater than 85% one or the other). For illustrative purposes, let’s use that 85% threshold as a threshold at which we are unlikely to have sufficient subpopulation size of any subgroup making up the other 15% (among tested students) even when testing everyone. Figure 1 shows the percentages of statewide white students in these racially diverse northeastern states, attending schools that are over 85% white, and percentages of statewide black students attending these schools that are over 85% white.

Figure 1. Whites and Blacks in White Schools

Slide1

In New Jersey, a population dense and racially/ethnically diverse state, nearly 1/3 of white students attend schools that are over 85% white. Only about 2% of the state’s black students attend these “white” schools. 15 to 20% of black students in New Jersey attend schools that are over 85% black. While Pennsylvania has a larger share of black students attending “white” schools – about 7% of black students statewide – in Pennsylvania, nearly 2/3 of white students attend “white” schools.

In other words, even when testing everyone, lots of schools will have no measures of subgroup gaps to count either for or against them, because those schools are so highly segregated that they include no subpopulations of sufficient “N.” Thus, we are relegated to deciding which among the integrated/diverse schools to slap with sanctions!

New Jersey, in its waiver thin nouveau-Duncanian accountability policy, uses “achievement gaps” between subgroups, and low subgroup performance as a basis for state intervention – labeling schools deemed as problematic in this regard as “focus schools.”

But most of the focus school labels are earned by completely erroneous classification resulting from subpopulation size thresholds achieved through aggregation.

As I’ve shown in previous blog posts, the schools assigned this distinction are nearly all “middle schools” in racially diverse school districts. Why is that? Why aren’t the elementary schools also labeled as focus schools? Well, that’s because the elementary schools simply don’t have enough students in the subgroup to count. But, when they all come together – perhaps from two or three elementary schools of about 400 kids, into a middle school of about 800 to 1200 kids, all of the sudden there enough to count. Nothing has really changed except that minimum subpopulation size thresholds have been met. The fact that the gaps are measured – and used to enforce sanctions on middle schools – is merely a function of aggregation. It’s meaningless, ignorant and data abuse.

I’ve actually (half-jokingly, only half, mind you) recommended to my students who are middle school administrators that they thwart this anomaly of aggregation by working with district leadership to reorganize their middle schools into many separate schools, co-located, shall we say. Give them different names. Apply for a charter for one corner of your school. Sort kids in randomly across these new “schools” within the original school and viola… no more subgroups to count in any one school! No more focus group status!

Testing every kid every year, in my view, actually exacerbates the subgroup comparison problem because it generates this false sense confidence in “evaluating everyone” on which policymakers then rely in making completely fallacious judgments about schools.

The Subgroups Aren’t Meaningful Distinctions for Informing Policy or Judging Schools

I’ve addressed poverty achievement gaps on a number of occasions, including how and why our measures of poverty are often insufficient, especially where those measures are constructed by ramming arbitrary cut-points through varied income distributions across settings. And I’ve addressed on numerous occasions more broadly, problems with the ways in which we measure poverty in education policy analysis.

Racial classifications only seem more straightforward, since they are clearly groups (categorical variables), not some arbitrary cut point rammed through a continuous distribution. But that’s not in fact true. Racial classifications used in education policy, as in NCLB, are equally arbitrary clustering of economically, socially and educational diverse racial and ethnic sub-sub-populations.

Current policies, including those used for assigning sanctions to schools in states like New Jersey rest on evaluating gaps between Blacks, Whites, Hispanics and Asians, assuming these distinctions to be educationally, economically and socially important. Back in 2000, a colleague (Lisa) her doctoral student (Christine) and I, after a long conversation over lunch, decided to do a little exploring into this topic – asking ourselves – isn’t it quite possible that the differences among sub-sub-populations are actually greater than the differences in aggregate populations? And further, what’s the sense behind these aggregate groupings anyway?

We specifically explored the composition of the “Asian” and “Hispanic” classifications, where “Asian” (including “Pacific Islander”) included everything from Samoan to Sri Lankan, Japanese, Korean, Hmong, Laotian, etc. It was hard, even from the most American-Centric (Vermont raised white guy point of view) to presume any coherence to this classification. Using data from the National Educational Longitudinal Study of the 8th grade class of 1988, we found:

In the case of both the Hispanic and Asian/Pacific Island aggregate groups there are substantial, though not always statistically significant, academic performance differences among ethnic subgroups, with a range of math performance among Hispanic subgroups of 10.7 points (mean score = 34.4) between Cuban and Puerto Rican students and a range of math performance among Asian/Pacific Island students of 15.3 points (mean score = 41.0) between West Asian and Pacific Island students.

http://epx.sagepub.com/content/14/4/511.short

Why does this matter? Who cares? So there are some differences among the subgroups, which sometimes are even bigger than the differences between the aggregate groups. Well, it certainly matters if we are using, say, test score gaps between Hispanic and White students to decide which school should be subjected to sanctions – especially if one school’s Hispanic population is predominantly Cuban and middle class and another school’s is predominantly recent Mexican immigrant or lower income Puerto Rican families.

The implication of the sanctions imposed on those serving one type of “Hispanic” immigrant versus another is – Why can’t you turn your Hispanics around like they did? This is offensive on so many freakin’ levels! What about the district serving an “Asian” population dominated by middle class Filipinos versus more affluent Koreans? Do we say – what’s wrong with your Asians and why aren’t they performing like their Asians? That’s what current policy does with no regard for the nuance of racial/ethnic (national origin, generational status, etc) classification and the organization of communities with respect to patterns of immigration.

Here a are few snapshots of New Jersey.

First, using U.S. Census American Community Survey data here are the aggregate and breakout populations for large New Jersey cities (and some combinations of cities).

Jersey City has a sizable Hispanic population share. But notably, using these still relatively coarse grained categories, the area in and around Jersey City has a Hispanic population that is mostly “Other” as well as slightly more Cuban, and far less Mexican and Puerto Rican than other cities in New Jersey. Jersey City’s Asian population is substantially Filipino as well as Indian, differentiating it from other parts of the state.

Figure 2. Aggregate Group Distribution and Breakout of Hispanic and Asian Populations of Families with School –Aged Children

Slide2

Figure 3 shows the average income differences across aggregate groups relative to whites in the same city/area. Not surprisingly, Blacks and Hispanics tend to have lower family income than whites, and Asians have similar to or higher than white income.

Figure 3. Differences in Income Relative to Whites for Aggregate Groups

Slide3

But these aggregations can be really deceiving. For example, Figure 4 shows that while Mexican and Puerto Rican family income does tend to be lower than white income, the income of families of school aged children for those of Cuban national origin is comparable to and in Trenton, higher than white income.

Figure 4. Differences in Income Relative to Whites for Disaggregated Hispanic Groups

Slide4

There exists similar variation across Asian sub-subgroups.

Figure 5. Differences in Income Relative to Whites for Disaggregated Asian Groups

Slide5

Gaps in Proficiency Rates within Schools Aren’t Meaningful!

Finally, even if the group classifications were meaningful and even if testing everyone every year created sufficient “N” for comparison purposes, one is left to ask… are we using these data in meaningful, informative appropriate ways to begin with? What the heck does a subgroup proficiency gap even mean in terms of school performance? Well, here’s what Matt Di       Carlo over at Shankerblog has had to say on this topic:

Gaps based on proficiency rates are not fit for use in most any context. When you measure gaps using proficiency rates, you are basically converting test scores into “yes or no” outcomes for two groups (in the case of income, groups also defined by conversion into “yes/no” outcomes), and then comparing those groups. There is no need to get into the technical details (see, for example, Ho 2008 for details), but the problem here is even worse than it is for overall, non-gap measures such as schoolwide proficiency rates. Proficiency-based gaps, particularly over time, are so prone to distortion that they are virtually guaranteed to be misleading, and should be used with extreme caution in any context, to say nothing of using them in a formal, high-stakes accountability system. There are alternative ways to measure gaps using proficiency- and other cutpoint-based rates (e.g., Ho and Reardon 2012), but I haven’t yet seen any states using them.

http://shankerblog.org/?p=10879

In other words, I’m not the only curmudgeon who thinks this whole endeavor is folly. And if the endeavor is folly, then so too are arguments favoring the maintenance of data to support that endeavor.

To Summarize

The bottom line here is that:

Even when you test every kid every year, you don’t have appropriate subpopulation sizes for individual institutions to make meaningful distinctions, because of the way in which our schools are organized and segregated.

The subgroup distinctions, be they differences in test scores above/below arbitrary income thresholds, or between highly aggregated racial/ethnic classifications aren’t particularly meaningful to begin with.

As it is, subgroup data are being used to calculate junk measures and to use them entirely inappropriately (as if there was an appropriate use to begin with?)

So, as it stands, policymakers are taking meaningless measures of outcome differences between arbitrary groupings of student populations and using those measures to make high stakes determinations about the jobs of teachers and principals.

While there are indeed racial disparities within diverse, tracked high schools and middle schools in America that should not be overlooked, the most substantial racial disparities across our educational system are those between schools – and more importantly – between districts serving substantively different student populations by race, ethnicity, national origin and economic status. These differences can and should be captured via appropriate stratified sampling methods, and more fine grained characterizations of our diverse student population.

But more importantly, when collected this information should be used appropriately!

Cutting through the Stupid in the Debate over Annual Testing

I’ve hesitated thus far to enter into the big debate over the usefulness or not of annual testing. It continues to blow my mind that many engaged on the pro-annual testing side of the debate see the annual testing of all children in all grades as the one and only method of achieving all of the things testing, in their view, is intended to achieve, including:

The presumption is that a single method of testing – testing everyone every year in every subject – is the appropriate – the only method to accomplish all of these tasks, simultaneously.

We can’t possibly make sure no child is left behind if we don’t test them all annually every year.

And we can’t possibly point the finger of blame for a child being left behind if we don’t test them all every year, and link those testing data to their teachers and schools!

And, we can’t possibly ensure that all children are “college ready” unless we can show that each and every one of them receives near the end of their high school year, a test score on a common assessment (PARCC or Smarter Balanced) that is reasonably predictive of achieving a combined score of 1,550 or higher on the SAT!

Further, that this entire system must be built on a set of common national standards if ever we are to make valid comparisons of the quality of schooling from Tennessee to Massachusetts, or the effectiveness of individual teachers from the Bayou to Battle Creek.

The counter argument at this point seems to favor the complete abandonment of yearly assessment, and common standards all together –reverting to a hodgepodge of state and local curriculum, standards and assessments.

Missed in most of the conversation are the valid, relevant uses of student assessments, and the different uses, and approaches to using testing, measurement, large and small scale assessment in our schooling system.

Mixed in with this discussion of late is whether annual testing enhances the civil rights of children, or erodes them.

Here’s my quick run-down on a) the purposes of testing in schools, b) how to implement testing to best address those purposes, c) the right and wrong uses of testing with respect to civil rights concerns, and d) the role of common standards in all of this.

Purposes of Testing (measuring student achievement) in our Public Schools

While there are potentially many more purposes of assessment in school settings, I boil it down here to:

  1. testing for diagnostic and instructional purposes
  2. testing for system monitoring purposes (e.g. accountability)

I focus on this distinction because these two major purposes of testing are best achieved by very different approaches to and uses of testing.

Testing for diagnostic & instructional purposes (Individual)

When it comes to diagnostic testing, for enhancing the instruction of individual children and groups of children – the dynamic teacher/student interaction – we want to implement that testing in a way that allows children to move at their own pace, receive immediate feedback, and provide timely relevant information to teachers on what kids know, what they don’t know, what they’re struggling with, etc. This is fine grained information, speaking to specific knowledge and skills children are developing, on a day to day basis (not from April of one year to April of the next, with feedback the following October).

The logical implementation approach here, given the technologies of testing today, is to have kids engage in assessments along the way, through computer adaptive testing, asynchronous. Not all the kids in a big room of computers taking the same item bank on a given day, but kids progressing through relevant, timely computer adaptive assessments (a few minutes here and there), providing immediate diagnostic feedback to teachers. Plenty of schools already do this kind of stuff, whether effectively or not.

To be clear – I’M NOT TALKING ABOUT THIS BEING THE PRIMARY INSTRUCTIONAL MODEL ITSELF! – OR DOMINANT DAY TO DAY CLASSROOM ACTIVITY. I’m talking about this being an available tool, used appropriately [sparsely] to help teachers figure out what kids are getting and what they are not (recognizing that teachers have many other tools at their disposal… like actually asking questions and listening to kids, or reading what the kids write. Further, there’s plenty that simply can’t be evaluated effectively by a computer!).

This information should NOT be used for “accountability” purposes. It should NOT be mined/aggregated/modeled to determine at high level whether institutions or individuals are “doing their jobs,” or for closing schools and firing teachers. That’s not to say, however, that there might not be some use for institutions (schools districts) mining these data to determine how student progress is being made on certain concepts/skills across schools, in order to identify, strengths and weaknesses. In other words, for thoughtful data informed management. Current annual assessments aren’t particularly useful for “data informed” leadership either. But this stuff could be, given the right modeling tools.

This is the approach we use to ensure that no child is left behind. By the time annual, uniform, standardized assessment data are returned in relatively meaningless aggregate scores to the front office 6 months down the road, those kids have already been left behind, and the information provided isn’t even sufficiently fine grained as to be helpful in helping them to catch up.

Testing for accountability/System Monitoring (Institutional)

When it comes to testing for system monitoring, where we are looking at institutions and systems, rather than individuals, immediate feedback is less important. Time intervals can be longer, because institutional change occurs over the long haul, not from just this year, to next. Further, we want our sampling – our measurements – to be as minimally intrusive as possible – both in terms of the number of times we take those measurements, and in terms of the number of measurements we take at any one time. In part, we want measurement for accountability purposes to be non-intrusive so that teachers and local administrators, and the kids especially, can get on with their day – with their learning – development of knowledge and skills.

So, when it comes to “System Monitoring” the most appropriate approach is to use a sampling scheme that is minimally sufficient to capture, at point in time, achievement levels of kids in any given school or district (Institution). You don’t have to test every kid in a school to know how kids in that school are doing. You don’t have to have any one kid take an entire test, if you creatively distribute relevant test items across appropriately sampled kids. Using sampling methods like those used in the National Assessment of Educational Progress can go a long way toward reducing the intrusiveness of testing while providing potentially more valid estimates of institutional performance (how well schools and districts are doing).

If we want to know the physical health of a school’s student population, we don’t make them walk around all day with rectal thermometers hangin’ out (or perhaps these days, with a temporal scan duct-taped to their heads). Rather, we might appropriately sample, in time, and across children.

This testing process could be done annually, to result in annual reports on school performance. These annually collected data, if sampled appropriately (using relevant statistical imputation methods), could also be used to estimate gains achieved by children attending specific schools. I would assert that even annual universe data (all kids tested every year) are of minimal value for assigning useful, reliable, or valid “effect” measures to individual teachers.

Here’s the really important part, which also relates to my thermometer example above. The testing measures themselves ARE NOT THE ACTIONABLE INFORMATION. Testing provides information on symptoms, not causes or underlying processes. It is pure folly to look at low test scores for a given institution, and follow up with an action plan to “improve test scores,” or close the school if/when test scores don’t improve, without ever taking stock of the potential causes behind the low test scores. TEST SCORES ARE SYMPTOMS, NOT CAUSES, NOT ACTIONABLE IN AND OF THEMSELVES.

Where testing for system monitoring purposes reveals gaps between groups of students, or low performance in specific sets of schools, our first course of action should be to dig into underlying processes and inputs. Do these low performing schools have equitable resources to meet their children’s needs? If we find that they don’t – that these lower performing schools serve far more children with greater educational needs, have burgeoning class sizes, non-competitive teacher compensation, then we’ve got something actionable-resource disparities to address, at least as a first course of action.

Further, testing data of this type or the diagnostic type are ALWAYS UNCERTAIN – that is, the difference between the 49th and 51st percentile may not be a difference at all. So we shouldn’t call it one! We shouldn’t draw lines in this sand, or apply bold, disruptive consequences to distinctions that in fact may be statistically meaningless!

Testing as a Civil Rights Issue?

How does all of this relate to the recent discussion of whether the presence of annual testing enhances or erodes children’s civil rights, particularly those of disadvantaged minority groups? Well, it all depends on how that testing is used. Used correctly, implemented appropriately, testing for system monitoring purposes is vital to the protection of civil rights. Used inappropriately, as has often been the case, testing can violate children’s civil rights.

The good:

As someone who engages in expert witness work evaluating the equity and adequacy of state education systems, testing information is useful to me in exploring disparities in children’s outcomes that may raise civil rights concerns.

But again, as noted above, the key here is to recognize that testing outcomes are potential indicators of input or opportunity disparities. Testing outcomes themselves are NOT the disparities of interest to which policy leverage can be directly applied. That’s just dumb. One does not fix achievement gaps by setting the goal “fix that achievement gap!”

That said, without testing, we might no-longer have available reliable and valid evidence that those gaps persist.

The bad:

There are certainly cases where the common misuses of testing raise serious civil rights concerns. For example:

  • Applying strict cut scores at the individual level (high stakes exams) that sort and exclude children disproportionately by race and income, while never addressing input/opportunity disparities that might be the cause of disparate outcomes.
  • Applying strict cut scores at the institutional level to lay blame on teachers and their institutions for the disproportionate failure of low income and minority children, while never addressing input/opportunity disparities that might be the cause of disparate outcomes.

Sadly, I’d say that these two abuses of testing data are far more common than the appropriate uses I outline above. We have, for the past decade and half, escalating in recent years, made policy determinations on test scores alone – taking action on test scores alone – never using those test scores to explore underlying causes – and in the process, we have disproportionately limited high school graduation and college matriculation options of poor and minority children, and have disproportionately closed schools based on symptoms not causes, of poor and minority children.

The bad has far outweighed the good in existing policy uses of testing data!

On Common Standards

Finally, about those common standards. For me, the greatest potential virtue of common standards across states, accompanied by a least intrusive system for assessing those standards (as addressed above) is that we might finally get a better handle on the relative adequacy of resources available to children across states. We might then be able to impose some pressure on those states that have arguably thrown their entire public school system under the bus, to invest sufficiently to achieve those standards. For years, for example, Tennessee has spent next to nothing on their public schools and set low enough outcome standards that all still appeared just fine (unless, of course, you look at NAEP, instead of pass rates on their own tests). Yes, this is hugely wishful thinking!

But, without common standards, we can’t even begin to measure the costs of achieving those common standards across settings.

Research Note: Resource Equity & Student Sorting Across Newark District & Charter Schools

Research Note: Resource Equity & Student Sorting Across Newark District & Charter Schools.

Bruce D. Baker

PDF: BBaker.NJCharters.2015

Executive Summary

In this brief, I present preliminary findings that are part of a larger, national analysis of newly released federal data, a primary objective of which is to evaluate the extent to which those data yield findings consistent with findings arrived at using state level data sources. In this brief, I specifically explore variations in student characteristics and resources across schools in Newark, NJ.

I begin by reflecting on my most recent policy brief on charter and district school performance outcomes – growth percentile data from 2012 and 2013 – noting that on average, Newark Charter schools remain relatively average in student achievement gains given their student populations. But as noted on previous occasions, Newark Charter school student populations are anything but average.

Next, I use longitudinal data from the NCES Common Core of Data, public school universe (the source of underlying demographic data for the newly released federal data) characterizing changes in Newark Charter market share (share of children served in Charter Schools) and the share of low income children served in Newark Charter schools.

Next, I explore what the newly released (albeit already dated) federal data say about Newark Charter school demographics, compared to district schools serving similar grade distributions.

Next, I explore resource distributions and teacher characteristics across Newark schools, charter and district. The question at hand here is whether across district and charter schools, those schools serving needier and more costly student populations also have more (or fewer) resources with which to serve those children. Further, whether among schools serving similar student populations, resource levels are similar.

Forthcoming analyses of charter schools in New York City found that those schools tended to serve less needy populations (than district schools) and were able to do so with substantially more resources that district schools serving similar populations. Because the share of children in the district served by charters remained small, their disruptive effect on equity remained small. By contrast, in Houston, charter schools both served more comparable student populations, and did so, on average, with more comparable resource levels, resulting in less disruption of equity. In each case, the more interesting story, however, was the extent of variation among charter schools, both in students served and in resource levels.

Here, I explore similar questions in the City of Newark, first with the newly released Federal data and then with the most recent four years of available state data (2010 to 2014).

Conclusions & Policy Implications

To summarize:

  • Recently released federal data, confirmed by more recent state data indicates that student population differences between Newark district and charter schools persist.
    • Newark charter schools continue to serve smaller shares of children qualified for free lunch, children with limited English language proficiency and children with disabilities, than do district schools serving similar grade ranges.
    • While charter school market share has remained relatively small (through 2013), the effect of charters underserving lower income students on district school enrollments has remained relatively modest.
  • Charter school total staffing expenditures, either as reported in federal data or as compiled from state data appear to fall in line with student needs in charter schools.
    • Charter schools serve less needy populations and do so with relatively low total salary expense per pupil.
    • But, there exists significant variation in resources among charter schools, with some outspending otherwise similar district schools and others significantly underspending otherwise similar district schools.
  • Charter school wage competitiveness varies widely, with some charters paying substantially more than district schools for teachers of specific experience and degree levels. But these wages do not, as of yet, substantially influence total staffing costs.
  • Charter schools have very high concentrations of 1st and 2nd year teachers, which lowers their total staffing expenditure per pupil but only to the point where those staffing expenditures are in line with expectations (not lower, as one might expect for schools with so many novice teachers).

Finally, comparisons between the newly released Federal data collection and updated state data sources appear both relatively stable over time and relatively consistent across sources even as the charter sector rapidly grows and evolves and as the district continuously morphs.

Two issues require consideration by policymakers and local officials if reliance on charter schooling and expansion of charter schooling are to play a significant role in the future of schooling in Newark. The first is the active management of the potential deleterious effects of student sorting on district schools – that is, as market share increases and the tendency remains for charters to enroll (or keep) fewer of the lowest income children, district schools may be more adversely affected.

An appropriately designed centralized enrollment system can partially mitigate these issues. But (at least) two factors can offset the potential benefits of such a system. First, individual choices of differently motivated and differently informed parents influence who signs up to attend what schools, leading to uneven distribution of initial selections. Second, centralized enrollment affects only how students are sorted on entry, but does not control who stays or leaves a given school.

Perhaps more importantly, however, it may be the case that some charter schools are simply not cut out to best serve some students (as with the district’s own Magnet schools). It would likely be a bad policy choice to create a centralized enrollment system that requires schools to serve children they are ill-equipped to serve.

The second issue requiring consideration is whether the staffing and expenditure structure of charter schools is sustainable and/or efficient. As I’ve shown in my previous report, charter schools are a relative break-even on state achievement growth outcomes, given their resource levels and student characteristics.[1] But, the current staffing expenditure levels (which are merely average, not low) of charters in Newark depend on maintaining a very inexperienced workforce. Again, current novice teacher concentrations may be a function of recent enrollment growth.

As growth slows, these schools will either have to a) shed more experienced teachers to maintain their low-expense staff, b) lower their wages, potentially compromising quality of recruits, c) reduce staffing ratios, potentially compromising program quality or d) increase their spending levels. If charter operators choose “a” above – relying on high attrition, it remains questionable whether the supply of new teachers, even from alternative pathways, would be sufficient to maintain the present model at much larger scale.

[1] https://njedpolicy.files.wordpress.com/2014/10/research-note-on-productive-efficiency.pdf

“Urban” Poverty and “Racial” Achievement Gaps are so Yesterday? Not!

I’ve been meaning to write about this issue for some time. But every time I get around to it, it seems no-longer timely. It’s also not a hugely popular issue, nor one that’s very sexy or controversial from a policy standpoint. But it lingers and re-emerges every now and then.

Well, thanks to this article in The Atlantic, it’s timely again! Once again we are presented with the assertion that suburban poverty is the major policy concern of today – implicitly overshadowing “urban” poverty. Urban poverty is so yesterday! And again, we are presented with a picture of “suburban poverty” as flourishing among abandoned and decaying suburban sprawl (2,500 to 3,000 sq ft single family homes built on ¼ acre lots, perhaps in the 1990s on cul-de-sacs, etc.).[1] This picture is deceptive at best, and amazingly this portrayal is not uncommon.

In this post, I address two examples of what I consider statistical smoke and mirrors (in one case coupled with false imagery) used in recent years to re-frame debates over economic and educational “equality” – toward a “post-urban” and “post-racial” domestic policy agenda.

Two oft repeated claims in recent years are that:

  1. suburban poverty now exceeds urban poverty, in total numbers and thus as a policy concern; and
  2. income achievement gaps far exceed racial achievement gaps on standardized tests.

Thus, we must appropriately refocus the policy agenda, and related resources toward the suburbs and toward mitigating (and for that matter, measuring and evaluating) income achievement gaps, rather than racial achievement gaps. These claims may seem innocuous enough, but they do have significant implications for policy design, including the targeting and allocation of precious resources, and how we view (and respond to) the sorting and reshuffling of student populations by race and income status (state and federal aid to schools).

Suburban Poverty?

Assertions of suburban poverty overtaking urban poverty as a central policy concern are often validated by one form or another of this graph:

Figure 1. The “Suburban Poverty” Validation Graph

Slide3

A version of this graph is used to make the claim in the Atlantic article that we now have three million more poor Americans living in suburbs than in cities! And thus, suburban poverty now rules the day!

It may be true that the aggregate number of individuals in poverty in areas classified by the Census Bureau as “suburbs” exceeds the aggregate number of individuals in poverty living in areas classified as “urban.” But, it’s still the case that the RATE of poverty in urban areas, as classified by the Census Bureau, continues to exceed the RATE of poverty in suburban areas.

Figure 2 displays urban and suburban poverty rates for the families of children between the ages of 5 and 17. Notably, just as with the overall population, in the past few years, the total number of children living in poverty in areas classified as “suburbs” has surpassed the total number in areas classified as “urban.”

By 2013, poverty rates for the total population in urban areas in the U.S. were 19.1% compared to 11.1% in suburbs, with change patterns over time mirroring those for children (Figure 2) but a somewhat lower levels. [in fact, these data suggest that “suburban” poverty never actually surpassed urban poverty, even in aggregate numbers] Long term trends below.

Figure 2. Rate of Poverty among children in Suburban and Urban Areas (American Community Survey)

Slide4

An even more fine grained perspective is presented for school enrollment data, nationally, in Figure 3, breaking out areas into more fine grained categories:

Figure 3. School Enrollments of Children from Low Income Families by Urban Centric Locale Code

Slide5

Clearly, as indicated in Figure 3 – poverty in the suburbs is not the “big” problem. Suburban schools, ON AVERAGE, remain the lowest in poverty concentration (with the exception of rural districts on the fringes of metropolitan areas). Large City schools have by far the highest concentrations of low income children.

What’s a suburb anyway?

Note that the distinction “suburban” itself, which then dictates how these tallies play out, is a Census distinction that may or may not align well with the general public’s view of “suburbia.” Suburbs range from the nearest inner urban fringe immediately adjacent to large cities, to outermost exurbia, where sprawl dominates.

Most older inner-urban-ring suburbs certainly are not dominated by sprawling 2,500 to 3,000 sq ft homes on cul-de-sacs. To clarify, for New Jersey folks, East Orange and Irvington are “Suburbs” by Census designation. For Chicago readers,  all of those small segregated enclaves on the south side are Suburbs. And in St. Louis, Ferguson, Normandy, Wellston, Riverview Gardens, etc. are Suburbs, at least in a Census Bureau technical, geospatial sense.

I’ll set aside for another day the measurement of poverty and how appropriate corrections may alter these findings!

Let’s take a stroll through a handful of our nation’s major metropolitan areas. Again, I’m going to jump to school data, because that’s what I had readily available for mapping. First, let’s look at school level concentrations of low income children in the Chicago metro area, without any artificial boundaries drawn to identify the city, or its suburbs. High poverty schools are concentrated on some areas, low poverty ones in others. The contrasts are pretty striking. We can guess what’s  a suburb and what’s a city, but the official classifications might not line up so well with our guesses.

Figure 4. Chicago School Poverty without Boundaries

Slide6

Now let’s throw in some boundaries and identifiers of “suburbs” versus “urban” or central city areas. Are we really to assume that poverty in aging south side suburbs is the form of “suburban” poverty being characterized in popular media? Long term under-employed, white couples with 2.5 children going upside-down on their mortgages on over-sized homes built on undersized lots? Uh, no! I suspect (actually, I’ve got a whole bunch of related data on this) that the “poverty” we are seeing here, in what are classified as “suburbs” is more what the average Joe would characterize as “urban” poverty (where  “urban” is often code for “black”).

Figure 5. Chicago with Boundaries

Slide7

Now let’s look at the Philly metro area, over the past 10 years (of available data). In Figure 6, the upper left are school level low income concentrations in 2001 and in the upper right, in 2011. Yes, we do see increases in low income concentrations in many schools. But what we especially see, are increases from high, to very high poverty in the urban core, and in two outlying “small cities” (Allentown and Reading to the northwest). Yes, we do see some moderate increases in poverty rates among previously lower poverty suburban schools. But, as the graph in the lower half of the figure shows, urban poverty rates remain much higher, and suburban poverty very low – on average.

Figure 6. Philly Metro School Low Income Concentrations over Time

Slide9

And what do the neighborhoods in these inner urban fringe “suburbs” actually look like – and how do they compare with media portrayals of “suburbs” versus “urban” areas? Much of the public confusion here is fueled by perceptions of “urban” meaning high-rise, very high density low income housing projects and “suburban” meaning sprawling cul-de-sacs. But here are a few visuals I gathered from street level view on Google Maps, showing areas classified as “urban” versus nearby areas classified as “suburban.”

Figure 7. Newark vs. East Orange

Slide10

Figure 8. Chester vs. Philadelphia

Slide11

Figure 9. St. Louis vs. University City

Slide12

In other words, there’s a fine line – if any, and a few blocks walking distance – between the high poverty settings of major cities and the high poverty areas formally classified as suburbs.

While I don’t mean to totally blow off concerns over rising poverty in the “suburbs” I certainly do mean to cast doubt – serious doubt – on how suburban poverty has been portrayed in the media and popular think tanky reports (and web sites), and the policy implications of that messaging. Put bluntly –

  • Poverty rates remain much higher in urban areas than in “suburbs”
  • That which we are now counting as “suburban” poverty is in many if not most cases more like the “urban” poverty that has plagued large and mid-sized city neighborhoods for decades
  • What we are characterizing as suburban poverty – in media imagery – isn’t the same thing we are counting!

Income Achievement Gaps?

This issue is inextricably linked to the previous, in that issues surrounding child poverty and all that flows from it, historically, AND TO THIS DAY, have strong racial correlates. The assertion that income achievement gaps now dwarf racial achievement gaps is most often rooted in this finding from Sean Reardon of Stanford University [from a chapter in an exceptional book titled: Whither Opportunity]:

The achievement gap between children from high- and low-income families is roughly 30 to 40 percent larger among children born in 2001 than among those born twenty-five years earlier.” Further, “the income achievement gap (defined here as the average achievement difference between a child from a family at the 90th percentile of the family income distribution and a child from a family at the 10th percentile) is now nearly twice as large as the black-white achievement gap.[2]

And thus, income achievement gaps are of greater policy importance. Except that the income achievement gap measured here is based on setting arbitrary and rather extreme cut-points along the income distribution. Reardon’s comparison of an income achievement gap between the 90th and 10th percentile family income to the black-white achievement gap is deceptive, and largely inappropriate. One would certainly expect the achievement gap among children from the highest and lowest income groups to be larger than the achievement gap between black and white children, if the family income gap between black and white children is nowhere near as large. Further, achievement gaps at the income extremes would be expected to grow faster to the extent that income gaps at the achievement extremes are growing faster.

Figure 10 shows that the income gap at the poles is, clearly much larger, and growing faster than the income gap between blacks and whites.

Figure 10. Black White Income Gaps vs. 90/10 Income Gaps

Slide13

Not surprisingly, income gaps matter for explaining achievement gaps – where income gaps are larger, so too tend to be outcome gaps. The same is true at the intersection of income and race. Where the income gap between blacks and whites is larger, the racial achievement gap is larger. For example, Figure 11 shows that in 2011, states with larger income gaps between families of black and white children have larger test score gaps between those children. States with very larger income gaps between black and white families, like Connecticut, Wisconsin and Pennsylvania, have large achievement gaps and states with smaller income gaps, like West Virginia, have smaller achievement gaps between black and white children.

Figure 11. Black White Income Gaps Determine Black White Achievement Gaps

Slide14 

Notably, Sean Reardon has written extensively over time about racial achievement gaps. But it is this recent work that seems to have caught media attention and has been used to urge a shift in emphasis from racial to income achievement gaps. This may not be Reardon’s intent, but the inappropriate comparison of gaps made above lends itself to this argument.

Policy Implications

But why does any of this matter? We know there are achievement gaps in relation to income. We know there are income gaps by race. We know there’s poverty in urban areas and the suburbs, and we know that poverty is merely a blunt classification of income status. So why can’t we just leverage policies to tackle income inequality and all that flows from it, while being urbanicity-neutral and race-blind in the process?

Good policy design requires more nuance than this. A substantial body of literature validates that race in-and-of-itself matters (for educational and economic outcomes), above and beyond income variation that may be associated with race. Further, when it comes to leveraging resources, context matters, including the intersections of poverty, race and population density (determined by distribution of housing stock). For example, my own research and that of others has found that racial composition and population density independently influence the costs of achieving common outcome goals.[3]

Developing effective and efficiently targeted policies for achieving more equitable educational outcomes, and ultimately more equitable economic outcomes requires that we understand what we mean when we say “suburban” or “urban” and don’t just rely on media images (or the sloppy research claims behind them), and perhaps, if necessary, that we construct relevant classifications that do appropriately characterize what we mean to characterize.

The current policy agenda and media interest around suburban poverty in particular is largely misinformed by a complete failure to even bother to understand the operational definition of “suburb” (or for that matter, the measurement of “poverty”). Thoughtful policy design requires that we better understand how income and poverty measures relate to the context in which they are measured.[4] Perhaps most importantly, we should always scrutinize carefully that which is presented as some sort of sea change in the demographic, economic or policy landscape. Most large scale change of this sort occurs slowly, not quickly. It’s boring (for many) and requires patient, long term observation. That’s just the way it is.

Notes: 

[1] Notably, a recent report from the Center for American Progress paints a somewhat more accurate view, at least in terms of the housing stock, age and location where “suburban poverty” has been on the rise.

[2] http://t.www.skylinecollege.edu/sparkpoint/about/documents/reardonwhitheropportunity-chapter5.pdf

http://nppsd.fesdev.org/vimages/shared/vnews/stories/525d81ba96ee9/SI%20-%20The%20Widening%20Income%20Achievement%20Gap.pdf

[3] Baker, B. D. (2011). Exploring the sensitivity of education costs to racial composition of schools and race-neutral alternative measures: A cost function application to Missouri. Peabody Journal of Education, 86(1), 58-83.

[4] Baker, B. D., Taylor, L., Levin, J., Chambers, J., & Blankenship, C. (2013). Adjusted Poverty Measures and the Distribution of Title I Aid: Does Title I Really Make the Rich States Richer?. Education Finance and Policy, 8(3), 394-417.

 Long Term Trends

Slide1

Slide2

Education Shouldn’t be an Unfair Game!

A common claim these days, either in political rhetoric or in the context of litigation over the equity and adequacy of state school finance systems is that money simply doesn’t matter. The amount of money we put into any school or district is inconsequential to the outcomes children achieve or quality of education they receive. The public schooling system is simply a money black hole! Thus, it matters not how much money we throw at the system generally and it matters not whether some children get more than others. Further, it matters not whether children with greater educational needs have resources comparable to those with lesser needs and greater preexisting advantages.

Yes, these arguments are contradicted by the vast body of empirical evidence which finds otherwise! And these arguments are often used to deflect emphasis from disparities in resources across children that are egregious on their face, and often not merely a function of state legislative neglect of state school finance systems, but state legislative actions to drive more public resources to those already more advantaged. And things are only getting worse.

As I discuss extensively here, “academics” (used loosely) laying claim that additional dollars simply won’t help schools in general or poor children’s schools in particular (no matter how much or how little they presently receive) often rely on an assertion of a statistically murky relationship between the additional dollar that might be spent and the additional test score point that, in their view, likely won’t be yielded. Undoubtedly, the relationship between each additional dollar expended on schooling and each tested outcome point score increase is neither simple nor linear, nor easily untangled in many existing data sources (as is the case in any complex social system).

Clearly, how money is spent matters. One can spend the additional dollar on something that may contribute directly to children getting that one or two additional questions correct on state assessments, or one can spend that additional dollar on something else – which may in fact be useful though not contributing to the measured outcome, or may be spent in ways that fail to contribute to any noticeable outcome.

But the bottom line is that if you don’t have it, you can’t spend it!

And there exists no reasonable justification for districts like those identified in my recent report on America’s Most Financially Disadvantaged schools to be saddled with double the poverty and substantially fewer resources to apply toward achieving common outcome goals with their far more advantaged peers. These school districts include places like Bridgeport, CT, Reading, PA, as well as much larger, more prominent districts like Philadelphia and Chicago.

Current (federally coerced) state accountability systems set common outcome goals and with adoption of common core standards, many are raising those goals. Achieving high goals costs more than achieving lower ones and achieving higher goals under adverse conditions costs even more. And these newly, waiverly, common corely modified state accountability systems have consequences for schools and teachers, and the children they serve.

Penalizing institutions and individuals for not achieving goals they weren’t provided equitable opportunity to achieve is patently unfair.

Further, the possibility that additional funds provided to financially disadvantaged districts might be spent “unwisely” is insufficient basis for perpetuating deprivation and unfairness in the distribution of the consequences of that deprivation.

The responsibility for providing adequate funding rests with the state, as does the responsibility for ensuring that local public school districts use those resources wisely.

A frequent assertion of those wishing to brush equity and adequacy claims under the rug is that all local public school districts have more than enough money to achieve mandated outcomes and that those with far less money and more challenging conditions simply have to be more clever in how they allocate their resources to achieve adequate educational outcomes. That is, they must figure out how, within their existing budgets, to recruit and retain more skilled teachers to carry larger workloads under more difficult working conditions for less pay than they might get in more advantaged neighboring districts. They must develop these clever, odds-beating (more “efficient”) strategies in order to catch up – in order to bring their students to the state mandated common outcome standards.

As some in education reform circles argue,  school districts with fewer resources need to engage themselves in creative personnel management strategies analogous to those of the 2003 Oakland Athletics baseball team which overcame its relatively low total payroll to win the American League Division Series, through clever, statistically driven player recruitment and selection. [1] That is, schools, particularly disadvantaged ones, need a lesson in Moneyball! (the main title of the book chronicling the 2003 A’s).

There are a multitude of absurdities in this comparison, not the least of which is that once other “teams” (or school districts) catch on to the methods being used by one of their less advantaged competitors, any competitive edge created by those revenue-neutral, field-leveling strategies is negated.[2]

Then there’s the thorny issue that the lowest performing schools, unlike the teams with the worst win/loss records, don’t get first pick in the draft for new teachers. Rather, in reality, it’s quite the opposite![3]

The central problem however, is illustrated by the oft conveniently overlooked subtitle of the book Moneyball:

The art of winning an unfair game.

That is, the disparities in resources and resulting payrolls across major league baseball make it an unfair game. That’s understood. The owners and baseball executives seem to like it that way, and fans (except those in smaller markets which don’t matter as much) seem to accept the persistent lack of parity. Further, there’s no constitutional mandate that all baseball teams have resources sufficient to provide them equal opportunity to make the post-season or to achieve equitable win/loss records over time.

But children’s schooling isn’t baseball, and shouldn’t be an unfair game to begin with!

[1] For a discussion, see: http://larrycuban.wordpress.com/2011/10/02/sport-stats-and-teacher-stats/ & http://www.dfer.org/2007/08/baseball_and_ed.php

[2] This would be especially true if all participants were mandated to employ the same metrics for rating, ranking and dismissing their employees, as under newly adopted statutes and regulations regarding teacher evaluation.

[3] Lankford, H., Loeb, S., & Wyckoff, J. (2002). Teacher sorting and the plight of urban schools: A descriptive analysis. Educational evaluation and policy analysis, 24(1), 37-62.

Children’s Constitutional Rights and School Funding: Why the charter funding disparity lawsuits in NY and DC are misguided

Ah… another day, another smokescreen to distract state (and federal) courts from the real and substantive issue of equitable and adequate financing of America’s public schooling system. This one is brought to us from New York and Washington, DC., explained here by Dunn and Derthick in Education Next.

For years, opponents of school choice had a corner on the litigation market. But in a sign that charter schools have matured, lawsuits have recently been filed in Washington, D.C., and New York State demanding equitable funding. When the charter school movement was in its infancy, such litigation would have been politically dangerous. Why support charter schools if they may turn around and sue you? But charters are now so well established that they are fighting back against the second-class funding status that states and school districts have assigned them.

http://educationnext.org/modern-maturity-charter-schools/

Now, to be clear, these authors are no strangers to completely bizarre school finance arguments. Not too long ago, they thought it intriguing that the federal courts might entertain the possibility that unlimited local property taxation should be considered a federal constitutionally protected right – thus, any state regulation of, definition of, control over and limitations on property taxation violates individual liberties. Reconcile that view – a view of federal constitutional protection to raise and spend whatever you want on “your” schools (specifically via property taxes) – with their apparent support here for the assertion that states MUST be obligated to provide exactly equal revenue subsidy to charter schools as to district schools?[1]

Let’s have some fun and dissect this new one a bit – since Dunn and Derthick fail to provide any substantive analysis of the legal claims or supposed “facts” to support the assertion of “second-class funding status” specifically in the contexts of the litigation in question.

Typically (if there’s anything typical about this stuff), the judicial interpretation of state constitution education clauses [usual basis for bringing equity/adequacy school funding claims], is that children, regardless of who they are or where they live should have access to equal or adequate educational opportunities, where those opportunities are provided free of charge to the student (states differ on issues of fees, etc.). State courts have held legislatures to different standards of quality (adequacy), often based on the legislature’s own declarations of the desired (or mandated) outcomes and state courts have varied in their attention to “equal” versus “adequate,” arguably, though not clearly linked to differences in state constitutional language.

One of the contexts in question here is Washington, DC, which does not have a “state” constitution (not being a state and all) or therefore, an education clause. But, DC does have its own history of litigation pertaining to schooling equity in which a federal district court declared, in 1967 that the district’s segregated and financially unequal system of schooling “unconstitutionally deprive(d) the District’s Negro and poor public school children of their right to equal educational opportunity with the District’s white and more affluent public school children.”[2]

Notably, many courts have made clear that it is not the dollar inputs or publicly subsidized revenue amount that must be equally provided, but rather specific schooling resources – “essential resources” – required for provision of equitable and adequate education (sound basic education, thorough and efficient education, uniform system of schools), including differences in resources required for providing equal opportunities to children with varied educational needs.

The point here is that all children should have equitable access to constitutionally adequate opportunities. Consider a scenario where a child has the choice to attend one of 5 different district operated traditional public schools, a local privately operated/governed publicly subsidized charter school, a local private religious school for which the child might receive a partial subsidy (let’s say 50% of the public school expenditure), or attend any other private school at full tuition expense, or home school at full cost to parents/family.

The state need only guarantee that the child has access to an adequate and equitable education. The state is not necessarily obligated to fully finance at “adequate” expense, that child’s choice to home-school, to attend non-subsidized private school, or to pay the voucher rate at an equivalent of the “adequate” public district expense. Nor for that matter, is the state necessarily obligated to pay identically for the charter school, to the extent that the child (and every other child) in question has available, adequate educational options among which to choose. In other words, if the child chooses the lower funded school, when better funded schools are open/available to that student, are the student’s rights really violated?

Of course, the reality – the BIG ISSUE – is that the urban district as a whole might be inadequately subsidized by the state and thus all options available at no charge to the student (district, charter, voucher) are inadequately financed. If all options available to the student are inadequately and inequitably funded, then the child has a much stronger argument regarding the deprivation of their constitutional rights.

So, there are at least two major conceptual, legal gaps that should see these cases dismissed long before any discussion of “facts” ever occurs:

  • The rights in question do not require equitable revenue/subsidy to the operators of charter schools versus district schools, but rather the provision of equitable and adequate publicly subsidized schooling (as measured by real resources and outcomes yielded by that funding) more broadly;
  • That if a circumstance exists where a child and her family chooses a less subsidized alternative (homeschooling, full tuition private schooling, partially subsidized private schooling, OR publicly subsidized privately managed charter schooling) in the presence of adequately subsidized district schooling alternatives, the child’s rights are not likely violated. It’s their choice.

These cases likely die right here and never get to the point of deliberating the “facts” involved – that is, whether there truly exist the substantive disparities in equal educational opportunity between children attending district schools and charter schools in New York and Washington, DC.

The arguments are relying on junk analyses of disparities

Not only are these cases ill-conceived conceptually, but they seem at least partly driven by some of the most bogus “research” I have ever had the displeasure to review/critique – the University of Arkansas Department of Education Reform’s Charter Funding Disparities report. In fact, many if not most of the figures in the report that I attempted to reconcile with publicly available data were simply wrong, especially in cases where charter schools received their funding by pass-through from local public districts. Many of the supposed egregious funding gaps they identified between district schools and charter schools simply don’t exist and in some cases, the opposite was true.

First, here are links to a few key reports and research articles that compare charter school spending and revenues, which may be useful in the context of this litigation (were it ever to get that far):

Now let’s take a closer look at available data from New York City and Washington, DC in particular. Remember, it’s not entirely about the equality of the public subsidy rate, but rather about comparisons of the essential resources in question, given the population of students to be served. When it comes to New York City at least, reports on public subsidy rate comparisons have found that charter schools “co-located” in district buildings are actually funded higher than their district school counter parts, in stark contrast with the junk estimates of huge charter disadvantage identified in the UARK report. In my review of that report, I explain:

The UARK charter funding study reports total revenue per pupil for NYC public schools at over $24,000 and charter funding at $16,420, for a gap of 32%. By contrast, after sorting out district expenses on charter students, IBO found that charter schools in district facilities had a surplus subsidy around 4% and charter schools not in district facilities faced a deficit, but less than half of that identified by the Charter Funding Study. And the IBO study considered only public subsidy rate, not “all revenues” as proclaimed in the Charter Funding Report.

But again, what it really comes down to is more fine grained comparisons of resources available to children across schools. And as I’ve noted time and time again, New York City charter schools in particular, do not make strong case for deprivation. Indeed, they are widely varied, and some do have far fewer resources than others. But the biggest disparities are among high and low spending charter schools, not between district and charter schools.[3] Here’s quick walk through on NYC charter schools:

NYC charter schools, on balance, serve far less needy populations than do district schools in the same borough:

Slide1

NYC charter schools, given their enrollments, grade ranges and locations, in many cases spend more per pupil – a lot more – than otherwise similar district schools.

Slide2
With that money, NYC charter schools, on average, have provided smaller class sizes than district schools serving similar student populations.

Slide3

And NYC charter schools, in many cases have actually paid their teachers more at similar degree and experience levels.

Slide4

As someone who has testified time and time again regarding school funding disparities – and the connection between financial input deprivation and “real resource” deprivation – I’d have a pretty hard time asserting here that New York has established a system which systematically deprives children in charter schools – relative to district schools – of their constitutional rights.

It remains an entirely separate question whether children attending high need school districts are being provided a constitutionally adequate education in New York State – which they are not!

And about those inequities in Washington, DC. Little good publicly available information exists for comparing school site expenditures between district and charter schools in Washington DC by the same methods I apply in New York (which, are the methods broadly used and accepted in making funding comparisons across schools and districts in academic literature)[4]. But, a short while back, Mike Petrilli and colleagues at the TB Fordham Institute released their DC Metro School Spending Explorer web site and were kind enough to give me the opportunity to evaluate their data. The graph below presents an analysis comparable to the funding comparisons I make in New York City, specifically – comparing the per pupil operating spending of schools serving the same grade ranges, same shares of children qualified for free lunch and same shares of children in special education programs.

Here, I find that as in New York City, DC charter schools are spending, on average, substantially more per pupil than “otherwise similar” district schools:

Slide5

Now, I do have some hesitation about these data, in that even to me, it seems that the differences in spending may be overstating charter expenditure relative to similar district school expenditure. But even with some correction (if warranted), it’s unlikely that one would find the supposed substantial and systematic deprivation of charter schools relative to district schools asserted in the thoroughly discredited UARK report.

The bigger issue: Actual equitable and adequate funding!

The big issue, which I’ve addressed time and time again, is that states (and Washington DC) must provide equitable and adequate financing for the system as a whole – which requires substantive additional support in high need communities – communities with large shares of children and families in poverty, racial minorities and children with limited English language proficiency. When the system is financed equitably and adequately, then so too can charter schooling be financed equitably and adequately.

This new pissing match between charter and district schools spawned by charter advocates (perhaps even initiated by the bogus UARK report) to gain greater access to the limited pool of resources currently available to largely urban, high need public districts is yet another distraction – a smoke screen – and just the kind of smokescreen that many state policymakers desire – again removing the focus from the bigger issue. No need to raise taxes to actually fully and equitably finance the public schooling system? We merely need to force local public districts (regardless of what they have available to them) to provide more funding to charter schools – even if the math doesn’t add up (that is, if the source of funds isn’t adequate for all eligible children, then it’s neither adequate for financing district, nor charter schools, nor other alternatives).

But then again, perhaps that’s the whole point. Let’s hope the courts can see through this one (like this BS), discard it quickly, and get back to the more important business at hand!

Notes

[1] Notably, Dunn & Derthick don’t so much come out and argue that plaintiffs are correct in this case, but do use plenty of language suggesting they support the charter point of view, including broad acceptance of “second class funding status”

[2] http://law.justia.com/cases/federal/district-courts/FSupp/269/401/1800940/

[3] More information on charter schools around the rest of the state can be found in this article: Bifulco, R., & Reback, R. (2014). Fiscal Impacts of Charter Schools: Lessons from New York. Education, 9(1), 86-107.

[4] See literature review here: Baker, B. D. (2012). Rearranging Deck Chairs in Dallas: Contextual Constraints and Within-district Resource Allocation in Urban Texas School Districts. Journal of Education Finance, 37(3), 287-315.

Research Note: On Student Growth & the Productivity of New Jersey Charter Schools

schoolfinance101's avatarNew Jersey Education Policy Forum

Bruce D. Baker, Rutgers University, Graduate School of Education

October 31, 2014

PDF: Research Note on Productive Efficiency

In June of 2014, I wrote a brief in which I evaluated New Jersey’s school growth percentile measures to determine whether factors outside the control of local schools or districts are significantly predictive of variation in those growth percentile measures.[1] I found that this was indeed the case. Specifically, I found:

Student Population Characteristics

  1. % free lunch is significantly, negatively associated with growth percentiles for both subjects and both years. That is, schools with higher shares of low income children have significantly lower growth percentiles;
  2. When controlling for low income concentrations, schools with higher shares of English language learners have higher growth percentiles on both tests in both years;
  3. Schools with larger shares of children already at or above proficiency tend to show greater gains on both tests in both…

View original post 1,348 more words

Anatomy of Educational Inequality & Why School Funding Matters

There continues to be much bluster out there in ed reformy land that money really isn’t all that important – especially for traditional public school districts. That local public schools and districts already have way too much money but use it so inefficiently that any additional dollar would necessarily be wasted. An extension of this line of reasoning is that therefore differences in spending across districts are also inconsequential. It really doesn’t matter – the reformy line of thinking goes – if the suburbs around Philly, Chicago or New York dramatically outspend them, as long as some a-contextual, poorly documented and often flat out wrong, blustery statement can be made about a seemingly large aggregate or per pupil spending figure that the average person on the street should simply find offensive.

Much of this bluster about the irrelevance of funding is strangely juxtaposed with arguments that inequity of teacher quality and the adequacy of the quality of the teacher workforce are the major threats to our education system. But of course, these threats have little or nothing to do with money? Right? As I’ve explained previously – equitable distribution of quality teaching requires equitable (not necessarily equal) distribution of resources. Districts serving more needy student populations require smaller classes and more intensive supports if their students are expected to close the gap with their more advantaged peers – or strive for common outcome goals. Even recruiting similarly qualified teachers in higher need settings requires higher, not the same or lower compensation. Districts serving high need populations require a) more staff – more specialized, more diverse and even more of the same (core classroom teacher) staff, of b) at least equal qualifications. That means they need more money (than their more advantaged neighbors) to get the job done. If they so happen to have substantially less money, it’s not a matter of simply trading off those lower class sizes for higher salaries or vice versa. If you have neither, you can’t do the tradeoff.

Well, here’s what actual research and data show:

Funding & Finance Reform Matters

There exists an increasing body of evidence that substantive and sustained state school finance reforms matter for improving both the level and distribution of short-term and long-run student outcomes. A few studies have attempted to tackle school finance reforms broadly applying multi-state analyses over time. Card and Payne (2002) found “evidence that equalization of spending levels leads to a narrowing of test score outcomes across family background groups.”[i] (p. 49) Most recently, Jackson, Johnson & Persico (2014) evaluated long-term outcomes of children exposed to court-ordered school finance reforms, finding that “a 20 percent increase in per-pupil spending each year for all 12 years of public school for children from poor families leads to about 0.9 more completed years of education, 25 percent higher earnings, and a 20 percentage-point reduction in the annual incidence of adult poverty; we find no effects for children from non-poor families.”(p. 1)[ii]

Numerous other researchers have explored the effects of specific state school finance reforms over time. [iii] Several such studies provide compelling evidence of the potential positive effects of school finance reforms. Studies of Michigan school finance reforms in the 1990s have shown positive effects on student performance in both the previously lowest spending districts, [iv] and previously lower performing districts. [v] Similarly, a study of Kansas school finance reforms in the 1990s, which also involved primarily a leveling up of low-spending districts, found that a 20 percent increase in spending was associated with a 5 percent increase in the likelihood of students going on to postsecondary education.[vi]

Three studies of Massachusetts school finance reforms from the 1990s find similar results. The first, by Thomas Downes and colleagues found that the combination of funding and accountability reforms “has been successful in raising the achievement of students in the previously low-spending districts.” (p. 5)[vii] The second found that “increases in per-pupil spending led to significant increases in math, reading, science, and social studies test scores for 4th- and 8th-grade students.”[viii] The most recent of the three, published in 2014 in the Journal of Education Finance, found that “changes in the state education aid following the education reform resulted in significantly higher student performance.”(p. 297)[ix] Such findings have been replicated in other states, including Vermont. [x]

On balance, it is safe to say that a sizeable and growing body of rigorous empirical literature validates that state school finance reforms can have substantive, positive effects on student outcomes, including reductions in outcome disparities or increases in overall outcome levels.[xi]

See also: http://www.shankerinstitute.org/images/doesmoneymatter_final.pdf

Relative Funding Matters

In a recent Center for American Progress report, I identify districts around the nation that have a) higher than average child poverty than other school districts in their surrounding area, and b) lower than average state and local revenue per pupil than surrounding districts. In that report, I provide the following explanation as to why relative resources matter:

It is important to understand that the value of any given level of education funding, in any given location, is relative. That is, it does not matter whether a district spends $10,000 per pupil or $20,000 per pupil. It matters how that funding compares to other districts operating in the same regional labor market—and, for that matter, how that money relates to other conditions in the regional labor market. The first reason relative funding matters is that schooling is labor intensive. The quality of schooling depends largely on the ability of schools or districts to recruit and retain quality employees. The largest share of school districts’ annual operating budgets is tied up in the salaries and wages of teachers and other school workers. The ability to recruit and retain teachers in a school district in any given labor market depends on the wage a district can pay to teachers relative to other surrounding schools or districts and relative to nonteaching alternatives in the same labor market.[xii] The second reason is that graduates’ access to opportunities beyond high school is largely relative and regional. The ability of graduates of one school district to gain access to higher education or the labor force depends on the regional pool in which the graduate must compete.[xiii]

Snapshots of Inequality: A look at Illinois

So then, what does funding inequality actually look like? And does funding inequality really translate to inequality of teacher wages? Or inequality of staffing ratios?

Figure 1 displays a classic spatial pattern of inequality. Chicago, Illinois, has relatively low per-pupil revenue but is surrounded by leafy suburbs with high-spending public school systems. This is one of those classic “savage inequality” patterns that many like to argue are a thing of the past – an issue already resolved. Background shading indicates state and local revenue per pupil of school districts. Circles indicate schools, with shares of low-income children indicated by the circle’s color. Savage disparities, —such as those in the Chicago metropolitan area, —are represented by red circles on yellow-to-red backgrounds adjacent to blue circles on blue backgrounds.

The City of Chicago is shaded yellow for revenue, highlighting its large numbers of very high- poverty schools. The leafy suburbs have both very high spending and low-poverty schools. To the south of Chicago are additional, modest to poorly funded districts with very high- poverty schools. Two additional high-poverty districts with particularly low revenue appear to the north and west—Waukegan and Round Lake.

Figure 1 – Geographic Distribution of Children & Money in Illinois

Slide1

Figure 2 shows that on average in the Chicago metro area, higher poverty districts have lower average combined state and local revenues and current operating expenditures. That is, they are behind overall, having little chance to compete with their surroundings by making simple tradeoffs between class sizes and competitive wages. But I merely speculate right? We all know those greedy Chicago teachers are pulling in a hefty salary and livin’ large, even by comparison to their peers in the leafy ‘burbs, right?

Figure 2 – Higher Poverty Districts Have Lower Average Revenues and Expenditures

Slide4

Figure 3 pretty quickly dispels that myth. Figure 3 is based on a salary model applied to all certified staff in the entire state of Illinois from 2002 to 2012. Staff salaries were predicted as a function of a) years of experience in Illinois, b) degree level, c) contract months, d) specific teaching or administrative assignment code, and e) labor market where the district is located, for f) all full time school district employees. These factors explain over 70% of the variation in salaries. The remaining variation is then the amount each teacher’s salary varies from the labor market average (metro area) for a teacher with the same experience, degree level, and specific assignment, on a monthly basis. The average difference between the actual and predicted salaries for teachers in any district are an indicator of the relative competitiveness of salaries in their district, to others in the same labor market. I express this average as a ratio of the teacher salaries in each district to the labor market average.

Figure 3 shows the relationship in 2012 between the competitiveness of district teacher salaries and the relative spending levels of districts (relative to labor market average). Of course, the logical response from them reformy-thinkin’ types is that these districts simply need to use their piles of cash lyin’ around to make those salaries more competitive. It must be the case that these districts are simply employing far more staff than they need to per child, compared to the other districts that are outpacing them on salary. It couldn’t possibly be that these districts neither have enough money to employ more staff, or do so at relatively competitive wages.

Figure 3 – Higher Spending Districts pay Higher Competitive Wages for Similar Teachers

Slide5

But heck, all of that reasoning only works well in a world where no-one ever looks at real data. Figure 4 shows us what the data look like regarding the relationship between a) relative spending per pupil and b) total staffing per pupil. Shocking revelation – districts with more money can provide more staff. Shocking double revelation combining this evidence with the previous – districts with a lot more money can provide both more staff and more competitive wages. And thus, triple shocking – districts with a lot less money can’t do either!

Notably, forthcoming work will (numbers already run) validate that these overall staffing ratio differences do translate to class size differences.

Figure 4 – Higher Spending Districts also Provide More Staff per Pupil (fewer pupils per staff)

Slide6

And by the way, the relationships between money and staffing and competitive wages, at least in the Chicago metro are getting stronger over time, specifically as the high spending leafy ‘burbs run away from the pack!

Figure 5 – It’s only getting worse over time!

Slide7

You may have noticed that this is my first blog post in a long time. Quite honestly, there are many days when I just feel like I’ve already written all of this stuff, or even if I haven’t, the issue at hand is so plainly obvious that I shouldn’t need to say it. The fact that public discourse over educational equity has actually decayed to a state where teacher quality equity arguments are entirely separable from – completely unrelated to funding equity – and somehow driven instead by uniformly applied due process requirements is just bizarre. It’s nonsensical.

We’ve entered a bizarro world I never could have imagined when I started out doing this stuff back in the mid-1990s. And this Bizarro world is being promoted from the supposed highest echelons of our highly stratified society.

Harvard Legal theorist/activist Laurence Tribe, for example, seems to believe on the one hand that state’s ought have no constitutional (federal) authority whatsoever to define, operate and regulate (specifically to cap) local property taxation – asserting that local citizens rights to tax themselves as they see fit – to whatever level they choose – is akin to the first amendment freedoms to give unlimited contributions to political campaigns. Surely (cough, cough), there are no equity consequences to this argument.

Yet, on the other hand, Tribe has signed on to help craft the next wave of Vergarguments [definition of Vergarguments], claiming that the major barriers to teacher quality equity (which trumps funding equity every time) are state statutory due process and seniority protections.

Now, one might reconcile Tribe’s participation in these seemingly disparate cases on the basis that he simply believes state’s ought to have no authority to regulate anything about local public education systems [a notion historically lacking any precedence whatsoever, since these systems, are, well, creations of the states] – property tax revenues or teacher contractual issues. But it’s pretty hard to imagine how the combination of removal of any and all limitations on local property taxation and removal of public employee due process and seniority protections leads us to either a more equitable or adequate system of public schooling. Rather, they lead us down the road to a Mad Max world – a freakin’ everyone-for-themselves free for all.

This idiocy – cast as lofty super-intellectual progressivism that us poor common folk simply can’t grasp (kind of like this BS) – has to stop.

We are being led down a destructive road to stupid – by arrogant , intellectually bankrupt, philosophically inconsistent, empirically invalid and often downright dumb ideas being swallowed whole and parroted by an increasingly inept media – all, in the end creating a massive ed reform haboob distracting us from the relatively straightforward needs of our public schools.

Many of the issues plaguing our current public education system require mundane, logical solutions – or at least first steps.

Money matters. Having more helps and yes, having less hurts, especially when those who need the most get the least.

Equitable and adequate funding are prerequisite conditions either for an improved status-quo public education system OR for a structurally reformed one.

It’s just that simple.

Sufficient, stable state revenue systems are required for supporting equitable and adequate funding. [forthcoming article on this in Ed Policy Analysis Archives] Yeah… that means taxes (even property taxes have their virtues). We need to get out of this mindset that all taxes are always bad. Taxes pay for important stuff. Back to school on this one! & no, our tax burden, even in Jersey is not through the roof.

Equitable and adequate funding translates to more equitable wage variation across schools and districts and translates to more equitable and adequate staffing ratios.

Yes, it’s true that one might provide more equitable and adequate funding, which might yield more equitable and adequate wages and staffing ratios, but there may still exist inequities in teacher quality distribution. At that point we might begin to identify other factors contributing to that inequity. But equitable and adequate funding is still a prerequisite condition.

So let’s drop all of this illogical, convoluted BS and start doing the right thing.

On a related note:

I’m sick of half-baked claims that online options are necessarily cheaper and equally or more effective. See here, and see HERE for thorough rebuttal.

I’m sick of half-baked claims that charter schools have found a cost-less secret sauce. See here, here, and here… and HERE, HERE and HERE for thorough rebuttal.

And finally, see here for a more thorough discussion of research on improving educational productivity and efficiency.

NOTES

[i] Card, D., and Payne, A. A. (2002). School Finance Reform, the Distribution of School Spending, and the Distribution of Student Test Scores. Journal of Public Economics, 83(1), 49-82.

[ii] Jackson, C. K., Johnson, R., & Persico, C. (2014). The Effect of School Finance Reforms on the Distribution of Spending, Academic Achievement, and Adult Outcomes (No. w20118). National Bureau of Economic Research.

[iii] Figlio (2004) explains that the influence of state school finance reforms on student outcomes is perhaps better measured within states over time, explaining that national studies of the type attempted by Card and Payne confront problems of a) the enormous diversity in the nature of state aid reform plans, and b) the paucity of national level student performance data.

Figlio, D. N. (2004) Funding and Accountability: Some Conceptual and Technical Issues in State Aid Reform. In Yinger, J. (Ed.) p. 87-111 Helping Children Left Behind: State Aid and the Pursuit of Educational Equity. MIT Press.

[iv] Roy, J. (2011). Impact of school finance reform on resource equalization and academic performance: Evidence from Michigan. Education Finance and Policy, 6(2), 137-167.

Roy (2011) published an analysis of the effects of Michigan’s 1990s school finance reforms which led to a significant leveling up for previously low-spending districts. Roy, whose analyses measure both whether the policy resulted in changes in funding and who was affected, found that “Proposal A was quite successful in reducing interdistrict spending disparities. There was also a significant positive effect on student performance in the lowest-spending districts as measured in state tests.” (p. 137)

[v] Papke, L. (2005). The effects of spending on test pass rates: evidence from Michigan. Journal of Public Economics, 89(5-6). 821-839.

Hyman, J. (2013). Does Money Matter in the Long Run? Effects of School Spending on Educational Attainment. http://www-personal.umich.edu/~jmhyman/Hyman_JMP.pdf.

Papke (2001), also evaluating Michigan school finance reforms from the 1990s, found that “increases in spending have nontrivial, statistically significant effects on math test pass rates, and the effects are largest for schools with initially poor performance.” (p. 821)

Most recently, Hyman (2013) also found positive effects of Michigan school finance reforms in the 1990s, but raised some concerns regarding the distribution of those effects. Hyman found that much of the increase was targeted to schools serving fewer low income children. But, the study did find that students exposed to an additional “12%, more spending per year during grades four through seven experienced a 3.9 percentage point increase in the probability of enrolling in college, and a 2.5 percentage point increase in the probability of earning a degree.” (p. 1)

[vi] Deke, J. (2003). A study of the impact of public school spending on postsecondary educational attainment using statewide school district refinancing in Kansas, Economics of Education Review, 22(3), 275-284. (p. 275)

[vii] Downes, T. A., Zabel, J., and Ansel, D. (2009). Incomplete Grade: Massachusetts Education Reform at 15. Boston, MA. MassINC.

[viii] Guryan, J. (2001). Does Money Matter? Estimates from Education Finance Reform in Massachusetts. Working Paper No. 8269. Cambridge, MA: National Bureau of Economic Research.

“The magnitudes imply a $1,000 increase in per-pupil spending leads to about a third to a half of a standard-deviation increase in average test scores. It is noted that the state aid driving the estimates is targeted to under-funded school districts, which may have atypical returns to additional expenditures.” (p. 1)

[ix] Nguyen-Hoang, P., & Yinger, J. (2014). Education Finance Reform, Local Behavior, and Student Performance in Massachusetts. Journal of Education Finance, 39(4), 297-322.

[x] Downes had conducted earlier studies of Vermont school finance reforms in the late 1990s (Act 60). In a 2004 book chapter, Downes noted “All of the evidence cited in this paper supports the conclusion that Act 60 has dramatically reduced dispersion in education spending and has done this by weakening the link between spending and property wealth. Further, the regressions presented in this paper offer some evidence that student performance has become more equal in the post-Act 60 period. And no results support the conclusion that Act 60 has contributed to increased dispersion in performance.” (p. 312)

Downes, T. A. (2004). School Finance Reform and School Quality: Lessons from Vermont. In Yinger, J. (Ed.), Helping Children Left Behind: State Aid and the Pursuit of Educational Equity. Cambridge, MA: MIT Press.

[xi] Indeed, this point is not without some controversy, much of which is readily discarded. Second-hand references to dreadful failures following massive infusions of new funding can often be traced to methodologically inept, anecdotal tales of desegregation litigation in Kansas City, Missouri, or court-ordered financing of urban districts in New Jersey.

Baker, B. D., & Welner, K. G. (2011). School finance and courts: Does reform matter, and how can we tell. Teachers College Record, 113(11), 2374-2414.

Two reports from Cato Institute are illustrative (Ciotti, 1998, Coate & VanDerHoff, 1999).

Ciotti, P. (1998). Money and School Performance: Lessons from the Kansas City Desegregations Experience. Cato Policy Analysis #298.

Coate, D. & VanDerHoff, J. (1999). Public School Spending and Student Achievement: The Case of New Jersey. Cato Journal, 19(1), 85-99.

Hanushek and Lindseth (2009) provide a similar anecdote-driven approach in which they dedicate a chapter of a book to proving that court-ordered school funding reforms in New Jersey, Wyoming, Kentucky, and Massachusetts resulted in few or no measurable improvements. However, these conclusions are based on little more than a series of graphs of student achievement on the National Assessment of Educational Progress in 1992 and 2007 and an untested assertion that, during that period, each of the four states infused substantial additional funds into public education in response to judicial orders. That is, the authors merely assert that these states experienced large infusions of funding, focused on low income and minority students, within the time period identified. They necessarily assume that, in all other states which serve as a comparison basis, similar changes did not occur. Yet they validate neither assertion. Baker and Welner (2011) explain that Hanushek and Lindseth failed to even measure whether substantive changes had occurred to the level or distribution of school funding as well as when and for how long. In New Jersey, for example, infusion of funding occurred from 1998 to 2003 (or 2005), thus Hanushek and Lindseth’s window includes 6 years on the front end where little change occurred (When?). Kentucky reforms had largely faded by the mid to late 1990s, yet Hanushek and Lindseth measure post reform effects in 2007 (When?). Further, in New Jersey, funding was infused into approximately 30 specific districts, but Hanushek and Lindseth explore overall changes to outcomes among low-income children and minorities using NAEP data, where some of these children attend the districts receiving additional support but many did not (Who?). In short the slipshod comparisons made by Hanushek and Lindseth provide no reasonable basis for asserting either the success or failures of state school finance reforms. Hanushek (2006) goes so far as to title the book “How School Finance Lawsuits Exploit Judges’ Good Intentions and Harm Our Children.” The premise that additional funding for schools often leveraged toward class size reduction, additional course offerings or increased teacher salaries, causes harm to children is, on its face, absurd. And the book which implies as much in its title never once validates that such reforms ever do cause harm. Rather, the title is little more than a manipulative attempt to convince the non-critical spectator who never gets past the book’s cover to fear that school finance reforms might somehow harm children. The book also includes two examples of a type of analysis that occurred with some frequency in the mid-2000s which also had the intent of showing that school funding doesn’t matter. These studies would cherry pick anecdotal information on either or both a) poorly funded schools that have high outcomes or b) well-funded schools that have low outcomes (see Evers & Clopton, 2006, Walberg, 2006).

In equally problematic analysis, Neymotin (2010) set out to show that massive court ordered infusions of funding in Kansas following Montoy v. Kansas led to no substantive improvements in student outcomes. However, Neymotin evaluated changes in school funding from 1997 to 2006, but the first additional funding infused following the January 2005 Supreme Court decision occurred in the 2005-06 school year, the end point of Neymotin’s outcome data.

Baker, B. D., & Welner, K. G. (2011). School finance and courts: Does reform matter, and how can we tell. Teachers College Record, 113(11), 2374-2414.

Hanushek, E. A., and Lindseth, A. (2009). Schoolhouses, Courthouses and Statehouses. Princeton, N.J.: Princeton University Press., See also: http://edpro.stanford.edu/Hanushek/admin/pages/files/uploads/06_EduO_Hanushek_g.pdf

Hanushek, E. A. (ed.). (2006). Courting failure: How school finance lawsuits exploit judges’ good intentions and harm our children (No. 551). Hoover Press.

Evers, W. M., and Clopton, P. (2006). “High-Spending, Low-Performing School Districts,” in Courting Failure: How School Finance Lawsuits Exploit Judges’ Good Intentions and Harm our Children (Eric A. Hanushek, ed.) (pp. 103-194). Palo Alto, CA: Hoover Press.

Walberg, H. (2006) High Poverty, High Performance Schools, Districts and States. in Courting Failure: How School Finance Lawsuits Exploit Judges’ Good Intentions and Harm our Children (Eric A. Hanushek, ed.) (pp. 79-102). Palo Alto, CA: Hoover Press.

Hanushek, E. A., and Lindseth, A. (2009). Schoolhouses, Courthouses and Statehouses. Princeton, N.J.: Princeton University Press., See also: http://edpro.stanford.edu/Hanushek/admin/pages/files/uploads/06_EduO_Hanushek_g.pdf

Greene and Trivitt (2008) present a study in which they claim to show that court ordered school finance reforms let to no substantive improvements in student outcomes. However, the authors test only whether the presence of a court order is associated with changes in outcomes, and never once measure whether substantive school finance reforms followed the court order, but still express the conclusion that court order funding increases had no effect.

Greene, J. P. & Trivitt, (2008). Can Judges Improve Academic Achievement? Peabody Journal of Education, 83(2), 224-237.

Neymotin, F. (2010) The Relationship between School Funding and Student Achievement in Kansas Public Schools. Journal of Education Finance 36 (1) 88-108.

[xii] Bruce D. Baker, “Revisiting the Age-Old Question: Does Money Matter in Education?” (Washington: Albert

Shanker Institute, 2012), available at http://www.shankerinstitute.org/images/doesmoneymatter_final.pdf.

[xiii] Bruce D. Baker and Preston C. Green III as well as William Koski and Rob Reich explain that to a large extent, education operates as a positional good, whereby the advantages obtained by some necessarily translate to disadvantages for others. For example, Baker and Green explain that, “In a system where children are guaranteed only minimally adequate K–12 education, but where many receive far superior opportunities, those with only minimally adequate education will have limited opportunities in higher education or the workplace.” Bruce D. Baker and Preston C. Green, “Conceptions of Equity and Adequacy in School Finance.” In Helen F. Ladd and Edward B. Fiske, eds., Handbook of Research in Education Finance and Policy (New York: Routledge, 2008), p. 203–221; Koski and Rob Reich, “When “Adequate” Isn’t: The Retreat From Equity in Educational Law and Policy and Why It Matters,” Emory Law Review 56 (3) (2006): 545–618, available at http://www.law.emory.edu/fileadmin/journals/elj/56/3/Koski___Reich.pdf.

UARK Study Shamelessly (& Knowingly) Uses Bogus Measures to Make Charter Productivity Claims

Any good study of the relative productivity and efficiency of charter schools compared to other schools (if such comparisons were worthwhile to begin with) would require precise estimates of comparable financial inputs and outcomes as well as the conditions under which those inputs are expected to yield outcomes.

The University of Arkansas Department of Education Reform has just produced a follow up to their previous analysis in which they proclaimed boldly that charter schools are desperately uniformly everywhere and anywhere deprived of thousands of dollars per pupil when compared with their bloated overfunded public district counterparts (yes… that’s a bit of a mis-characterization of their claims… but closer than their bizarre characterization of my critique).

I wrote a critique of that report pointing out how they had made numerous bogus assumptions and ill-conceived, technically inept comparisons which in most cases dramatically overstated their predetermined, handsomely paid for, but shamelessly wrong claims.

That critique is here: http://nepc.colorado.edu/files/ttruarkcharterfunding.pdf

The previous report proclaiming dreadful underfunding of charter schools leads to the low hanging fruit opportunity to point out that even if charter schools have close to the same test scores as district schools – and do so for so00000 much less money – they are therefore far more efficient. And thus, the nifty new follow up report on charter school productivity – or on how it’s plainly obvious that policymakers get far more for the buck from charters than from those bloated, inefficient public bureaucracies – district schools.

Of course, to be able to use without any thoughtful revision, the completely wrong estimates in their previous report, they must first dispose of my critique of that report – or pretend to.

In their new report comparing the relative productivity and efficiency of charter schools, UARK researchers assert that my previous critique of their funding differentials was flawed. They characterize my critique as focusing on differences specifically – and exclusively in percent free lunch population, providing the following rebuttal:

The main conclusion of our charter school revenue study was that, on average, charter schools nationally are provided with $3,814 less in revenue per-pupil than are traditional public schools. Critics of the report, including Gary Miron and Bruce D. Baker, claimed that the charter school funding gap we reported is largely due to charter schools enrolling fewer disadvantaged students than TPS.7 Miron stated that, “Special education and student support services explains most of the difference in funding.”8 Baker specifically claimed that charter schools enroll fewer students who qualify for free lunch and therefore suffer from deep poverty, compared to TPS.9

We have evidence with which to test these claims that the charter school funding gap is due to charters under-enrolling disadvantaged students, and that the gap would disappear if charters simply enrolled more special education students. To the first point, Table 1 includes aggregate data about the student populations served by the charter and TPS sectors for the 31 states in our revenue study. The states are sorted by the extent to which their charter sector enrolls a disproportionate percentage of free lunch students compared to their TPS sector. A majority of the states in our study (16 out of 31) have charter sectors that enroll a higher percentage of free lunch students than their TPS sector – directly contradicting Baker’s claim. Hawaii charters enroll the same percentage of free lunch students as do Hawaii TPS. For a minority of the states in our study (14 out of 31), their charter school sector enrolls a lower percentage of free lunch students than does their TPS sector.

Here’s the problem with this characterization. My critique was by no means centered on an assumption that charter schools serve fewer free lunch pupils than other schools statewide and that the gap would disappear if populations were more comparable.

My critique pointed out, among other things that making comparisons of charters schools to district schools statewide is misguided – deceitful in fact. As I explained in my critique, it is far more relevant to compare against district schools IN THE SAME SETTING. I make such comparisons for New Jersey, Connecticut, Texas and New York with far greater detail and documentation provided in this new UARK report. So no – they provide no legitimate refutation of my more accurate, precise and thoroughly documented claims.

But that’s only a small part of the puzzle. To reiterate and summarize my major points of critique:

As explained in this review, the study has one overarching flaw that invalidates all of its findings and conclusions. But the shortcomings of the report and its analyses also include several smaller but notable issues. First, it suffers from alarmingly vague documentation regarding data sources and methodologies, and many of the values reported cannot be verified by publicly available or adequately documented measures of district or charter school revenue. Second, the report constructs entirely inappropriate comparisons of student population characteristics—comparing, for example, charter school students to students statewide (using a poorly documented weighting scheme) rather than comparing charter school students to students actually served in nearby districts or with other schools or districts with more similar demographics. Similar issues occur with revenue comparisons.

Yet these problems pale in comparison to the one overarching flaw: the report’s complete lack of understanding of intergovernmental fiscal relationships, which results in the blatantly erroneous assignment of “revenues” between charters and district schools. As noted, the report purports to compare “all revenues” received by “district schools” and by “charter schools,” asserting that comparing expenditures would be too complex. A significant problem with this logic is that one entity’s expenditure is another’s revenue. More specifically, a district’s expenditure can be a charter’s revenue. Charter funding is in most states and districts received by pass-through from district funding, and districts often retain responsibility for direct provision of services to charter school students —a reality that the report entirely ignores when applying its resource-comparison framework. In only a handful of states are the majority of charter schools ostensibly fully fiscally independent of local public districts.3 This core problem invalidates all findings and conclusions of the study, and if left unaddressed would invalidate any subsequent “return on investment” comparisons.

So, back to my original point – any relative efficiency comparison must have comparable funding measures – and this new UARK study a) clearly does not and b) made no real attempt whatsoever to correct or even respond to their previous egregious errors.

The acknowledgement of my critique, highly selective misrepresentation of my critique, and complete failure to respond to the major substantive points of that critique display a baffling degree of arrogance and complete disregard for legitimate research.

Yes – that’s right – either this is an egregious display of complete ignorance and methodological ineptitude, or this new report is a blatant and intentional misrepresentation of data. So which is it? I’m inclined to believe the latter, but I guess either is possible.

Oh… and separately, in this earlier report, Kevin Welner and I discuss appropriate methods for evaluating relative efficiency (the appropriate framework for such comparisons)…. And to no surprise the methods in this new UARK report regarding relative efficiency are also complete junk. Put simply, and perhaps I’ll get to more detail at a later point, a simple “dollars per NAEP score” comparison, or the silly ROI method used in their report are entirely insufficient (especially as some state aggregate endeavor???).

And it doesn’t take too much of a literature search to turn up the rather large body of literature on relative efficiency analysis in education – and the methodological difficulties in estimating relative efficiency. So, even setting aside the fact that the spending measures in this study are complete junk, the cost effectiveness and ROI approaches used are intellectually flaccid and methodologically ham-fisted.

But if the measures of inputs suck to begin with, then the methods applied to those measures really don’t matter so much.

To say this new UARK charter productivity study is built on a foundation of sand would be offensive… to sand.

And I like sand.