This post is another in my series on data issues in education policy. The point of this post is to encourage readers of education policy research to pay closer attention to the fact that any measure of “per pupil spending” contains two parts – a measure of “spending” in the numerator and a measure of “pupils” in the denominator.
Put simply, both measures matter, and matching the right numerator to the right denominator matters.
Below are a few illustrations of why it’s important to pay attention to both the numerator and denominator when considering both variations across settings in education spending or variations over time in education spending.
Declining Enrollment Growth and Exploding Spending!
First it is important to understand that when the ratio of spending to pupils is growing over time, that growth may be a function of either or both, increasing expenditures in the numerator or declining pupils in the denominator. Usually, both parts are moving simultaneously, making interpretation more difficult. The State of Vermont over the past 20 years makes a fun example.
Vermont is among the highest per pupil spending states in the nation, and Vermont’s per pupil spending has continued to grow at a relatively fast pace over the past 20 years. Figure 1 shows Vermont’s per pupil spending growth (not adjusted for inflation, because choice of an inflator adds another level of complexity) in the upper half of the figure.
But, the lower half of the figure shows Vermont’s enrollment over the same period.
Figure 1. Vermont per Pupil Spending and Enrollments
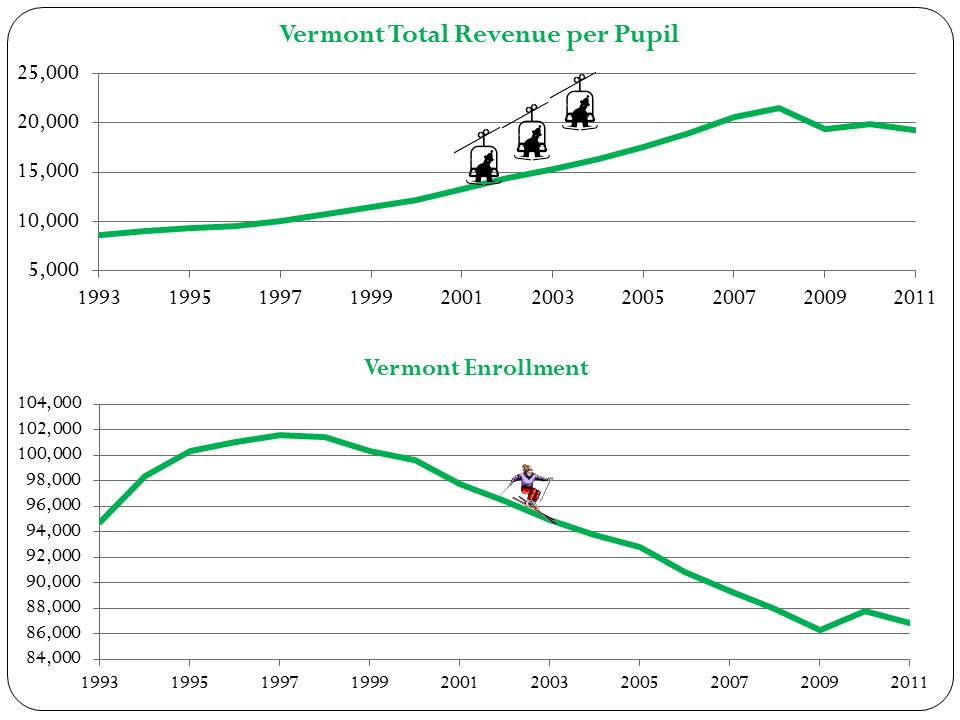
Clearly, given the dramatic enrollment statewide enrollment decline, even if total revenue and spending remained constant, or lagged significantly in its decline, per pupil spending would continue to grow.
Figure 2 breaks out the year over year growth rates of a) total revenue, b) enrollments and c) revenue per pupil. The math is pretty simple here, and the issue almost too obvious to bother with on this blog… but the point here is that if enrollment is declining by 2% annually, and total revenue (or spending) increasing by 4% to 6%, then per pupil revenue will increase by 6% to 8%.
Figure 2. Vermont % Change in Spending and Enrollment
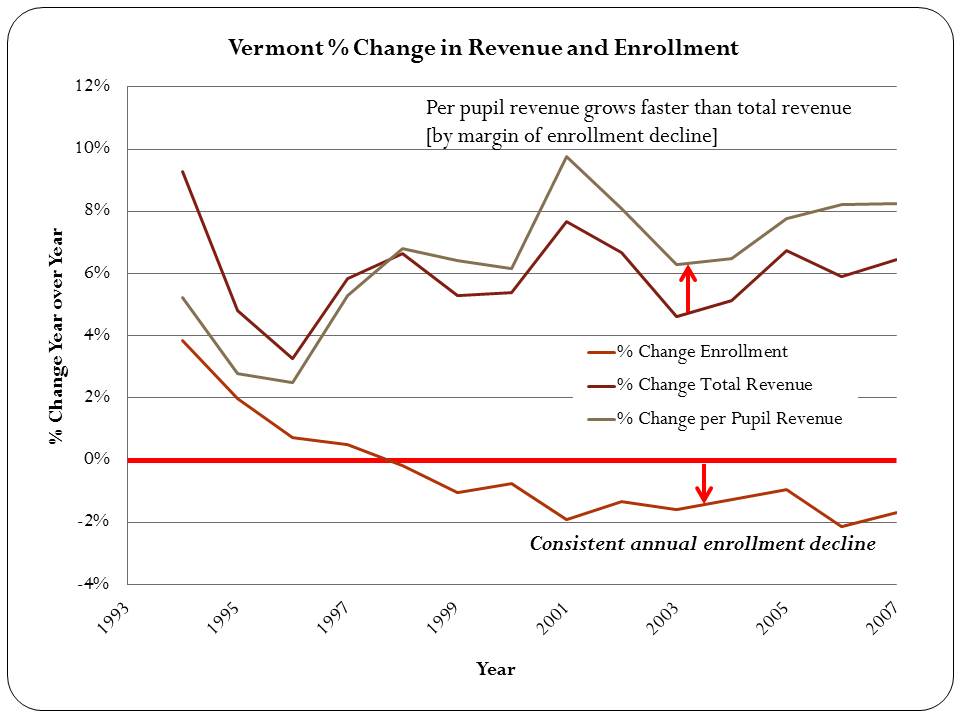
Yes, that’s all pretty simple and seemingly obvious. But, that doesn’t stop many from simply looking at per pupil spending growth as if it all represents spending growth. 8% annual growth likely plays differently to a political audience than 4% or 6% growth. Both parts are moving and we can’t forget that. Further, because the provision of education involves a mix of fixed, step and variable costs, we can’t expect spending changes to track perfectly with enrollment changes over time. But yes, we can and should expect appropriate adjustments down the line to accommodate the pupils that need to be served.
Equity Implications of Alternative Denominators: The ADA Game
I’ve written previously on this blog about different measures of student enrollment used in state school finance formulas, which are also used in presenting per pupil spending. A handful of states rely on “Average Daily Attendance” as a basis for providing state aid, and in turn as the method by which they report per pupil spending. As I’ve explained in previous posts, Average Daily Attendance measures vary systematically with respect to poverty, compared with enrollment measures. That is, on average, among those enrolled in a school, attendance rates tend to be lower on a daily basis in schools serving more low income and minority students. So, if one uses these measures to drive state aid to local districts, the result is systematically lower state aid in higher poverty, higher minority districts. But, if one uses these same measures to report per pupil spending, then no harm no foul… or so it seems.
As an aside, when pushed to rationalize financing schools on the basis of attendance, state policymakers often suggest that the purpose of the policy is to create an incentive for school officials to increase attendance rates.[i] The problems with this argument are many-fold. First, local public school districts remain responsible for providing the resources to educate all eligible enrolled children. While 90% may be in attendance on any given day, and while some children may be absent more than others, the same 90% are not in attendance every day. In all likelihood, 100% of eligible enrolled children attend at some point in the year. Second, depriving local public school districts of state aid lessens their capacity to provide interventions that might lead to improved attendance rates. Third, many school absences are simply beyond the control of local public school officials. This is particularly the case for poverty-induced, chronic health related absences. Finally, there exists little or no sound empirical evidence that this approach provides an effective incentive.[ii]
Figure 3 provides an illustration of how different per pupil spending figures look across Texas districts when reported by a) enrollment and b) average daily attendance with respect to shares of low income children. First, because few if any districts have perfect average daily attendance, the green dots – spending per enrolled pupil – are lower than the orange dots – spending per pupil in average daily attendance. Spending per enrolled pupil is simply lower than spending per pupil in average daily attendance. Further, while it would appear that spending per pupil in average daily attendance is higher in higher poverty districts than in lower poverty ones, that is not necessarily the case for spending per enrolled pupil (much smaller difference).
Figure 3. Per Pupil Spending and Low Income Concentrations in Texas
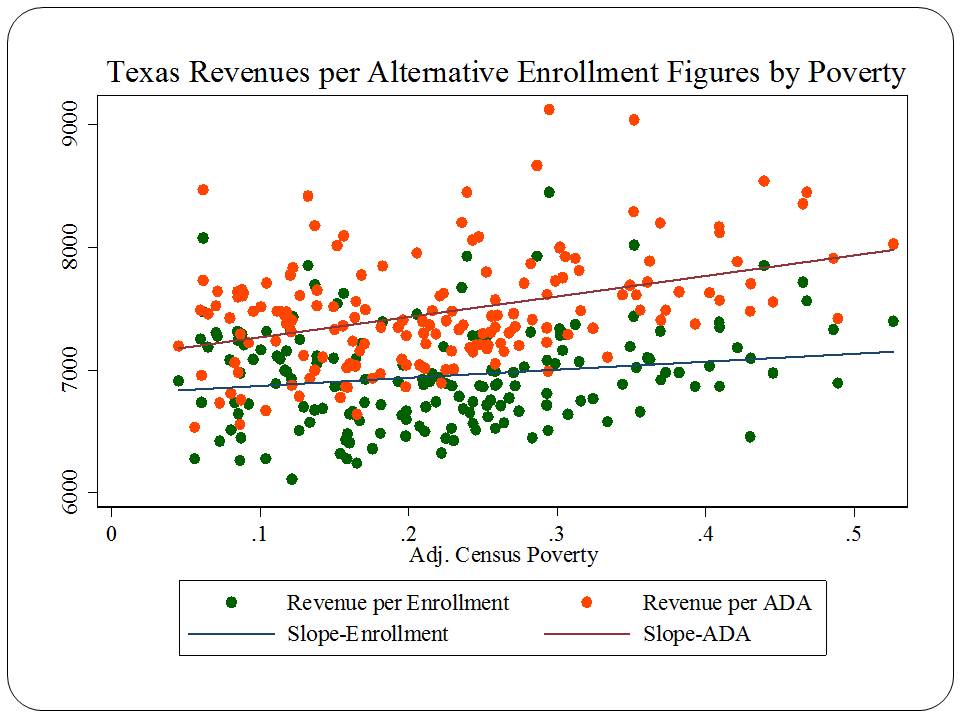
Figure provides an alternative view, collapsing data into low income quintiles.
Figure 4. Per Pupil Spending by Low Income Quintile in Texas
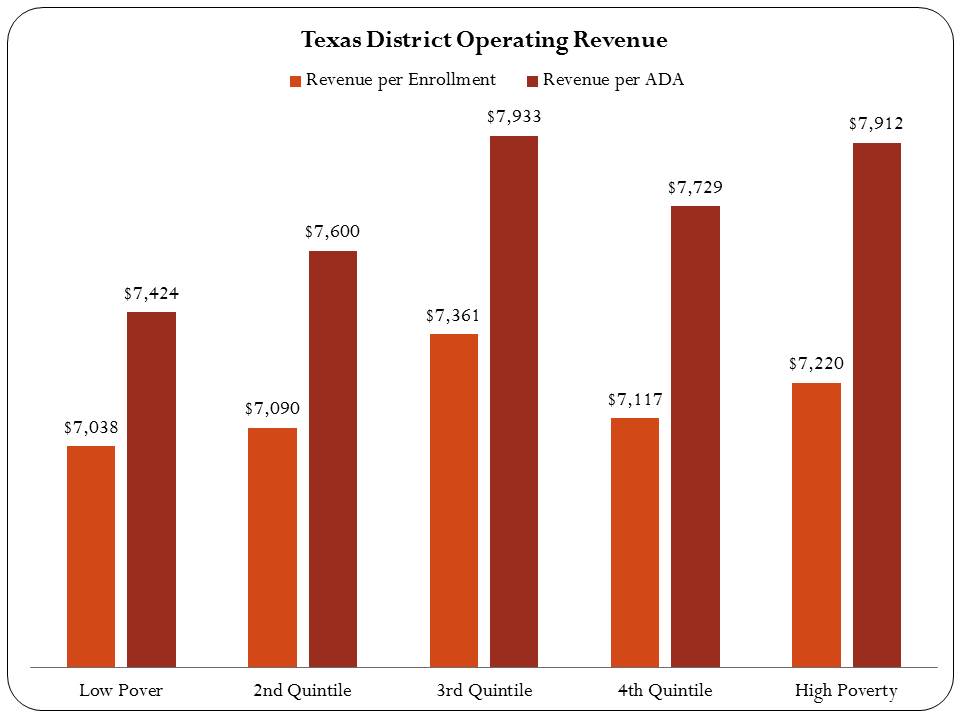
And it is certainly relevant that the districts in question here are obligated not merely to serve those who show up on a given day but to have resources available to all of whom for which they are held responsible. That is, those enrollment.
Matching the Numerator and Denominator: My expenditures on your pupils?
Finally, I’d like to address the somewhat more convoluted issue of matching the right numerator to the right denominator, especially when making spending comparisons across schools or districts.
I wrote extensively here, about making comparisons between brick and mortar vs. online schools.
And, I wrote extensively here about making comparisons between charter schools and district schools in New York City.
The increasing complexities of the interdependency relationships between district hosts and charter schools create significant confusion when comparing per pupil spending between host district and charter schools. In a recent report, I provide explanations of common (though likely intentional, after the 3rd or 4th iteration) mistakes. Here is one version of my critique of the Ball State study, which appears in Footnote 22, page 49 of this study: http://nepc.colorado.edu/files/rb-charterspending_0.pdf
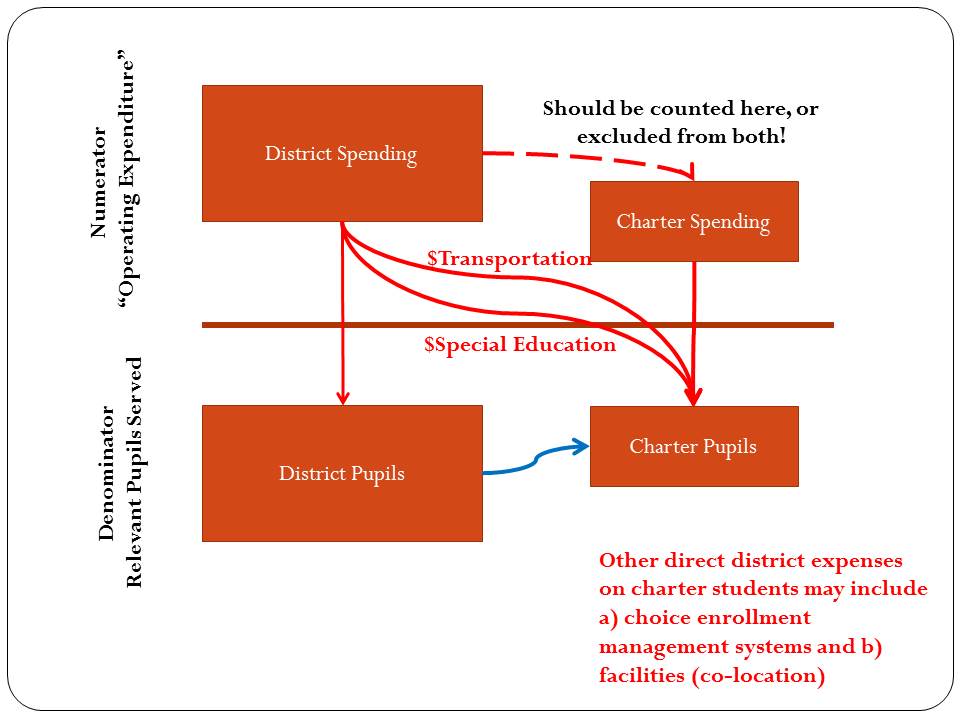
For example, under many state charter laws, host districts or sending districts retain responsibility for providing transportation services, subsidizing food services, or providing funding for special education services. Revenues provided to host districts to provide these services may show up on host district financial reports, and if the service is financed directly by the host district, the expenditure will also be incurred by the host, not the charter, even though the services are received by charter students.
Drawing simple direct comparisons thus can result in a compounded error: Host districts are credited with an expense on children attending charter schools, but children attending charter schools are not credited to the district enrollment. In a per-pupil spending calculation for the host districts, this may lead to inflating the numerator (district expenditures) while deflating the denominator (pupils served), thus significantly inflating the district’s per pupil spending. Concurrently, the charter expenditure is deflated.
Correct budgeting would reverse those two entries, essentially subtracting the expense from the budget calculated for the district, while adding the in-kind funding to the charter school calculation. Further, in districts like New York City, the city Department of Education incurs the expense for providing facilities to several charters. That is, the City’s budget, not the charter budgets, incur another expense that serves only charter students. The Ball State/Public Impact study errs egregiously on all fronts, assuming in each and every case that the revenue reported by charter schools versus traditional public schools provides the same range of services and provides those services exclusively for the students in that sector (district or charter).
Here’s a relatively straightforward, albeit incomplete illustration. Figure 5 shows that in many states, like New York, Connecticut or New Jersey, the relationship between district host and charter spending creates significant problems in equating numerators and denominators. In many states, as we explain above, host districts retain responsibility for spending on such things as charter student transportation or special education. Districts within stats may opt for different approaches to transportation financing, and some districts may opt to provide funding for centralized enrollment management or for facilities co-locations. The costs of providing these services typically remain on the ledger of the district. That is, they are in the district’s numerator, even when the pupils are removed from the denominator. This makes the resulting per pupil spending comparisons, well, simply wrong.
Figure 5. The Conceptual Problem with Matching Numerators and Denominators – Charter Spending Comparisons
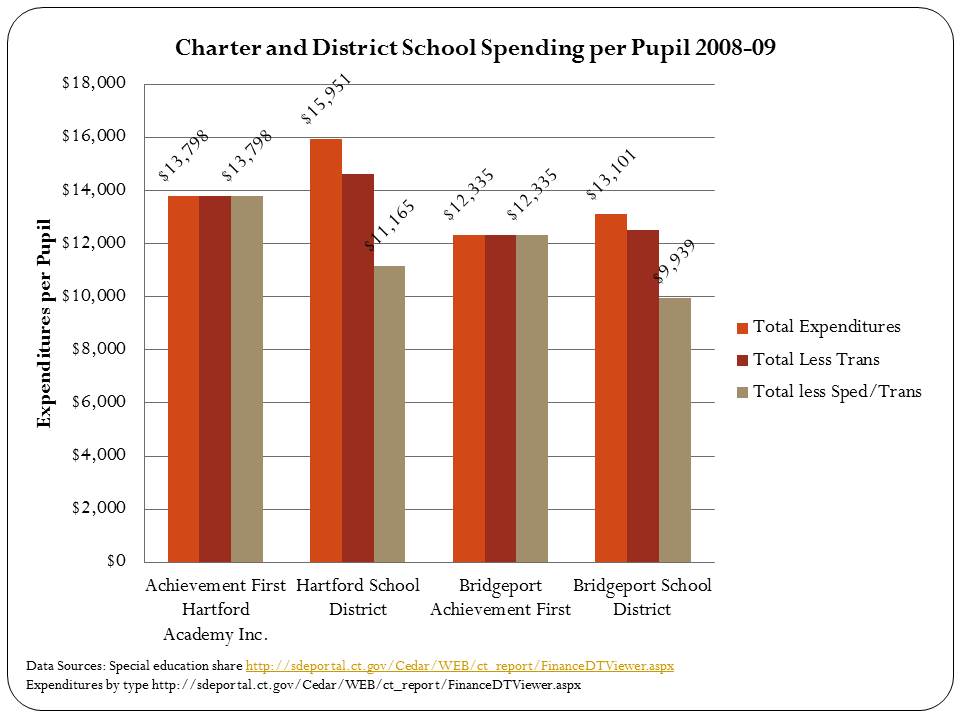
Connecticut is one state where responsibility for transportation and special education expense is retained by the district (while many CT charters serve very few children with disabilities to begin with). Figure 6 below provides an illustration of how charter to host district spending comparisons differ when one removes special education and transportation expenses from the districts’ numerator. When these expenses are included on the district’s expense, district spending is somewhat higher than charter spending, but when they are removed, in both cases district spending is lower.
Figure 6. Matching spending responsibilities for more accurate comparisons
Notably, this is far from a complete analysis. It is merely illustrative. Similar problems exist with reported data on charter school revenues and spending in New Jersey.
In New York City, the Independent Budget Office has produced a handful of useful reports on making relevant comparisons there.
============
Note: Charter advocates often argue that charters are most disadvantaged in financial comparisons because charters must often incur from their annual operating expenses, the expenses associated with leasing facilities space. Indeed it is true that charters are not afforded the ability to levy taxes to carry public debt to finance construction of facilities. But it is incorrect to assume when comparing expenditures that for traditional public schools, facilities are already paid for and have no associated costs, while charter schools must bear the burden of leasing at market rates–essentially an “all versus nothing” comparison. First, public districts do have ongoing maintenance and operations costs of facilities as well as payments on debt incurred for capital investment, including new construction and renovation. Second, charter schools finance their facilities by a variety of mechanisms, with many in New York City operating in space provided by the city, many charters nationwide operating in space fully financed with private philanthropy, and many holding lease agreements for privately or publicly owned facilities. (for more, see: http://nepc.colorado.edu/files/rb-charterspending_0.pdf, p49-50)
==============
[i]Recently, when New Jersey slipped the attendance factor into the determination of state aid, Education Commissioner Chris Cerf argued:
“When you look at the (difference) between the number of children on the rolls and the number of children in some of these schools, it can be very distressing,” Cerf said. “Pushing these districts to do everything in their power to get kids to attend class is good.” http://blogs.app.com/capitolquickies/2012/04/24/cerf-said-push-districts-to-get-kids-in-school/
[ii] A study published in the Spring 2013 issue of the Journal of Education Finance purports to find positive effects on attendance and graduation rates in states with “strong incentive” enrollment basis for funding, with particular emphasis on states relying on average daily attendance, but combining with them many (most) states using an average daily membership figure. Most problematically, the study draws its main conclusion from state aggregate cross sectional analyses, applying unsatisfyingly ambiguous classifications of state school finance policy count methods, and applying an approach which cannot separate finance policy effects from other contextual differences across states.
The final study is published here: Ely, Todd L., and Mark L. Fermanich. “Learning to count: school finance formula count methods and attendance-related student outcomes.” Journal of Education Finance 38.4 (2013): 343+
An earlier draft is available here: http://www.aefpweb.org/sites/default/files/webform/Fermanich_Ely_AEFP_2012.pdf


