School finance researchers have been evaluating and comparing district- and school-level expenditures for decades, drawing largely on regression-based approaches which account for differences in needs and costs across settings, districts and schools.[i] With charter schools introduced into the mix over the past several decades, researchers have extended those methods to study differences in spending between district and charter schools serving otherwise similar student populations. The most thorough example, and specific application of this approach is the study conducted on behalf of the Maryland Department of Education in 2016.
Step 1: Matching the Dollars to the Students
The first step in the process is ensuring that the right revenues and expenditures (numerator) are attached to the right students (denominator) when calculating per-pupil resources. This is a fatal flaw – egregious error – repeated time and time again – in the often cited University of Arkansas Department of Education Reform charter funding gap reports. Where charter schools are fiscally dependent on public districts (as in most of the locations addressed by the authors), some revenues sent to and spent by districts are spent on services for children attending charter schools. If we leave those in the district’s funding numerator, but take those pupils out (as they are in charter schools) that overstates district per-pupil funding and understates resources to charter schools. Further, some district revenue sources may be dedicated to other services outside of their own schools—be they community services or students tuitioned elsewhere.
Step 1 is to get a comparable, comprehensive school site spending figure for both district and charter schools, likely excluding special schools or services (those served and the resources spent) from the comparisons. A detailed explanation of the process of achieving a comparable spending figure is explained on page 9, section 2 of the AIR study referenced in this report (http://marylandpublicschools.org/stateboard/Documents/01242017/TabG-CharterPublicSchoolFundingStudy.pdf).
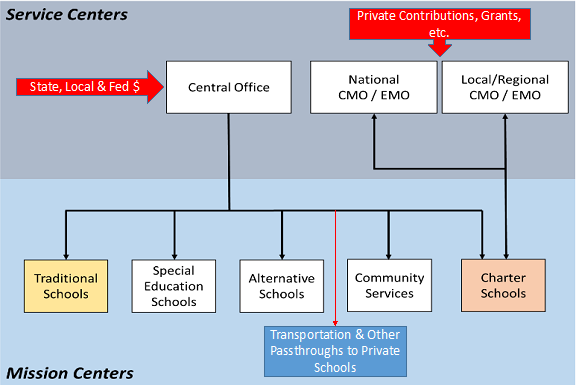
Figure 1 is adapted from a report for the Maryland Department of Education, where the goal was to determine the “commensurate” expenditures of district and charter schools in that state. Maryland charter schools, like those in many states are fiscal dependents of local districts: they are funded by a pass-through system, where local tax revenues and state aid “pass through” the district and to the charter for each resident student enrolled. The district also retains responsibility for the direct provision of some services for charter schools, including transportation and system-wide enrollment management. While the Maryland report focuses on comparing charter and district school spending, its broader goal is establishing data standards and methods for better evaluating equitable allocation of resources across schools within districts, where that context includes a variety of “mission centers,” including charter schools.
As Figure 1 shows, the majority of public/taxpayer financing for the system goes first to the school district. Only a portion of that funding then flows to typical (“regular,” “traditional”) general purpose schools. Districts provide a wide array of services, including providing special schools, where necessary, for children with significant special needs, and alternative placements or schools for children removed from general purpose schools due to disciplinary actions (as is required in New Jersey). Often, students with significant special needs are placed in schools outside the district’s direct control; the district, however, still retains the financial responsibility and pays tuition for the student. Districts also provide an array of community services, make facilities available for community organizations, subsidize transportation and textbooks for private school children (in many states), and provide for transportation and special education supports for children attending charter schools (in many states).
When evaluating resource equity across schools, the goal is to have as complete and comparable a measure as possible of the resources actually available to specific schools, based on the characteristics of students served in those schools. Doing so requires knowing not only which resources are assigned directly to individual schools – per Figure 1– but also identifying which other district services provide support to which schools, or provide support to activities that aren’t connected with individual schools – like providing community services. It would be inappropriate, for example, to take the total revenues received by the district, divided by the district’s own pupils, and compare those to the funding allocated to the charter school, divided by the charter schools’ pupils. This is because some of that revenue received by the district (even after subtracting direct transfers to charters) includes district spending on activities that serve charters, and funds obligated for support of private school students. District revenues allocated to special education schools, which serve student populations that differ substantially from those enrolled in charter schools, will operate at higher per pupil costs than charters.
These complications do not relate exclusively to comparisons between district and charter schools; they relate to any attempts to evaluate the equitable distribution of resources across schools within districts. Once we have isolated the comparable per pupil resources for all schools within a geographic space there will still exist important differences across student populations that must be accounted for when comparing school resources. This is true even when comparing the subset of “general purpose” district-operated schools and charter schools (most of which in New Jersey are “general purpose”).
Additional explanation provided in this report: https://www.njpp.org/wp-content/uploads/2020/11/NJPP-School-Funding-in-New-Jersey-A-Fair-Future-for-All-Part-5.pdf
Step 2: Modeling Spending Variation with Respect to Cost and Need Factors
The second step is to use that comparable spending figure (spending per pupil, school site) as the dependent variable in a regression model which accounts for a standard, well-known and frequently used set of factors. This is the approach used in the Maryland and California studies, as well as several peer-reviewed articles evaluating school site spending variation (whether focused on charter schools or not). The standard model is:
Spend = f(% Low Income, %ELL, % SWD LI/HC, % SWD HI/LC, % Grades 6 to 8, % Grades 9 to 12, Geographic Location, Year, Control*)
That is, spending is modeled as a function of the share of children from low-income families (using a measure set to an income threshold sufficient to capture variation across schools), % who are English language learners, % students with disabilities preferably at least in two groups by severity, % in different grade ranges such as to compare schools of similar grade range, and if beyond a single metropolitan area, some geographic indicator to capture labor cost differences. To determine whether charter schools are funded differently than TPS, one can include a dummy variable on charter status (control).
Table 1 provides an illustration with Maryland data. Table 1 shows that a school with 100% children from low-income families spends about $1,500 more per pupil than a school with 0% children from low-income families. A school with 100% ELL children spends only about $360 more than a school with 0% children who are ELLs. Special education populations, in the aggregate are by far the largest driver of spending differences with a school having 100% children with disabilities expected to spend nearly $22,000 per pupil more than a school with 0% children with disabilities. Notably, however as the share of those children with disabilities who are in the mild/moderate category increases, the overall spending margin decreases. Finally, charter schools are spending approximately $630 more per pupil than district schools—in the same district (fixed effect)—and serving otherwise similar student populations.
Table 1. Model of Maryland School Site Spending 2013-2015, Includes LEA Fixed Effect [schools weighted for enrollment. Estimated with Robust Standard Errors clustered on School]
| (1) | |
| VARIABLES | Commensurate Expense per Pupil |
| charter | 630.360* |
| (181.284) | |
| % school enrollment in grades 6 to 8 | 850.170* |
| (84.529) | |
| % school enrollment in grades 9 to 12 | 558.609* |
| (89.590) | |
| Percent Special Education | 21,929.519* |
| (1,132.973) | |
| % Students with Disabilities that are Non-Severe Disabilities | -1,212.161* |
| (361.059) | |
| Percent ESL | 358.567 |
| (435.256) | |
| Percent Low Income | 1,515.191* |
| (244.471) | |
| year = 2014 | 183.814* |
| (19.534) | |
| year = 2015 | 263.468* |
| (27.582) | |
| Constant | 8,475.939* |
| (410.742) | |
| Observations | 3,966 |
| R-squared | 0.504 |
| Robust standard errors in parentheses | |
| * p<0.05 |
[i] Baker, B.D. (2009). Within-district resource allocation and the marginal costs of providing equal educational opportunity: Evidence from Texas and Ohio. Education Policy Analysis Archives, 17(3). Retrieved August 10, 2021, from https://www.redalyc.org/pdf/2750/275019727003.pdf
Chambers, J.G., Levin, J.D., & Shambaugh, L. (2010). Exploring weighted student formulas as a policy for improving equity for distributing resources to schools: A case study of two California school districts. Economics of Education Review, 29(2), 283-300.
Chambers, J., Shambaugh, L., Levin, J., Muraki, M., & Poland, L. (2008). A tale of two districts: A comparative study of student-based funding and school-based decision making in San Francisco and Oakland Unified School Districts. American Institutes for Research.
Atchison, D., Baker, B., Levin, J., & Manship, K. (2017). Exploring the quality of school-level expenditure data: Practices and lessons learned in nine sites. Office of Planning, Evaluation and Policy Development, US Department of Education. Retrieved August 10, 2021, from https://files.eric.ed.gov/fulltext/ED584614.pdf
Baker, B.D., & Weber, M. (2016). State school finance inequities and the limits of pursuing teacher equity through departmental regulation. Education Policy Analysis Archives/Archivos Analíticos de Políticas Educativas, 24(37), 1-36.
Baker, B.D., Libby, K., & Wiley, K. (2015). Charter school expansion and within-district equity: Confluence or conflict?. Education Finance and Policy, 10(3), 423-465.
Toutkoushian, R.K., & Michael, R.S. (2007). An alternative approach to measuring horizontal and vertical equity in school funding. Journal of Education Finance, 32(4), 395-421.
Kolbe, T., Baker, B.D., Atchison, D., Levin, J., & Harris, P. (2021). The additional cost of operating rural schools: Evidence from Vermont. AERA Open, 7. Retrieved August 10, 2021, from https://journals.sagepub.com/doi/pdf/10.1177/2332858420988868
Berne, R., & Stiefel, L. (1994). Measuring equity at the school level: The finance perspective. Educational Evaluation and Policy Analysis, 16(4), 405-421.
Stiefel, L., Rubenstein, R., & Berne, R. (1998). Intra-district equity in four large cities: Data, methods and results. Journal of Education Finance, 23(4), 447-467.
Stiefel, L., Rubenstein, R., & Berne, R. (1998). Intra-district equity in four large cities: Data, methods and results. Journal of Education Finance, 23(4), 447-467.
Knight, D.S., & Toenjes, L.A. (2020). Do charter schools receive their fair share of funding? School finance equity for charter and traditional public schools. Education Policy Analysis Archives, 28(51), 1-40.
