Here it is – my annual update of America’s most screwed school districts. This time, for stability purposes, I’ve used a 3-year average based on 2009-2011 data (2011 data being released earlier this week).
As I’ve explained in my previous posts on this topic (from last year’s post on screwed districts)…
It’s important to understand that the value of any given level of education funding, in any given location, is relative. That is, it doesn’t simply matter that a district has or spends $10,000 per pupil, or $20,000 per pupil. What matters is how that funding compares to other districts operating in the same labor market, and for that matter, how that money relates to other conditions in the region/labor market. Why? Well, schooling is labor intensive. And the quality of schooling depends largely on the ability of schools or districts to recruit and retain quality employees. And yes… despite reformy arguments to the contrary – competitive wages for teachers matter! The largest share of school district annual operating budgets is tied up in the salaries and wages of teachers and other school workers. The ability to recruit and retain teachers in a school district in any given labor market depends on the wage a district can pay to teachers a) relative to other surrounding schools/districts and b) relative to non-teaching alternatives in the same labor market.
In our funding fairness report, we present statewide profiles of disparities in funding with respect to poverty. But, I thought it would be fun (albeit rather depressing) here to try to identify some of the least well-funded districts in the country. Now, keep in mind that there are still around 15,000 districts nationwide.
Here is this year’s empirical definition of “screwed” in school finance terms:
- State and Local Revenue per Pupil (Census Fiscal Survey, 3-year Average) less than 95% of average for districts in the same labor market*
- Adjusted Census Poverty Rate for 5 to 17 year olds (Census Small Area Income and Poverty Estimates, 3-year average) greater than 50% above average for districts in the same labor market.
*where “labor market” is defined as it is defined in the NCES Education Comparable Wage Index (essentially by core based statistical area for all districts in metropolitan or micropolitan areas).
Put very simply, districts with higher student needs than surrounding districts in the same labor market don’t just require the same total revenue per pupil to get the job done. They require more. Higher need districts require more money simply to recruit and retain similar quantities (per pupil) of similar quality teachers. That is, they need to be able to pay a wage premium. In addition, higher need districts need to be able to both provide the additional program/service supports necessary for helping kids from disadvantaged backgrounds (including smaller classes in early grades) while still maintaining advanced and enriched course options.
The districts in this table not only don’t have the “same” total state and local revenue per pupil than surrounding districts. They have less and in some cases they have a lot less! In many cases their child poverty rate is more than twice that of the surrounding districts that continue to have more resources.
| State, District | Relative Poverty | Relative State & Local Revenue |
| Alabama,Bessemer City School District | 2.046 | 0.837 |
| Alabama,Fairfield City School District | 1.562 | 0.803 |
| Arizona,Sunnyside Unified District | 1.681 | 0.816 |
| California,Bayshore Elementary School D | 1.579 | 0.718 |
| California,Ravenswood City Elementary S | 1.715 | 0.749 |
| California,West Fresno Elementary Schoo | 1.793 | 0.739 |
| Colorado,Adams-Arapahoe School District | 1.758 | 0.915 |
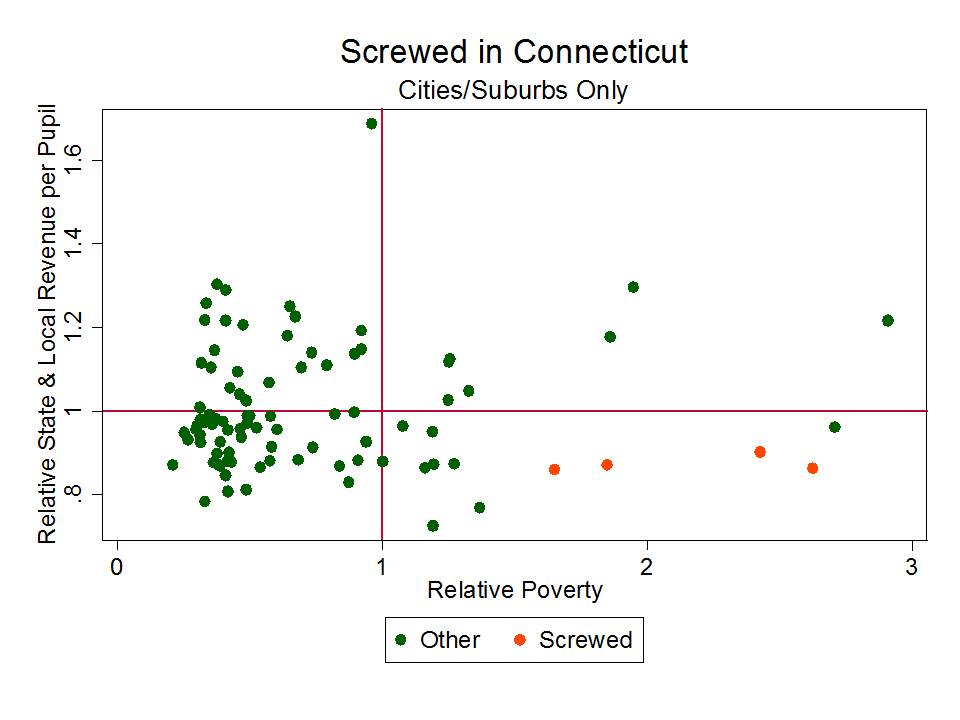
| Connecticut,Bridgeport School District | 2.626 | 0.863 |
| Connecticut,East Hartford School Distri | 1.651 | 0.86 |
| Connecticut,New Britain School District | 2.427 | 0.903 |
| Connecticut,Waterbury School District | 1.849 | 0.871 |
| Delaware,Colonial School District | 1.573 | 0.94 |
| Georgia,Spalding County School District | 1.578 | 0.876 |
| Idaho,Caldwell School District 132 | 1.925 | 0.875 |
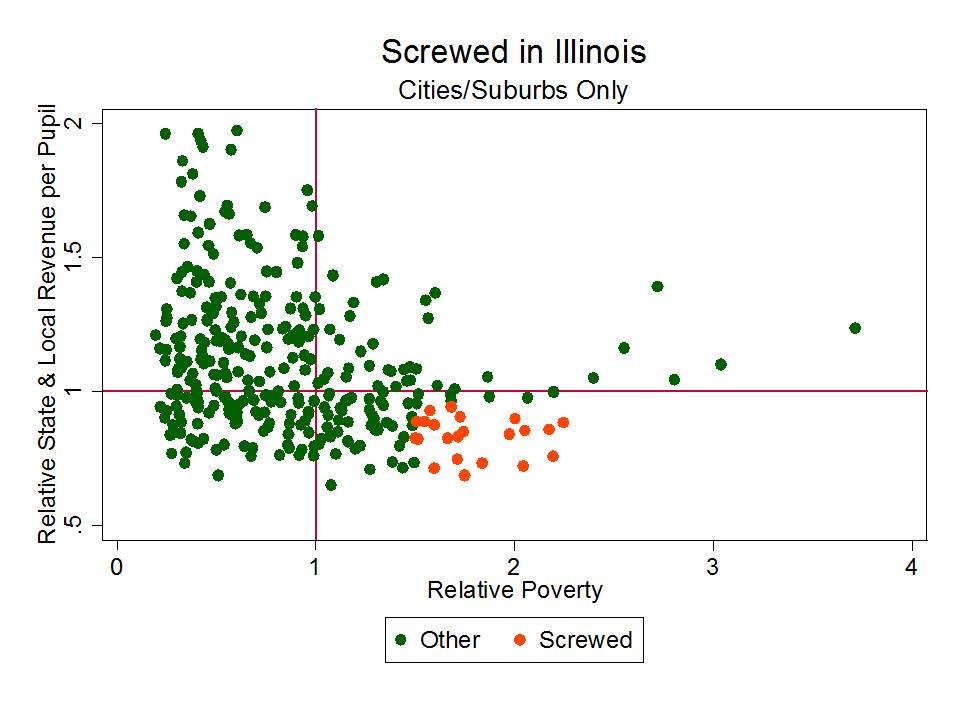
| Illinois,Chicago Public School District | 1.663 | 0.825 |
| Illinois,Granite City Community Unit Sc | 1.515 | 0.823 |
| Illinois,Kankakee School District 111 | 1.681 | 0.943 |
| Illinois,North Chicago School District | 2.174 | 0.857 |
| Illinois,Round Lake Community Unit Scho | 1.836 | 0.733 |
| Illinois,Waukegan Community Unit School | 2.044 | 0.722 |
| Indiana,Edinburgh Community School Corp | 1.709 | 0.912 |
| Indiana,Hammond School City | 1.547 | 0.948 |
| Indiana,River Forest Community School C | 1.598 | 0.941 |
| Kentucky,Dayton Independent School Dist | 1.861 | 0.797 |
| Massachusetts,Blackstone-Millville Scho | 1.804 | 0.918 |
| Massachusetts,Dennis-Yarmouth School Di | 1.509 | 0.95 |
| Massachusetts,Everett School District | 2.295 | 0.833 |
| Massachusetts,Lowell School District | 2.425 | 0.898 |
| Massachusetts,Revere School District | 1.774 | 0.807 |
| Massachusetts,Webster School District | 1.697 | 0.909 |
| Michigan,Clarenceville School District | 1.634 | 0.945 |
| Michigan,Clintondale Community Schools | 1.789 | 0.829 |
| Michigan,East Detroit Public Schools | 1.803 | 0.864 |
| Michigan,Godfrey-Lee Public Schools | 1.893 | 0.913 |
| Michigan,Hamtramck Public Schools | 2.114 | 0.793 |
| Michigan,Inkster City School District | 1.519 | 0.837 |
| Michigan,Kelloggsville Public Schools | 1.589 | 0.929 |
| Michigan,Madison Public Schools | 1.914 | 0.908 |
| Michigan,Port Huron Area School Distric | 1.814 | 0.775 |
| Michigan,Roseville Community Schools | 1.638 | 0.924 |
| Missouri,Independence Public Schools | 1.622 | 0.943 |
| Missouri,Jennings School District | 2.086 | 0.891 |
| Missouri,Ritenour School District | 1.5 | 0.896 |
| Missouri,Riverview Gardens School Distr | 1.979 | 0.853 |
| New Hampshire,Manchester School Distric | 1.826 | 0.85 |
| New Hampshire,Rochester School District | 1.826 | 0.87 |
| New Hampshire,Somersworth School Distri | 1.615 | 0.899 |
| New Jersey,Bound Brook Borough School D | 1.727 | 0.929 |
| New Jersey,Carteret Borough School Dist | 1.781 | 0.873 |
| New Jersey,Irvington Township School Di | 2.023 | 0.906 |
| New Jersey,Penns Grove-Carneys Point Re | 1.57 | 0.929 |
| New Jersey,Pennsauken Township School D | 1.605 | 0.939 |
| New Jersey,South Amboy City School Dist | 1.705 | 0.895 |
| New Jersey,Woodbury City School Distric | 1.565 | 0.946 |
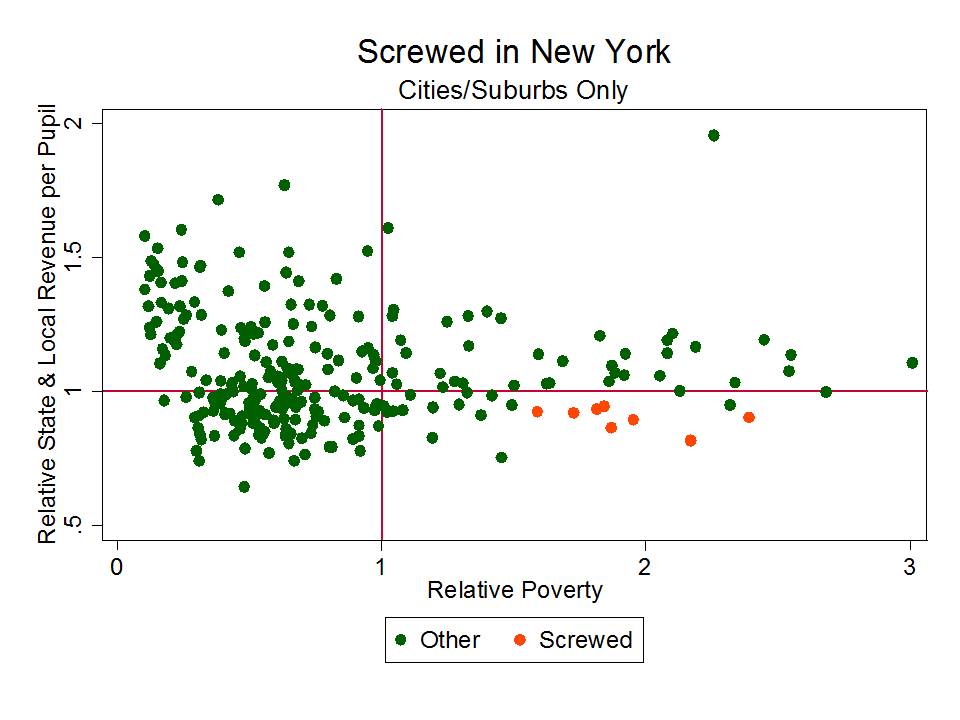
| New York,Binghamton City School Distric | 1.815 | 0.936 |
| New York,Brentwood Union Free School Di | 2.17 | 0.817 |
| New York,Copiague Union Free School Dis | 1.844 | 0.945 |
| New York,Lansingburgh Central School Di | 1.953 | 0.895 |
| New York,Schenectady City School Distri | 2.39 | 0.903 |
| New York,Utica City School District | 1.87 | 0.865 |
| New York,Watervliet City School Distric | 1.59 | 0.925 |
| New York,William Floyd (Mastic Beach) U | 1.727 | 0.919 |
| North Carolina,Kannapolis City Schools | 1.529 | 0.688 |
| Ohio,Campbell City School District | 1.509 | 0.9 |
| Ohio,Clearview Local School District | 1.628 | 0.66 |
| Ohio,New Miami Local School District | 1.909 | 0.827 |
| Ohio,Northridge Local School District | 2.173 | 0.915 |
| Ohio,Painesville City Local School Dist | 1.667 | 0.946 |
| Oregon,Centennial School District 28J | 1.621 | 0.9 |
| Oregon,David Douglas School District 40 | 2.008 | 0.933 |
| Oregon,Reynolds School District 7 | 1.974 | 0.927 |
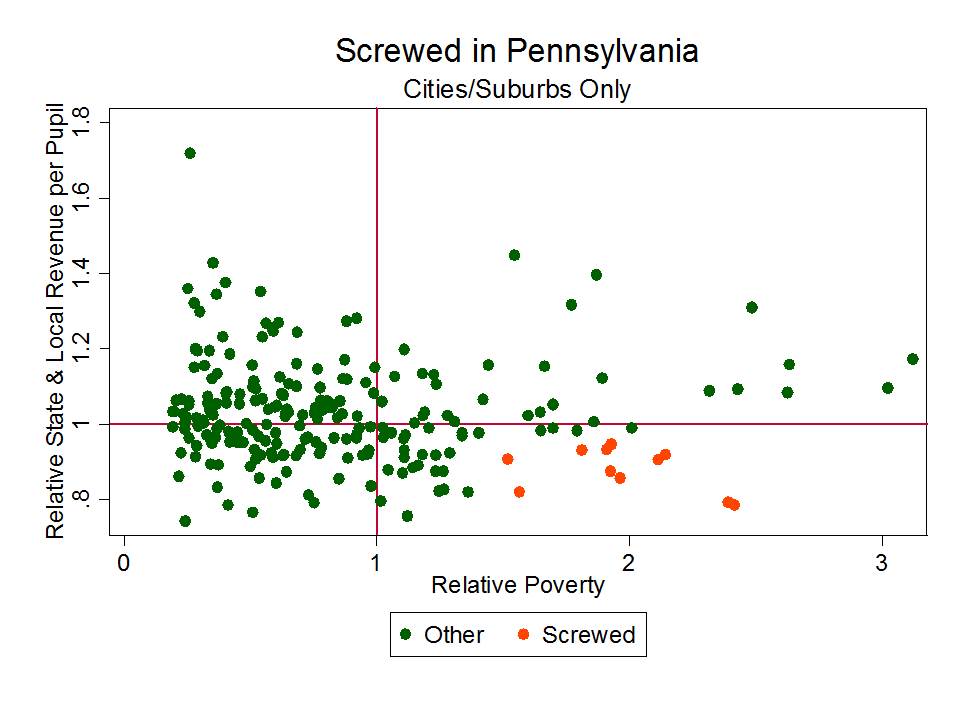
| Pennsylvania,Allentown City School Dist | 2.417 | 0.784 |
| Pennsylvania,Big Beaver Falls Area Scho | 1.811 | 0.93 |
| Pennsylvania,Connellsville Area School | 1.926 | 0.874 |
| Pennsylvania,Highlands School District | 1.517 | 0.907 |
| Pennsylvania,Laurel Highlands School Di | 1.564 | 0.82 |
| Pennsylvania,Lebanon School District | 2.143 | 0.919 |
| Pennsylvania,McKeesport Area School Dis | 1.927 | 0.947 |
| Pennsylvania,New Kensington-Arnold Scho | 1.91 | 0.932 |
| Pennsylvania,Philadelphia City School D | 2.115 | 0.905 |
| Pennsylvania,Reading School District | 2.39 | 0.792 |
| Pennsylvania,Uniontown Area School Dist | 1.963 | 0.857 |
| Rhode Island,Pawtucket School District | 1.604 | 0.793 |
| Rhode Island,Woonsocket School District | 1.983 | 0.764 |
| Tennessee,Hawkins County School Distric | 1.552 | 0.863 |
| Texas,Aldine Independent School Distric | 1.634 | 0.917 |
| Texas,Alief Independent School District | 1.597 | 0.93 |
| Texas,Castleberry Independent School Di | 1.575 | 0.897 |
| Texas,Dallas Independent School Distric | 1.871 | 0.95 |
| Texas,Edgewood Independent School Distr | 1.772 | 0.944 |
| Texas,Fort Worth Independent School Dis | 1.654 | 0.935 |
| Texas,North Forest Independent School D | 1.942 | 0.904 |
| Texas,San Antonio Independent School Di | 1.698 | 0.891 |
| Vermont,Winooski Incorporated School Di | 2.818 | 0.867 |
| Virginia,Fredericksburg City Public Sch | 2.411 | 0.806 |
| Virginia,Hopewell City Public Schools | 1.94 | 0.92 |
| Virginia,Manassas City Public Schools | 1.548 | 0.936 |
| Virginia,Norfolk City Public Schools | 1.681 | 0.939 |
List includes only those districts with Urban Centric Locale Codes for Cities (11,12,13) or Suburbs (21,22,23).
And here’s a list of the states with the largest shares of children attending “screwed” districts:
| State | % Attending Screwed Districts |
| Illinois | 24% |
| Pennsylvania | 15% |
| New Hampshire | 15% |
| Connecticut | 12% |
| Delaware | 12% |
| West Virginia | 11% |
| Rhode Island | 11% |
| Texas | 9% |
| Arizona | 9% |
| Vermont | 6% |
| Oregon | 5% |
| Colorado | 5% |
| Missouri | 5% |
Here are the patterns of “screwedness” in states which seem to have relatively large numbers of screwed districts.
In short – school funding disparities are alive and well – and certainly don’t appear to by improving substantively in recent years. More on that at a later point.

Would you please create a table that has the percentage of districts/schools/kids that are screwed in each state relative to the sample of districts/schools/kids in your analysis? The you could rank states based on screwing over the highest percentage of districts/schools/kids.
hope to get to it sometime.
May 24, 2013
Bruce, your list of districts only uses measures of poverty and state/.local revenue. Your measures do not account for property wealth. Let’s take William-Floyd UFSD which is on the frontier of the Hamptons. The property values in this community are quite high. And I suspect that there have been some immigration of high need families and groups on the south-shore of Long-Island that has raised the actual poverty measure of some communities (Copiague, Brentwood, etc). But one must also account for property wealth. And Long-Island property is taxed out of sight at the local level. So, these communities are property-rich and enjoy less money from the state despite the fact that higher pockets of poverty might prevail. This is true in NY’s foundation program and when it had a percentage-equalizing formula from the 1960s to the Pataki administration.
Another factor that you do not consider is mis-management. William-Floyd was one of the districts in 2009 were massive mis-management occurred and spurred on the state to hire over eighty accounts to conduct audits, even external audits — which are now standard operating procedures throughout New York.
And the sole district that you mentioned in Kentucky — Dayton Independent Schools — has undergone a significant state audit. I will send you the state audit report. It is absolute amazing about the mismanagement in this district, where the former superintendent has been found to steel district funds ($223,000.00) in 2012 or 2013 — which was I believe was the exact amount or close that the former Roslyn UFSD superintendent — along with William Floyd and Three Rivers Village — was to have stolen — but we know in Roslyn’s case that this was much more. What am I saying about Dayton — the local community has probably been reluctant to raise substantial revenue due to school district mismanagement despite the fact that school districts in Kentucky get matching funds for operating aid and school construction. And Kentucky’s General Assembly probably has been reluctant fund Dayton at its fullest capacity due its debilitating MIS-MANAGEMENT and unethical stewardship practices.
Simply stated, if property values and mismanagement are factored in, then these might explain why there are disparate measures of poverty and state share in some of the school districts that you listed.. In other words, measures of pupil’s poverty count and state share may not explain the entire fiscal profile of a district. In remembrance of Paul Harvey, I have tried to give “the rest of the story” regarding a couple of school districts on your list.
All in all, you continue to spur intriguing dialogue in school-finance policy.
Tyrone Bynoe
Okay… completely intentional omissions. Here’s why…
1. Property wealth relates to local fiscal capacity to raise revenues. It may be the case that some relatively high wealth districts that now have high needs have chosen not to raise local effort to generate sufficient revenue. IN which case, the local district is partly to blame for the inadequacy. But, the state is ultimately responsible, even if that means requiring a higher local effort. IN NY state, in general, the districts with greater needs and less total state and local revenue already levy higher local effort. There are clearly exceptions.
2. Regarding mismanagement… That any one of these districts might be mismanaging whatever they have does not excuse the fact that they have higher needs and fewer total resources than their neighbors. Indeed, it only makes a bad situation worse. But ultimately, where a state constitutional obligation exists, ensuring accountability to guard against such mismanagement becomes a state responsibility. But it cannot be an excuse for failing to provide adequate resources.
Interesting… I worked in one of those districts for three years. In fact, many of us did, some even made it to that 4th year after which the district would be required to follow contract due process procedures. It’s much easier to just fire your teachers before they get “expensive.” I really felt sorry for the young teachers who had wasted four years there. Not being given “tenure” after your fourth year can be a bit of a red flag to other districts if they are unfamiliar with how the system works. I got two years of excellent evaluations followed by satisfactory in my third when they were trying to justify not rehiring me. I don’t know why they bother; they don’t have to have a reason, and at my age, it has become pretty clear that I will not be rehired.
Sadly, I’m from Pennsylvania and I live in CT, so I only get to see the most screwed. I’m curious – which states are doing the best jobs of adequately and equitably funding their schools? It would be good to see how a well functioning model works.
A fine point. I need to be less negative and highlight the good… or at least less bad stuff. New Jersey has done relatively well but has slipped in the past 3 years quite substantially. Massachusetts also does well, and Ohio has generally done well. Pennsylvania and Illinois are certainly among the worst. Connecticut is selectively & irregularly bad. New Britain, Bridgeport and Waterbury get screwed. Hartford and New Haven somewhat less so… but much of their additional funding is tied up in the magnet programs.
Very sad situation and it effects both finance and education system.