
Today, with much fanfare, we finally got our New Jersey Charter School Report. The unsurprising findings of that report are that charter schools in Newark in particular seem to be providing students with greater average annual achievement gains than those of similar (matched) students attending district schools. Elsewhere around the state charter schools are pretty much average.
Link to report: http://credo.stanford.edu/pdfs/nj_state_report_2012_FINAL11272012.pdf
So then, the big question is, what exactly is behind the apparent success of Newark Charter schools – or at least some of them enough to influence the analysis as a whole – that makes them successful? Further, and perhaps more importantly, is there something about these schools that makes them successful that can be replicated?
The General Model
Allow me to start by pointing out that the CREDO study uses its usual approach – a reasonable one given data and system constraints, of identifying matched sets of students from feeder schools (or areas) who end up in district schools and in charter schools. CREDO then compares (estimates) the year to year test score gains of students in the charter and district schools.
The CREDO approach, while reasonable, simply can’t sort out which component of student achievement gain is created by “school factors” (such as teacher quality, length of day/year, etc.) and which factors are largely a function of concentrating non-low income, non-ell, non-disabled females in charter schools while concentrating the “others” in district schools.
School Effect = Controllable School Factors + Peer Group & Other Factors
In other words, we simply don’t know what component of the effect has to do with school quality issues that might be replicated and what component has to do with clustering kids together in a more advantaged peer group. Yes, the study controls for the students’ individual characteristics, but no, it cannot sort out whether the clustering of students with more or less advantaged peers affects their outcomes (which it certainly does). Lottery-based studies suffer the same problem, when lotteried in and lotteried out students end up in very different peer contexts. Yes, the sorting mechanism is random, but the placement is not. The peer selection effect may be exacerbated by selective attrition (shedding weaker and/or disruptive students over time). And Newark’s highest flying charter schools certainly have some issues with attrition.
Given my numerous previous posts, I would suggest Figure 1 as the general model of the secrets of Newark Charter School success.
Figure 1. The General Model

Put simply, while resource use – additional time, compensation, etc. – may be part of the puzzle – the scalable part – the strong sorting patterns of students into charter and district schools clearly play some role – a substantial role – and one that constrains our ability to use “chartering” as a broad-based public policy solution.
One Part Segregation
Let’s start by taking a look at the most recent available data on the segregation of students by disability status, free lunch status, gender and language proficiency. Now, the CREDO report is careful to point out that charter school enrollments match the demographics of their feeder schools – and uses this finding as an indication that therefore charter schools aren’t cream-skimming. That’s all well and good…. EXCEPT … that for some (actually many) reason, charter schools themselves end up having far fewer of the lowest income students. See Figure 2.
Figure 2. % Free Lunch

Now, one technical quibble I have with the CREDO report is that it relies on the free/reduced priced lunch indicator to identify economic disadvantage (and then sloppily throughout refers to this as “poverty”). I have shown on numerous previous occasions that Newark charters tend to serve larger shares of the less poor children and smaller shares of the poorer children. So, it is quite likely that the CREDO matched groups of students actually include disproportionate shares of “reduced lunch” children for charters and “free lunch” children sorted into district schools. This is a non-trivial difference! [gaps between free lunch and reduced lunch students tend to be comparable to gaps between reduced lunch and non-qualified students.]
Here are the other sorting issues:
Figure 3. % ELL/LEP

Figure 4. % Female

Figure 5 shows that not only do charter schools in Newark tend to serve far fewer children with disabilities, they especially serve few or no students with more severe disabilities. In fact, they serve mainly students with Specific Learning Disabilities and Speech Language Impairment. Given the data in Table 5, it is actually quite humorous – if not strangely disturbing – that the CREDO study attempted to parse the relative effectiveness of district and charter schools at producing outcomes for children with disabilities using only a single broad classification [Student matching was based on a single classification, creating the possibility that children with speech language impairment in charters were being compared with children with mental retardation and autistic children in district schools. It is likely that most students who took the assessments were those with less severe disabilities in both cases.].
Figure 5. Special Education Distributions

Here are some related findings from (and links to) previous posts
Newark Charter Effects on NPS School Enrollments
New Jersey Charter School Special Education
Newark Charter School Attrition Rates
Here are just a few visuals of how the free lunch shares and female student test-taker shares relate to general education proficiency rates on 8th grade math. Both are relatively strong determinants of cross-school proficiency. And both with respect to gender balance and free lunch balance, Newark Charter schools are substantively different from their district school counterparts.
Figure 6: 8th Grade Math & % Free Lunch

Figure 7: 8th Grade Math & % Female

Now, these are performance level differences, which are not the same as the gain measures estimated in the CREDO study. But, I’ve chosen the 8th grade scores because that is when the charter scores tend to pull away from the district school scores (that is, these are the score levels at the tail end of achieving greater gains). But, the contexts of the gains for charter students are so substantially different from the contexts of achievement gains for district school students that scalability is highly questionable.
As I’ve said before – There just aren’t enough non-disabled, non-poor, fluent English speaking females in Newark to fully replicate district-wide the successes of the city’s highest flying charters.
One Part Compensation
Now, I’ve also written many posts which address the resource advantages and some resource allocation issues for high flying New York City charter schools, which a) also promote substantial student population segregation and b) have been shown in numerous studies to yield positive achievement gains.
I do not intend to imply by my above critique that peer group effect is necessarily the ONLY effect driving Newark Charter’s supposed success. The problem is that because high flying Newark Charters in particular serve such uncommon student populations we can never really sort out the peer group versus school quality effects.
It is certainly reasonable to assume that the additional time and effort spent with these students in some schools – even though they are a more advantaged (less disadvantaged) group – makes a difference. No excuses charters in Newark like those in New York City tend to provide longer school days and longer school years, and importantly, they compensate their teachers for the additional time & effort. Here’s a simple chart of the average teacher compensation for early career teachers in NPS and Newark Charters. NPS teachers catch back up in later years, but as I’ve pointed out in numerous previous posts, a handful of Newark charters have adopted the reasonable (smart) competitive strategy of leveraging higher salaries and salary growth at the front end to improve teacher retention and recruitment.
Figure 9: Newark Teacher Compensation
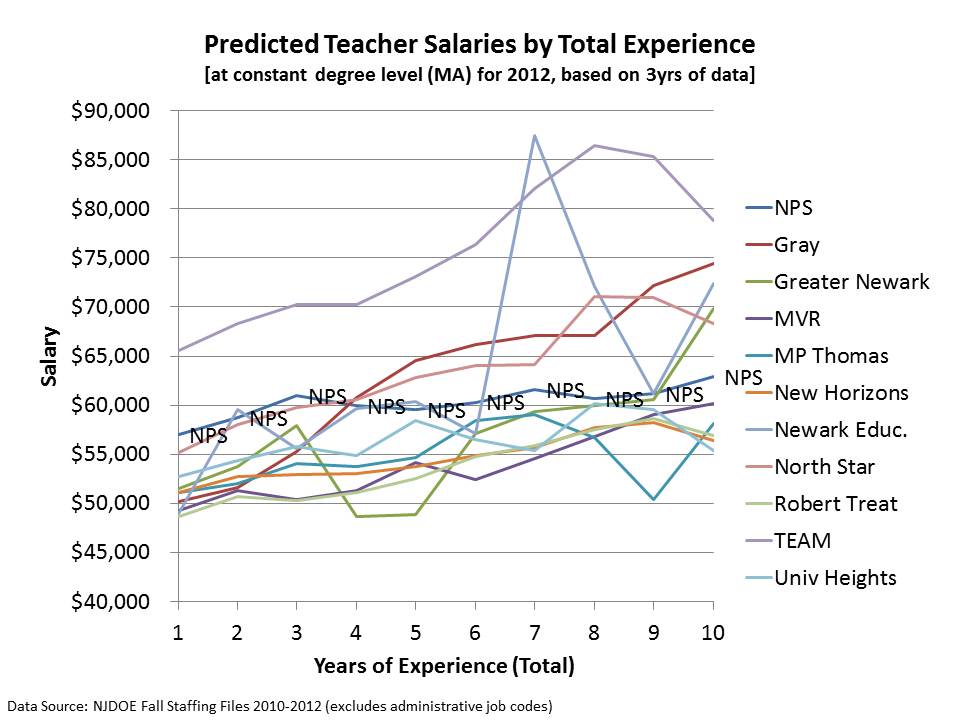
 Below is a more precise comparison that teases out the differences that aren’t so apparent in Figure 9. For Figure 10, I have used 3 years of data on teachers to estimate a regression model of teacher salaries as a function of experience, degree level and data year.
Some of Newark’s “high flying charters” [North Star, Gray, TEAM] tend to substantially outpace salaries of NPS teachers over the first ten years of a teacher career. Few of these schools have any teachers with more years of experience than 10. Other Newark charter schools maintain at least relatively competitive salaries with NPS.
Now, a critical point here is that as I’ve shown above, teaching in many of these schools comes with the perk of working with a much more advantaged student population. As such, it is conceivable that even a comparable wage provides recruitment advantage – given the student population difference. Clearly, a higher wage provides a significant recruitment advantage – though in the case of the highest paying school(s), the elevated salary comes with substantial additional obligations.
Figure 10. Modeled Teacher Salary Variation by Experience
Closing Thoughts
So, when all is said and done, this new “charter school” report like many that have come before it leaves us sadly unfulfilled, at least with respect to its potential to provide important policy insights. Most cynically, one might argue the main finding of the report is simply that cream-skimming works – generates a solid peer effect that provides important academic advantages to a few – and serving a few is better than serving none at all (assuming the latter is really the alternative?). Keep it up! Don’t worry ’bout the rest of those kids who get shuffled off into district schools. Quite honestly, given the huge, persistent differences in student populations between high flying Newark charters and districts schools, and given the relatively consistency of research on peer group effects, it would be shocking if the CREDO report had not found that Newark charters outperform district schools.
While it is likely that there exists some strategies employed by some charters (as well as some strategies employed by some district schools) that are working quite well – THE CREDO REPORT PROVIDES ABSOLUTELY NO INSIGHTS IN THIS REGARD. It’s a classic “charter v. district” comparison – where it is assumed that “chartering” represents one set of educational/programmatic strategies and “districting” represents another – when in fact, neither is true (see the scatter of dots in my plots above to see the variations in each group!).

What about the alleged cheating at Robert Treat? How does or will this affect the report?
Macke here for the CREDO team. We examined the results without Treat and found the estimates changed only in the hundredth decimal place. In other words, no discernible impact.
I assumed you probably tested that, and given the spread/distribution of Newark Charters I suspected the shift would be negligible. Thanks!
Just curious: Did the CREDO folks observe how many of the students with disabilities and ELL students left each of the charters each year (counseled out, failed, threatened with expulsion, etc.)?
Am I reading figure 9 wrong? It looks like NPS salaries for <5 years experience is higher than all but one of the charters in the graph. I am having trouble seeing any kind of pattern at all.
NPS tends to be higher than many right at the beginning, then the others out pace them. I have a better/more refined analysis here: https://schoolfinance101.files.wordpress.com/2012/08/slide62.jpg I just didn’t get enough chance to really dig parse this today. Yes… there is big variance. TEAM… which serves more representative population, pays quite well. Others… which achieve their gains primarily by serving very different populations do seem to pay less (like Treat). More on this later. It is much more a story of variance than anything else.
I’d also like to know whether counseling out was accounted for in the study.
This report seems to raise a few questions! Assuming the creaming effect and longer school year,,one would assume that Charters would do better than Traditional Schools. Why are Charters not doing as well in the rural areas (figure 6 )and why is it that the students who have attended Charters for 3 consecutive years seem to have lost what they gained (figure 9)?
The “high flying” no excuses charter thing in NJ is pretty much exclusive to Newark, which has schools affiliated with KIPP and Uncommon Schools. Also, the extreme creaming is most prevalent in Newark.
I know that the Philosophy for Children Program serves many Newark public schools (as they are located at Montclair State College) and perhaps Charter schools too? That program has been shown to raise reading scores significantly because it focuses on thinking skills. Could this be part of Newark’s success?
Excellent report … so truthful!
However, I need to offer a small correction regarding a grammar lesson that is usually taught in First Grade.
In your closing, you wrote: “…it’s potential…” which should be–its potential– because it’s possessive.
Yes, I taught 40 years in Newark; however, I was educated in Millburn. And, yes, that made a difference in the success of my students.
Ooops. Thx.
“The use of prior academic achievement as a match factor encompasses all the unobservable characteristics of the student, such as true socioeconomic status, family background, motivation, and prior schooling.”
It seems to me that this statement from page 9 of the CREDO report cannot be supported. How can they make such a broad claim from NJ ASK test results?
Would you make the same claim about SAT results and student motivation? Why then wouldn’t the valedictorian of a high school always have the highest SAT scores since they seem to have shown the highest motivation? It would be easy to find many examples to disprove this point.
“Using statistical analysis, it is possible to isolate the contributions of schools from other social or programmatic influences on a student’s growth.”
Again, this seems to be overreaching.
You are absolutely correct here. Especially if we consider the fact that kids spend from about 8am to 3pm 185 days of their year at school. Kids in the district schools who are from substantively different backgrounds than kids in the newark charter schools are quite likely to be going home to very different households every night do do their homework – possibly in different neighbhorhoods on average (for many of these schools). This may affect sleep patterns, how well fed the kids are, etc. My previous posts also showed MUCH lower percentages of homeless kids in charters. That matters… and it contributes not only to the starting point score… but to their annual gain. Also contributing to their annual gain is that kids from more advantaged backgrounds likely have access to more productive alternatives during the summer. This too contributes not just to their starting point… but to their average annual gain – by reducing summer learning loss. So yes…. it is a completely bogus assertion to assume that initial score cancels out all socioeconomic contributions.
“Charter schools enroll roughly the same percentage of English Language Learners as found statewide in TPS.”
Um…4% = 2 x 2%
How do the CREDO folks explain that twice as large a number is “roughly the same” number?
“We were unable to find matches for 23 percent of the students; a significant share of these were grade repeaters (since many charter schools differ from TPS in their stance on social promotion), some had unusual combinations of characteristics such as ELL and SPED, and others had baseline test scores that were in the extreme tails of the distribution.”
3% of all charter school students were grade repeaters.
CREDO researchers could not match 23% of charter school students.
How can they say “significant share” when they are talking about only (3%/23% =) 13%?
Actually, I find their parenthetical particularly revealing. It seems to imply that the authors think public districts simply engage in social promotion but that charters are above that (and by no means that charters would ever possibly use placement tests as a means for counseling kids out… or that charters would have kids repeat grades simply to boost assessment results for the school). Now, I’d have been equally skeptical had they inferred what I have in my parenthetical. Either would represent a clear bias. They certainly let theirs out of the bag here! YES TPS are all pro-social-promotion? Teachers in TPS take an oath to uphold social promotion… don’t they?
“The atypical result for the 2010 growth period may reflect changes in the state achievement testing regime in the prior two years, which resulted in new standards and higher performance requirements.”
New standards? They are claiming that the new standards adopted – not yet implemented – by the State Board on June 16, 2010 somehow impacted testing in April of 2010?
If I remember correctly, the changes in cut scores for NJ ASK were for reading, and they were while Lucille Davy was commissioner. I don’t recall any changes in cut scores for math.
I give up! How can Stanford associate themselves with this group?
“The overall curve reflects the typical pattern of larger learning gains for students with lower prior scores and larger learning losses for students with higher starting scores, a phenomenon known as “regression to the mean.””
“Larger learning losses”? I don’t think so. Just lower gains since they are already close to the barrier of 100%.
Who wrote this report?
Depends on which assessments. Certainly some of the NJ assessments have pretty strong ceiling effects and clearly they authors did not explore the properties of the assessment data sufficiently. You’re on a roll!
Reblogged this on the seventh type.
In the report’s “Synthesis and Conclusions” they state:
“The difference in learning in Newark charter school equates to seven and a half months of additional learning in reading and a full year more progress in math.”
Using the word “equates” when the following caveats appear in the body of the report regarding this means of translating a standard deviation on a test into months of learning is really breathtaking:
“Transforming the results into more accessible units is challenging and can be done only imprecisely. Therefore, Table 3 below, which presents a translation of various outcomes, should be interpreted cautiously.”
Eh…. why be “cautious” or let little “challenges” like “imprecision” get in the way of some grand “conclusions”?