I read with curiosity today, the Fordham Institute’s new report on “Private Public” schools, or elementary schools where fewer than 5% of children qualify for free or reduced lunch and middle or secondary schools where fewer than 3% qualify. Not a bad idea on their part, but some of the numbers just didn’t match up with my reasonably sound knowledge of the NCES common core Public School Universe data.
For example, on Page 6, State Findings, the report indicates 70 private public schools in Illinois, and on page 7, the report indicates 402 such schools in New Jersey. These are two states where I have used the most recent available 3 years of NCES CCD data quite often. While the New Jersey numbers seem close to reasonable, the Illinois numbers are undoubtedly low – and quite honestly, wrong.
First, here’s my tally of total schools by grade level in Illinois and New Jersey:
| schlevel08
state_name | 1-Primary 2-Middle 3-High 4-Other | Total
———–+——————————————–+———-
Illinois | 2,562 777 788 203 | 4,330
New Jersey | 1,547 453 425 158 | 2,583
———–+——————————————–+———-
Total | 4,109 1,230 1,213 361 | 6,913
(sorry for the messy layout)
Next, here’s my tally for total schools by grade level with less than 5% free or reduced lunch in 2007-08:
. tab state schlevel08 if pct_freereduced08<.05
| schlevel08
state_name | 1-Primary 2-Middle 3-High 4-Other | Total
———–+——————————————–+———-
Illinois | 281 89 65 4 | 439
New Jersey | 273 98 94 7 | 472
———–+——————————————–+———-
Total | 554 187 159 11 | 911
And again in 2006-07:
. tab state schlevel08 if pct_freereduced07<.05
| schlevel08
state_name | 1-Primary 2-Middle 3-High 4-Other | Total
———–+——————————————–+———-
Illinois | 302 90 60 3 | 455
New Jersey | 194 74 73 6 | 347
———–+——————————————–+———-
Total | 496 164 133 9 | 802
In either year, and many other years, Illinois has far more than 70 elementary schools alone (280 to 300) under 5% free or reduced price lunch. The New Jersey numbers, while close, can’t be reconciled that easily either.
Fordham includes a footnote which suggests that schools reporting no children qualifying for free or reduced lunch were dropped on an assumption of non-reporting/non-participation. This is likely an incorrect assumption and one that should be checked across multiple years.
For example, here is a map of district level low income rates (background shading, based on state data source) and schools reporting “0” Free Lunch children (to NCES CCD) in North Shore areas near Chicago. Note that most of the “0” flags by schools are in very low poverty districts. These likely are “Private Public” schools by the Fordham definition, but were inappropriately excluded by their count method:
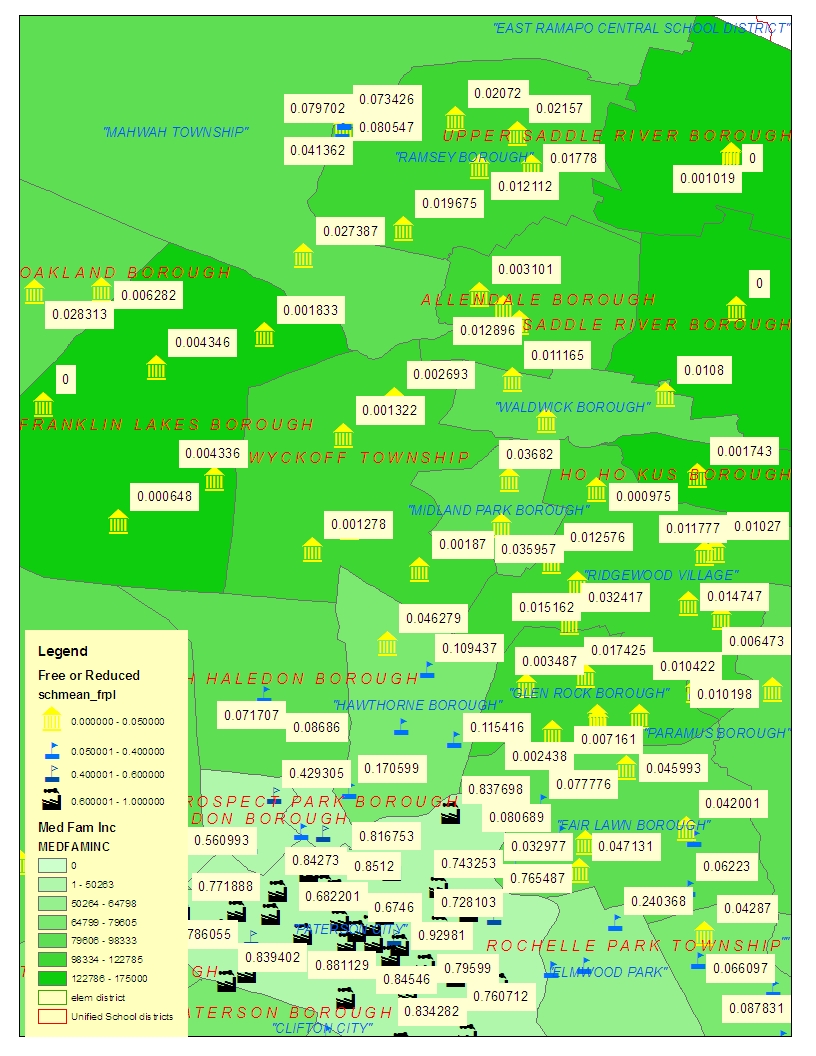
Here are some New Jersey “0” values for free or reduced lunch, against a backdrop of median family income. The “0” value schools here are in Franklin Lakes and Saddle River. I suspect that those “0” values for kids in poverty are real – not errors in the data. There were likely better ways to handle these values than to simply exclude all “0” values. For example, checking across multiple years, or identifying “0” value schools in districts that show higher versus lower U.S. Census poverty rates (not subject to district level reporting). “0” values in low poverty districts are more likely to be correct where as “0” values for schools in high poverty districts are more likely reporting error.
- Note: I just ran a quick test of this latter approach using Census Small Area Income and Poverty Estimates. About 198 of 341 Illinois “0” value schools are in districts with less than 5% poverty. About 303 of those 341 are in districts with less than 10% poverty – using Census poverty tabulations. These schools likely should have been included as “Private Publics” rather than excluded outright.
===== On a related note:
I should also point out that Fordham is among those organizations that has frequently pointed the finger at school districts as being the primary causes of persistent inequities, and not state education systems. Fordham does not point out in their report that almost invariably, these private public schools are clustered in private public school districts. The low poverty schools are in low poverty districts often immediately adjacent to high poverty schools in high poverty districts. That is, the inequity the authors reveal in this report is largely a between not within district inequity and one that cannot be resolved by reshuffling resources within districts, as many of their previous reports have argued (most notably Fund the Child).
Here’s a fun map of New Jersey Private Public Schools in the Newark metro area:


One thought on “Private Public Schools – OK Idea – Bad Calculations”
Comments are closed.